Austria Particle Board Market (2026-2032) | Analysis, Forecast, Companies, Trends, Value, Segmentation, Outlook, Share, Growth, Industry, Revenue & Size
Market Forecast By Type (Standard Chipboard, Melamine Veneered Chipboard, Flooring Grade Chipboard, Wood Veneered Chipboard, Plastic Veneered Chipboard, Other), By Application (Construction, Furniture, Infrastructure, Other) And Competitive Landscape
| Product Code: ETC5226766 | Publication Date: Nov 2023 | Updated Date: Apr 2026 | Product Type: Market Research Report | |
| Publisher: 6Wresearch | Author: Shubham Padhi | No. of Pages: 60 | No. of Figures: 30 | No. of Tables: 5 |
Austria Particle Board Market Size (2020-2030)
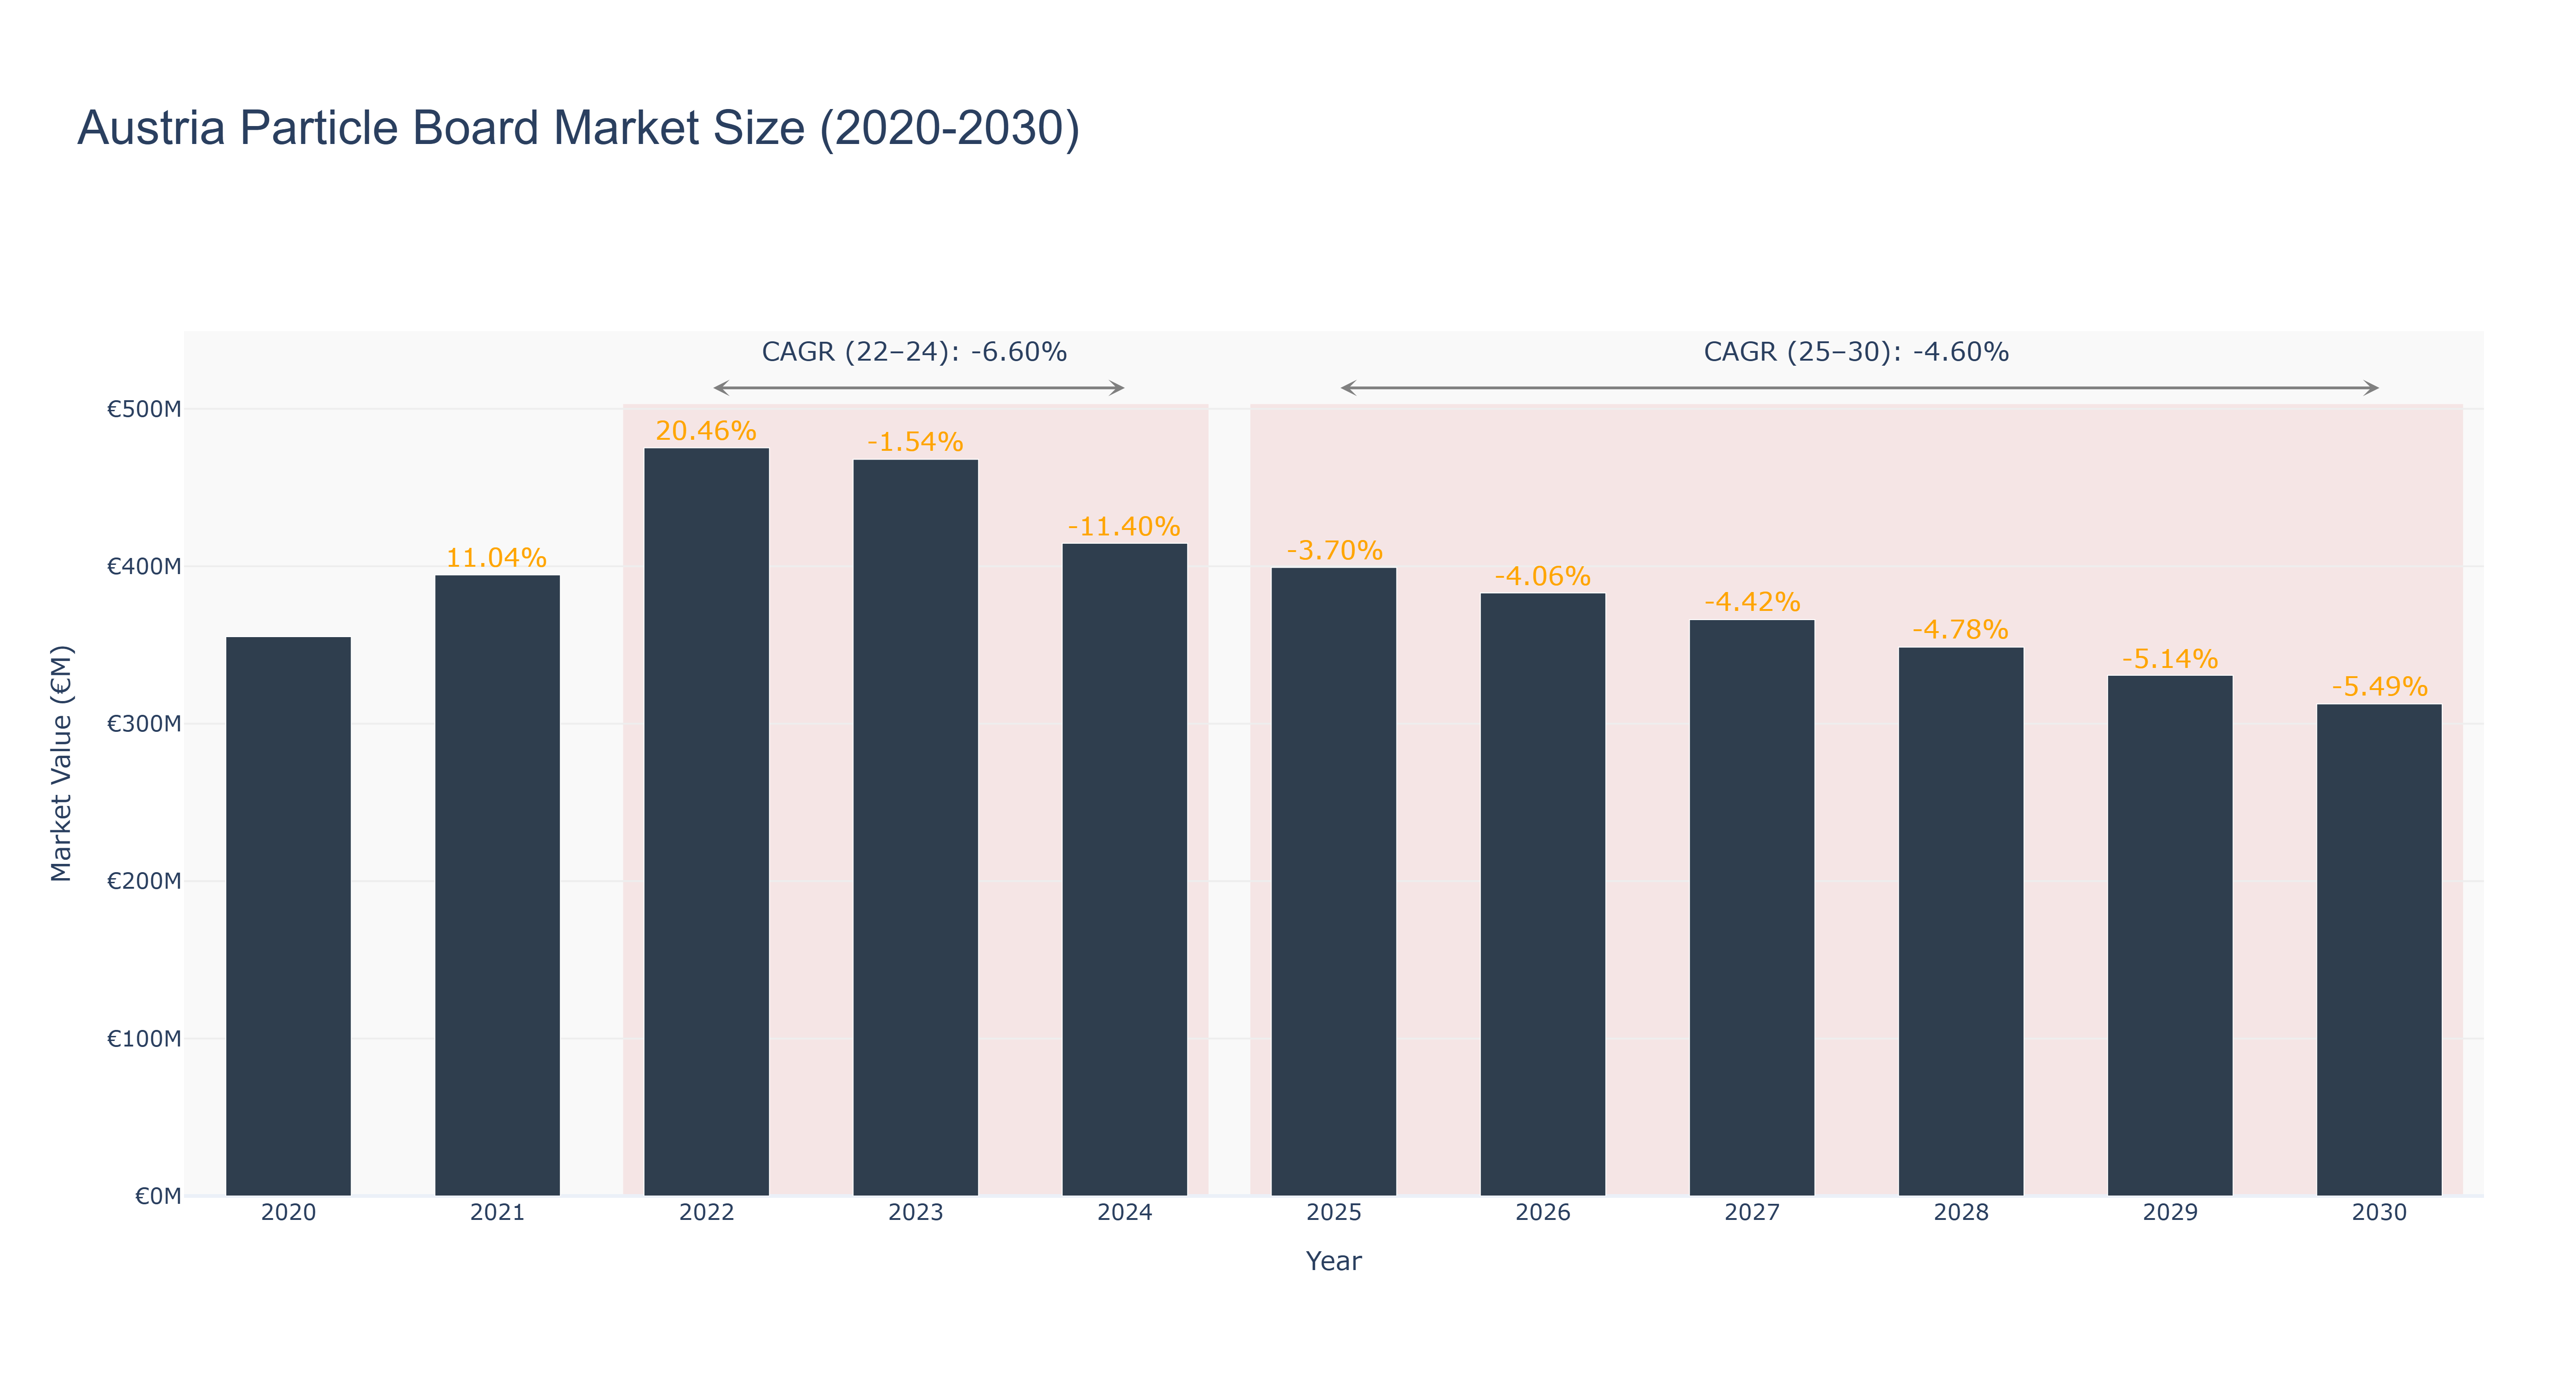
The Austria Particle Board Market experienced a peak market size of €475.25 million in 2022, followed by a decline to €312.58 million in 2030. The actual market size decreased steadily from 2020 to 2024, with a notable drop of -11.40% in 2024. The forecasted market size is expected to continue decreasing with a CAGR of -4.06% from 2025 to 2030. The market's downturn can be attributed to factors such as economic instability, changing consumer preferences, and increased competition. However, recent developments in sustainable manufacturing practices and innovative product designs are anticipated to drive growth in the Austria Particle Board Market in the near future. These initiatives aim to enhance product quality and environmental sustainability, positioning the market for potential recovery and expansion. Industry drivers such as sustainability goals, technological advancements, and evolving consumer demands are expected to shape the future trajectory of the Austria Particle Board Market.
Austria Particle Board Market: Production & Trade Performance (2019-2025)
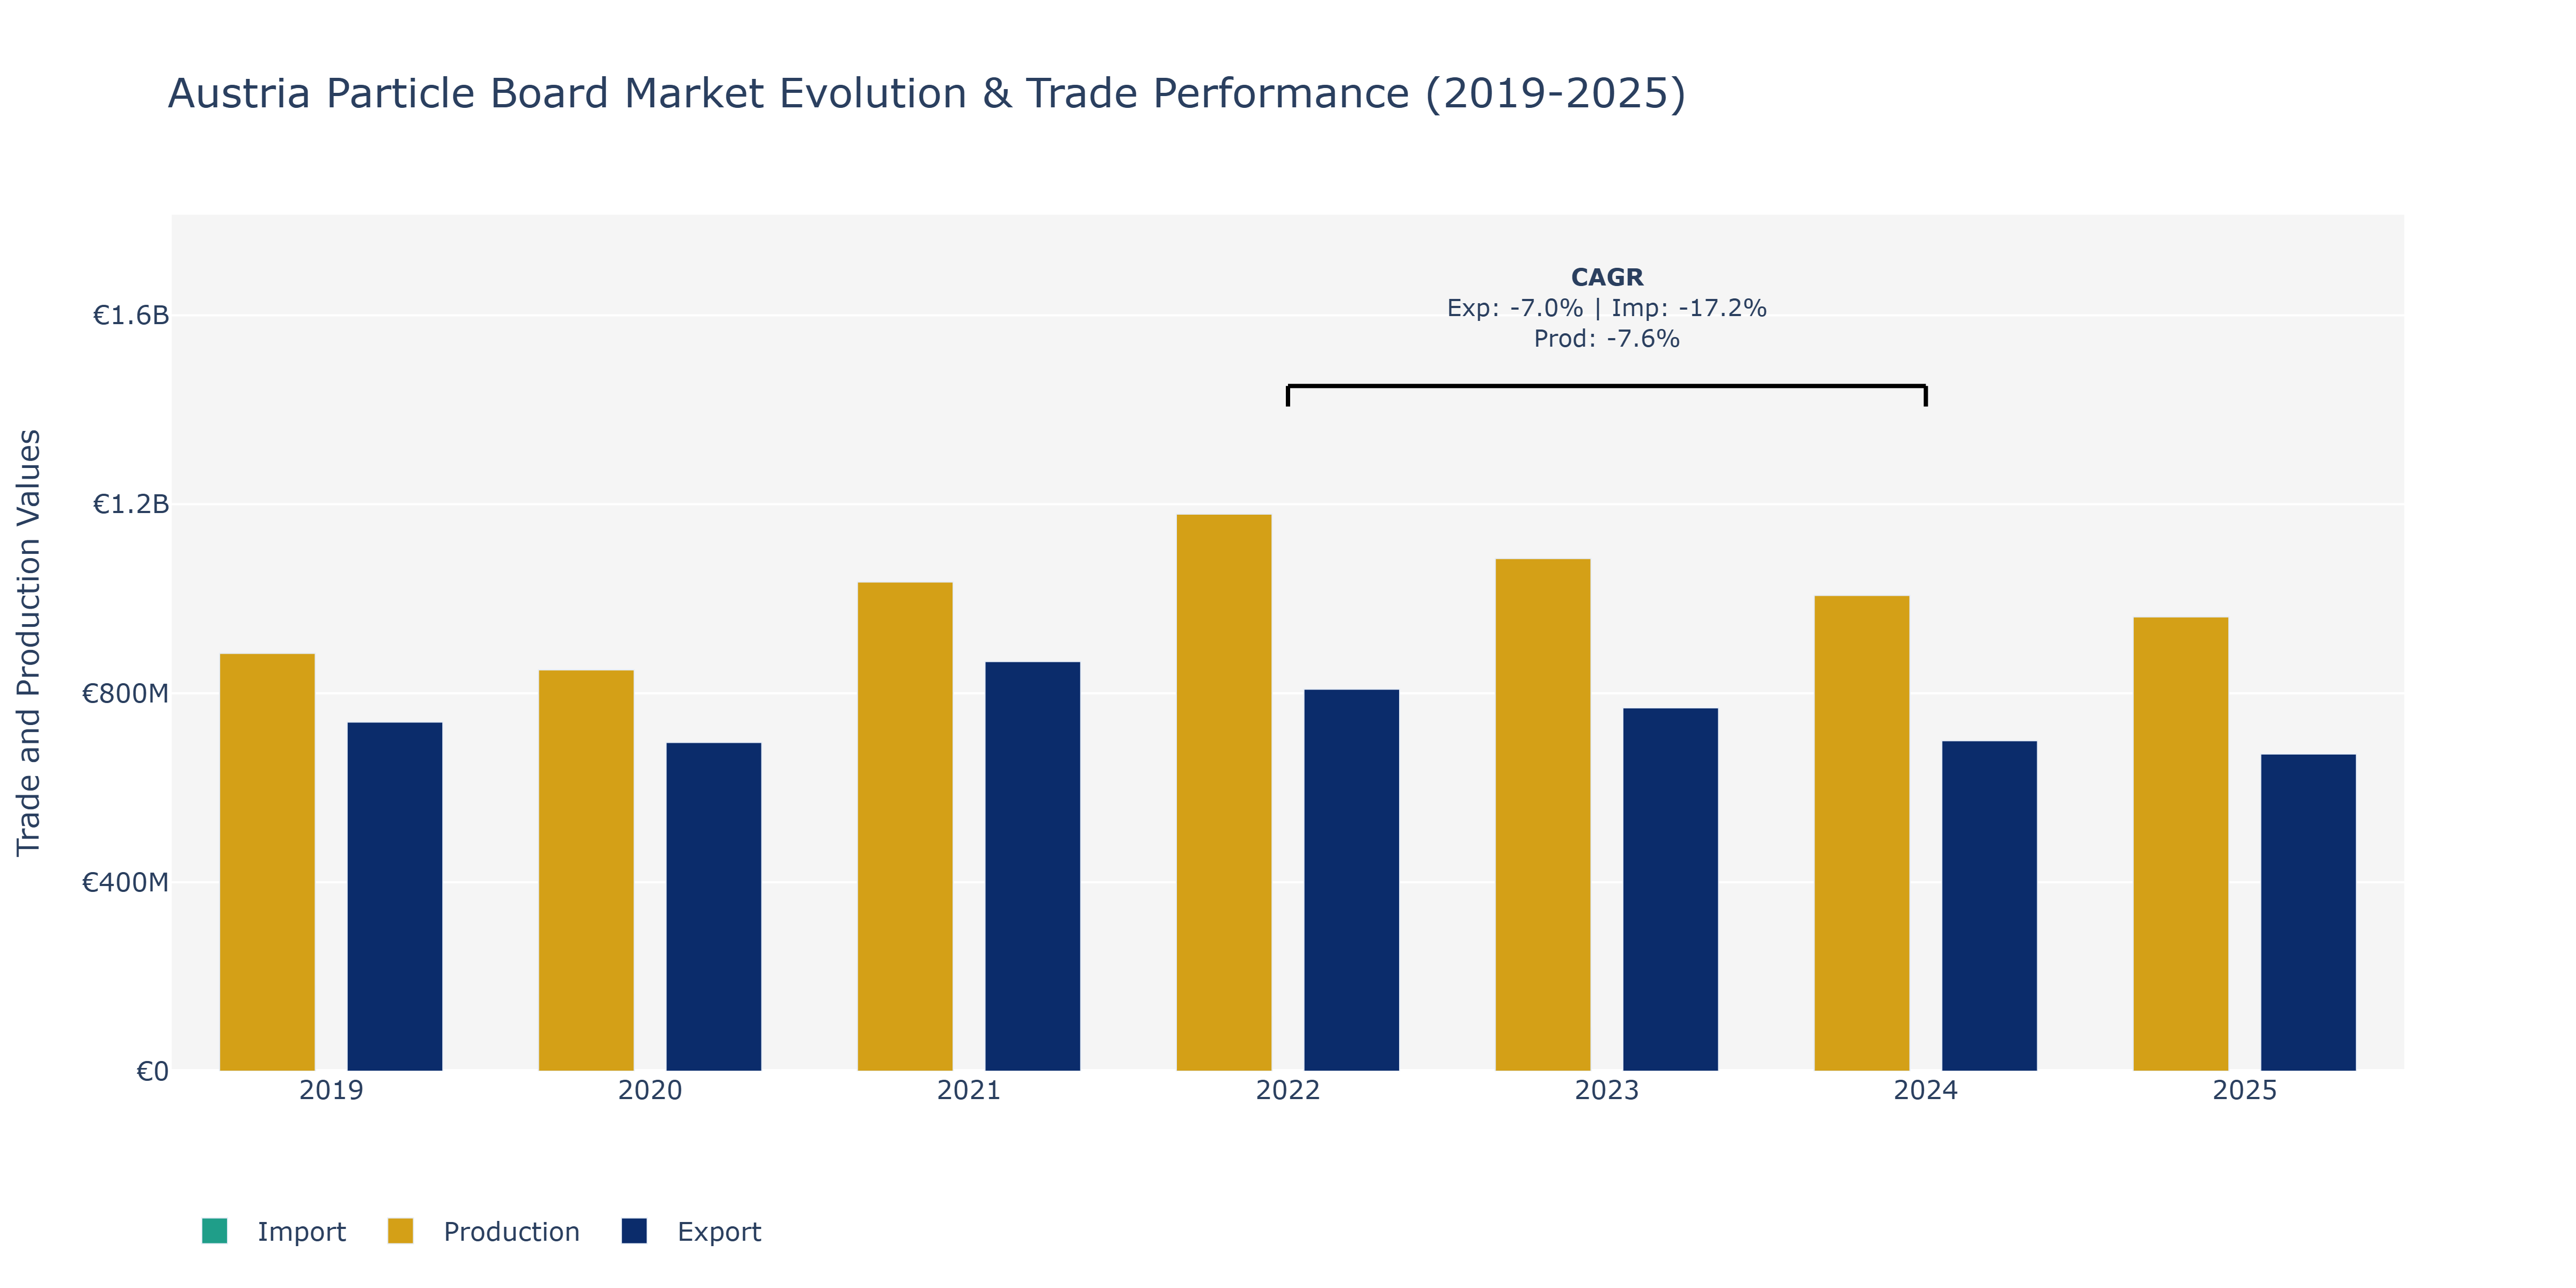
In the Austria Particle Board Market, from 2019 to 2025, the Exports saw a general decline from €738.99 million in 2019 to €671.40 million in 2025, with fluctuations in between. Imports followed a similar trend, decreasing from €181.0 million in 2019 to €69.67 million in 2025. Production levels also experienced a downward trajectory, starting at €884.26 million in 2019 and reaching €961.66 million in 2025. The peak points for Exports, Imports, and Production were observed in 2021, with values of €866.88 million, €227.17 million, and €1.04 billion, respectively. These fluctuations could be attributed to various factors such as changes in demand due to economic conditions, global market dynamics affecting trade, and shifts in consumer preferences towards alternative materials. To mitigate the decline and stabilize the market, companies may consider diversifying product offerings, exploring new export markets, and investing in sustainable production practices to align with growing environmental concerns in the industry.
Key Highlights of the Report:
- Austria Particle Board Market Outlook
- Market Size of Austria Particle Board Market, 2025
- Forecast of Austria Particle Board Market, 2032
- Historical Data and Forecast of Austria Particle Board Revenues & Volume for the Period 2022-2032F
- Austria Particle Board Market Trend Evolution
- Austria Particle Board Market Drivers and Challenges
- Austria Particle Board Price Trends
- Austria Particle Board Porter`s Five Forces
- Austria Particle Board Industry Life Cycle
- Historical Data and Forecast of Austria Particle Board Market Revenues & Volume By Type for the Period 2022-2032F
- Historical Data and Forecast of Austria Particle Board Market Revenues & Volume By Standard Chipboard for the Period 2022-2032F
- Historical Data and Forecast of Austria Particle Board Market Revenues & Volume By Melamine Veneered Chipboard for the Period 2022-2032F
- Historical Data and Forecast of Austria Particle Board Market Revenues & Volume By Flooring Grade Chipboard for the Period 2022-2032F
- Historical Data and Forecast of Austria Particle Board Market Revenues & Volume By Wood Veneered Chipboard for the Period 2022-2032F
- Historical Data and Forecast of Austria Particle Board Market Revenues & Volume By Plastic Veneered Chipboard for the Period 2022-2032F
- Historical Data and Forecast of Austria Particle Board Market Revenues & Volume By Other for the Period 2022-2032F
- Historical Data and Forecast of Austria Particle Board Market Revenues & Volume By Application for the Period 2022-2032F
- Historical Data and Forecast of Austria Particle Board Market Revenues & Volume By Construction for the Period 2022-2032F
- Historical Data and Forecast of Austria Particle Board Market Revenues & Volume By Furniture for the Period 2022-2032F
- Historical Data and Forecast of Austria Particle Board Market Revenues & Volume By Infrastructure for the Period 2022-2032F
- Historical Data and Forecast of Austria Particle Board Market Revenues & Volume By Other for the Period 2022-2032F
- Austria Particle Board Import Export Trade Statistics
- Market Opportunity Assessment By Type
- Market Opportunity Assessment By Application
- Austria Particle Board Top Companies Market Share
- Austria Particle Board Competitive Benchmarking By Technical and Operational Parameters
- Austria Particle Board Company Profiles
- Austria Particle Board Key Strategic Recommendations
Frequently Asked Questions About the Market Study (FAQs):
6Wresearch actively monitors the Austria Particle Board Market and publishes its comprehensive annual report, highlighting emerging trends, growth drivers, revenue analysis, and forecast outlook. Our insights help businesses to make data-backed strategic decisions with ongoing market dynamics. Our analysts track relevent industries related to the Austria Particle Board Market, allowing our clients with actionable intelligence and reliable forecasts tailored to emerging regional needs.
Yes, we provide customisation as per your requirements. To learn more, feel free to contact us on sales@6wresearch.com
1 Executive Summary |
2 Introduction |
2.1 Key Highlights of the Report |
2.2 Report Description |
2.3 Market Scope & Segmentation |
2.4 Research Methodology |
2.5 Assumptions |
3 Austria Particle Board Market Overview |
3.1 Austria Country Macro Economic Indicators |
3.2 Austria Particle Board Market Revenues & Volume, 2022 & 2032F |
3.3 Austria Particle Board Market - Industry Life Cycle |
3.4 Austria Particle Board Market - Porter's Five Forces |
3.5 Austria Particle Board Market Revenues & Volume Share, By Type, 2022 & 2032F |
3.6 Austria Particle Board Market Revenues & Volume Share, By Application, 2022 & 2032F |
4 Austria Particle Board Market Dynamics |
4.1 Impact Analysis |
4.2 Market Drivers |
4.2.1 Increasing demand for sustainable and eco-friendly building materials |
4.2.2 Growth in the construction industry in Austria |
4.2.3 Rising focus on cost-effective and durable furniture solutions |
4.3 Market Restraints |
4.3.1 Fluctuations in raw material prices |
4.3.2 Competition from alternative materials like MDF and plywood |
4.3.3 Regulatory challenges related to environmental standards and certifications |
5 Austria Particle Board Market Trends |
6 Austria Particle Board Market Segmentations |
6.1 Austria Particle Board Market, By Type |
6.1.1 Overview and Analysis |
6.1.2 Austria Particle Board Market Revenues & Volume, By Standard Chipboard, 2022-2032F |
6.1.3 Austria Particle Board Market Revenues & Volume, By Melamine Veneered Chipboard, 2022-2032F |
6.1.4 Austria Particle Board Market Revenues & Volume, By Flooring Grade Chipboard, 2022-2032F |
6.1.5 Austria Particle Board Market Revenues & Volume, By Wood Veneered Chipboard, 2022-2032F |
6.1.6 Austria Particle Board Market Revenues & Volume, By Plastic Veneered Chipboard, 2022-2032F |
6.1.7 Austria Particle Board Market Revenues & Volume, By Other, 2022-2032F |
6.2 Austria Particle Board Market, By Application |
6.2.1 Overview and Analysis |
6.2.2 Austria Particle Board Market Revenues & Volume, By Construction, 2022-2032F |
6.2.3 Austria Particle Board Market Revenues & Volume, By Furniture, 2022-2032F |
6.2.4 Austria Particle Board Market Revenues & Volume, By Infrastructure, 2022-2032F |
6.2.5 Austria Particle Board Market Revenues & Volume, By Other, 2022-2032F |
7 Austria Particle Board Market Import-Export Trade Statistics |
7.1 Austria Particle Board Market Export to Major Countries |
7.2 Austria Particle Board Market Imports from Major Countries |
8 Austria Particle Board Market Key Performance Indicators |
8.1 Average selling price of particle boards in Austria |
8.2 Percentage of particle board manufacturers using sustainable sourcing practices |
8.3 Adoption rate of particle boards in new construction projects |
8.4 Investment in research and development for improving particle board quality |
8.5 Customer satisfaction levels with particle board products |
9 Austria Particle Board Market - Opportunity Assessment |
9.1 Austria Particle Board Market Opportunity Assessment, By Type, 2022 & 2032F |
9.2 Austria Particle Board Market Opportunity Assessment, By Application, 2022 & 2032F |
10 Austria Particle Board Market - Competitive Landscape |
10.1 Austria Particle Board Market Revenue Share, By Companies, 2025 |
10.2 Austria Particle Board Market Competitive Benchmarking, By Operating and Technical Parameters |
11 Company Profiles |
12 Recommendations | 13 Disclaimer |
Global Go To Market Strategy - 2030
Export potential enables firms to identify high-growth global markets with greater confidence by combining advanced trade intelligence with a structured quantitative methodology. The framework analyzes emerging demand trends and country-level import patterns while integrating macroeconomic and trade datasets such as GDP and population forecasts, bilateral import–export flows, tariff structures, elasticity differentials between developed and developing economies, geographic distance, and import demand projections. Using weighted trade values from 2020–2024 as the base period to project country-to-country export potential for 2030, these inputs are operationalized through calculated drivers such as gravity model parameters, tariff impact factors, and projected GDP per-capita growth. Through an analysis of hidden potentials, demand hotspots, and market conditions that are most favorable to success, this method enables firms to focus on target countries, maximize returns, and global expansion with data, backed by accuracy.
By factoring in the projected importer demand gap that is currently unmet and could be potential opportunity, it identifies the potential for the Exporter (Country) among 190 countries, against the general trade analysis, which identifies the biggest importer or exporter.
To discover high-growth global markets and optimize your business strategy:
Click Here
Pricing
- Single User License$ 1,995
- Department License$ 2,400
- Site License$ 3,120
- Global License$ 3,795

Leadership Perspectives from Industry Events
Search
Thought Leadership and Analyst Meet


Our Clients
6WResearch In News
- India Air Conditioner Market Set for Strong Rebound in 2026 After Weather-Led Correction and GST-Driven Recovery: 6Wresearch
- ADAS in India: How Automatic Emergency Braking, Blind Spot Detection & Driver Monitoring are Transforming Road Safety
- Doha a strategic location for EV manufacturing hub: IPA Qatar
- Demand for luxury TVs surging in the GCC, says Samsung
- Empowering Growth: The Thriving Journey of Bangladesh’s Cable Industry
- Demand for luxury TVs surging in the GCC, says Samsung
Latest Reports
- Nicaragua RPG Gaming Market (2026-2032)
- New Zealand RPG Gaming Market (2026-2032)
- Netherlands RPG Gaming Market (2026-2032)
- Nauru RPG Gaming Market (2026-2032)
- Namibia RPG Gaming Market (2026-2032)
- Mozambique RPG Gaming Market (2026-2032)
- Montenegro RPG Gaming Market (2026-2032)
- Mongolia RPG Gaming Market (2026-2032)
- Monaco RPG Gaming Market (2026-2032)
- Micronesia RPG Gaming Market (2026-2032)
Industry Events and Analyst Meet

EV India Expo 2026

HIMTEX 2026

India Refining Summit 2026

India EV Show 2026

EV tech India Expo 2026
Whitepaper
- Middle East & Africa Commercial Security Market Click here to view more.
- Middle East & Africa Fire Safety Systems & Equipment Market Click here to view more.
- GCC Drone Market Click here to view more.
- Middle East Lighting Fixture Market Click here to view more.
- GCC Physical & Perimeter Security Market Click here to view more.