Denmark Stable Isotope Labeled Compound Market (2026-2032) | Segmentation, Competitive Landscape, Industry, Value, Size & Revenue, Outlook, Forecast, Companies, Analysis, Trends, Share, Growth
Market Forecast By Type (Deuterium, Carbon 12 & 13, Nitrogen 15, Oxygen 16 & 18, Lithium 6 & 7, Sulphur 34, Chlorine 35 & 37), By Application (Research, Clinical Diagnostics, Industrial), By End User (Academic & Research, Institution, Hospital & Diagnostic Centers, Pharmaceutical & Biopharmaceutical Companies) And Competitive Landscape
| Product Code: ETC6970517 | Publication Date: Sep 2024 | Updated Date: Apr 2026 | Product Type: Market Research Report | |
| Publisher: 6Wresearch | Author: Summon Dutta | No. of Pages: 75 | No. of Figures: 35 | No. of Tables: 20 |
Denmark Stable Isotope Labeled Compound Market Size (2020-2030)
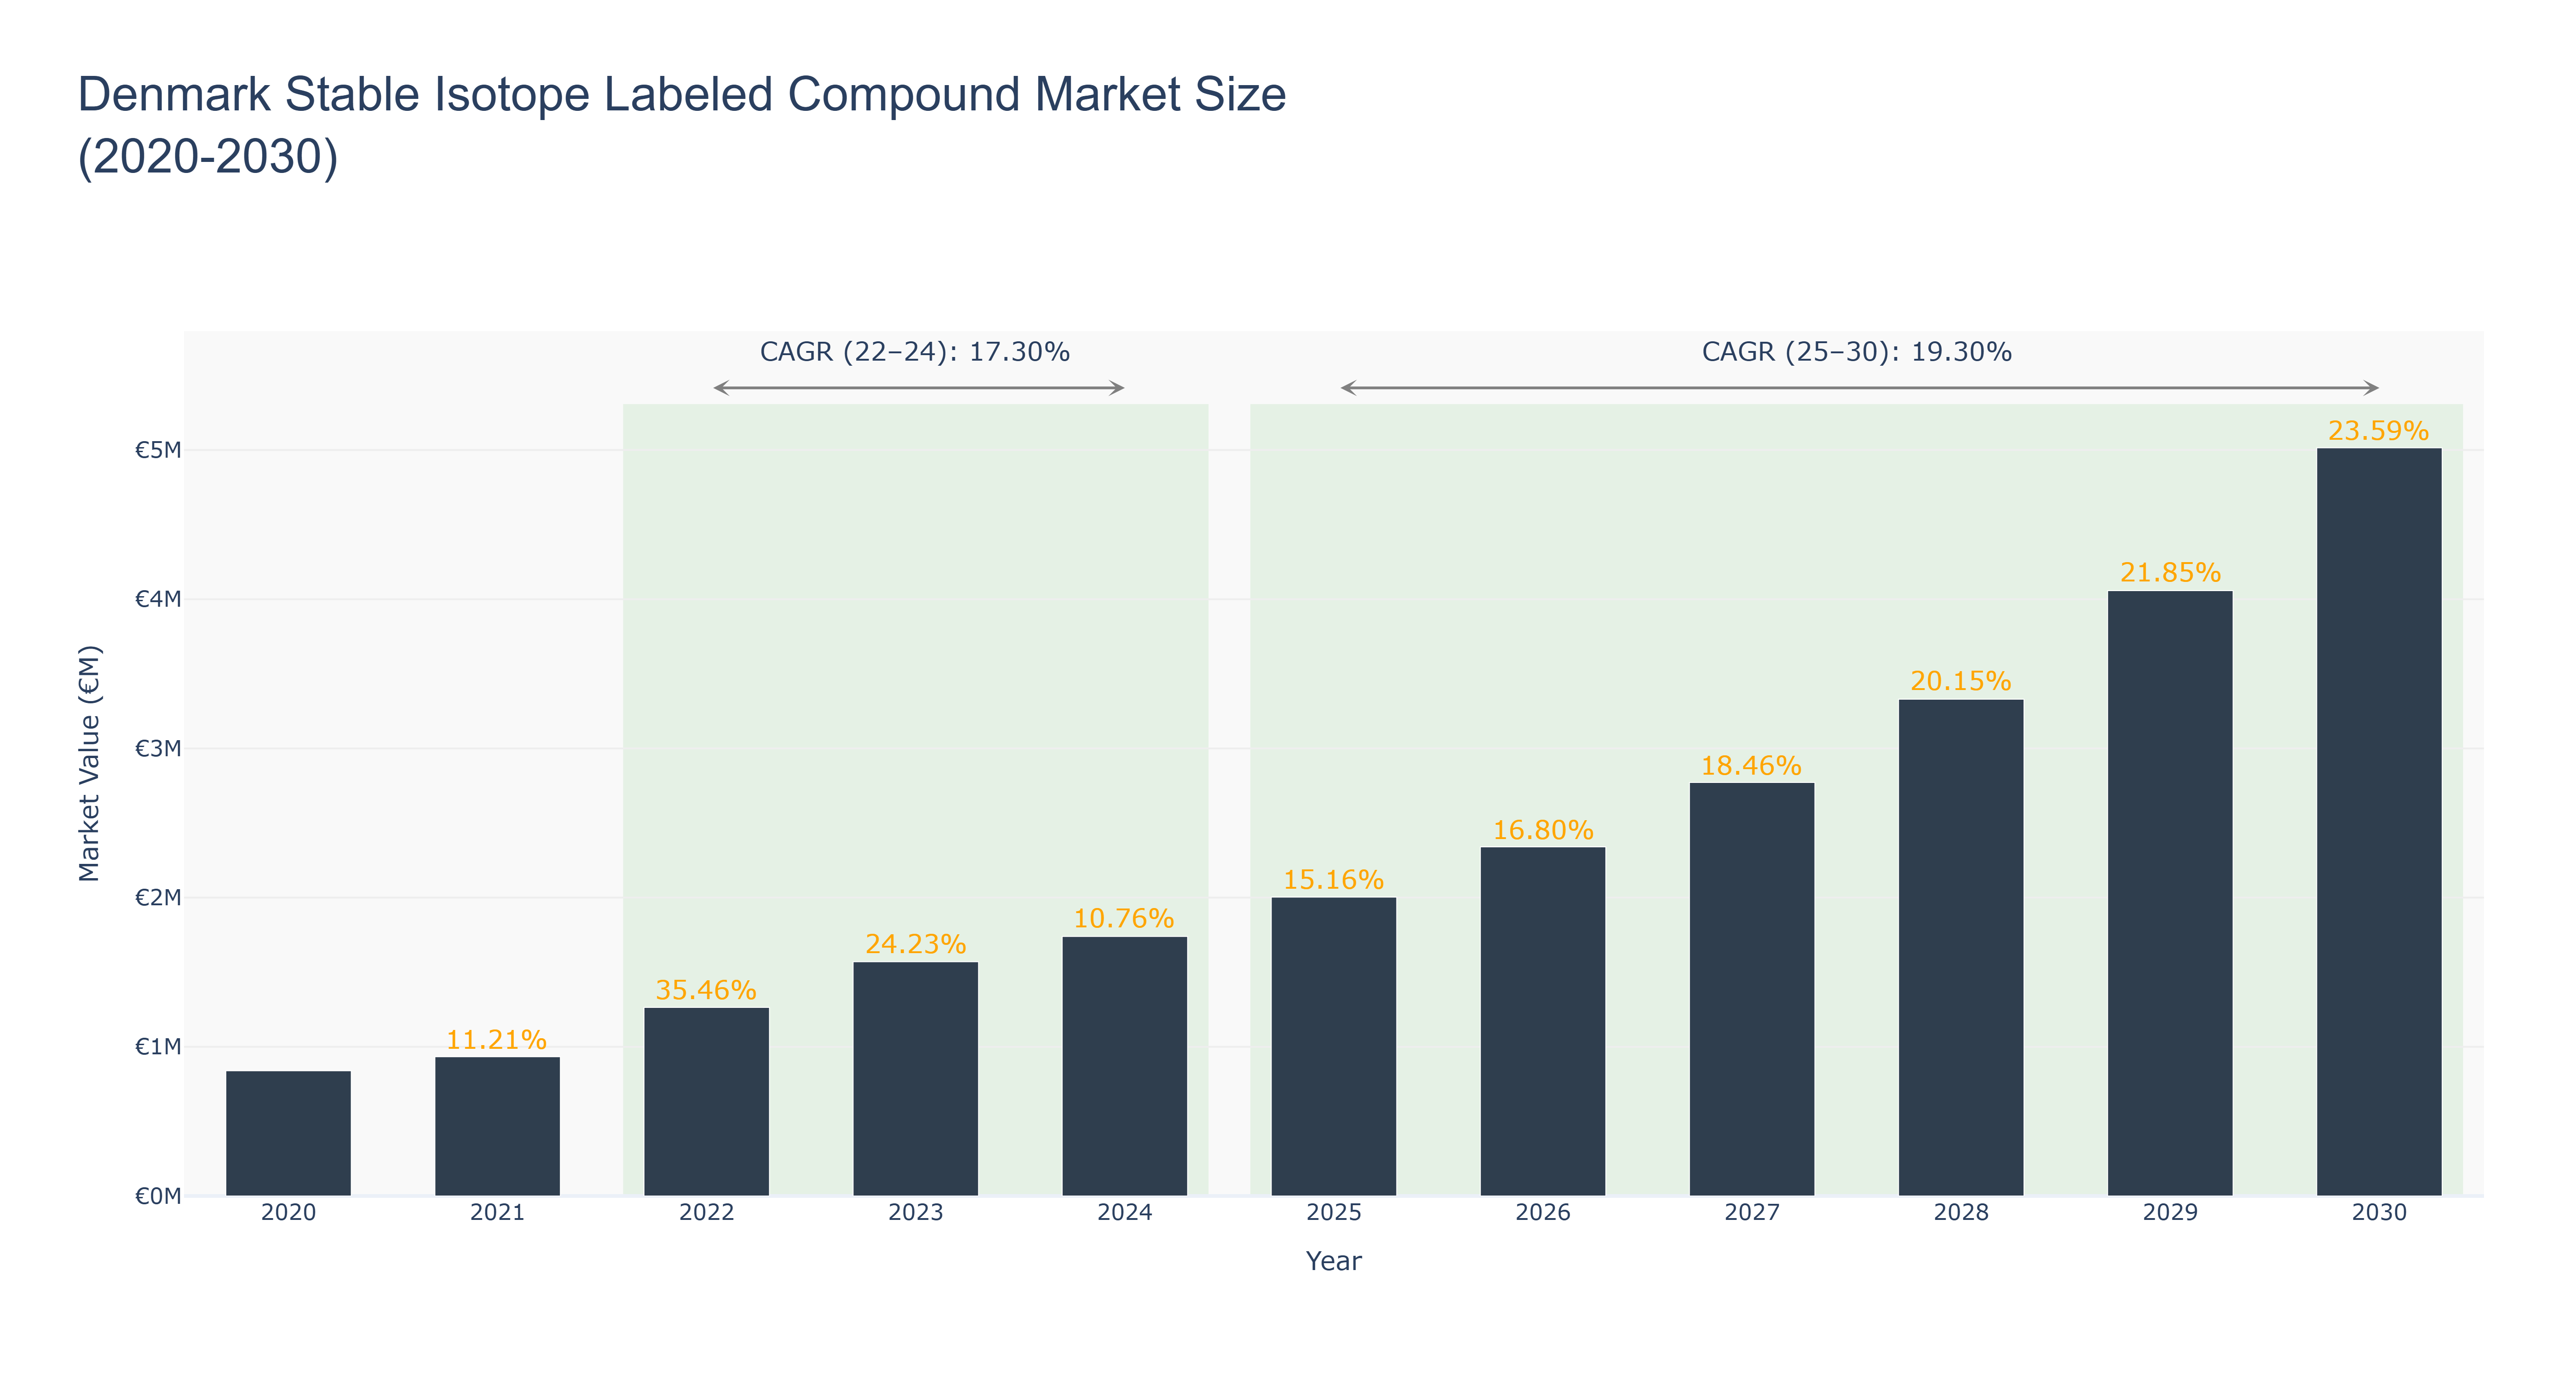
The Denmark Stable Isotope Labeled Compound Market has shown a steady growth trajectory over the years. The market reached its peak size of €5.02 million in 2030, with a notable increase in market size observed from 2020 to 2024, and a forecasted growth continuing from 2025 to 2030. The CAGR values for the market were 17.30% for the period 2022-24 and 19.30% for the period 2025-30. The market's growth can be attributed to increasing demand for stable isotope labeled compounds in various industries such as pharmaceuticals, research, and healthcare. Moving forward, Denmark is set to witness advancements in stable isotope labeling technologies, particularly in the pharmaceutical sector, aimed at enhancing drug development processes and precision medicine initiatives. Industry drivers for the Denmark Stable Isotope Labeled Compound Market include rising research and development activities, growing focus on personalized medicine, and expanding applications in metabolic studies and proteomics.
Denmark Stable Isotope Labeled Compound Market: Production & Trade Performance (2019-2025)
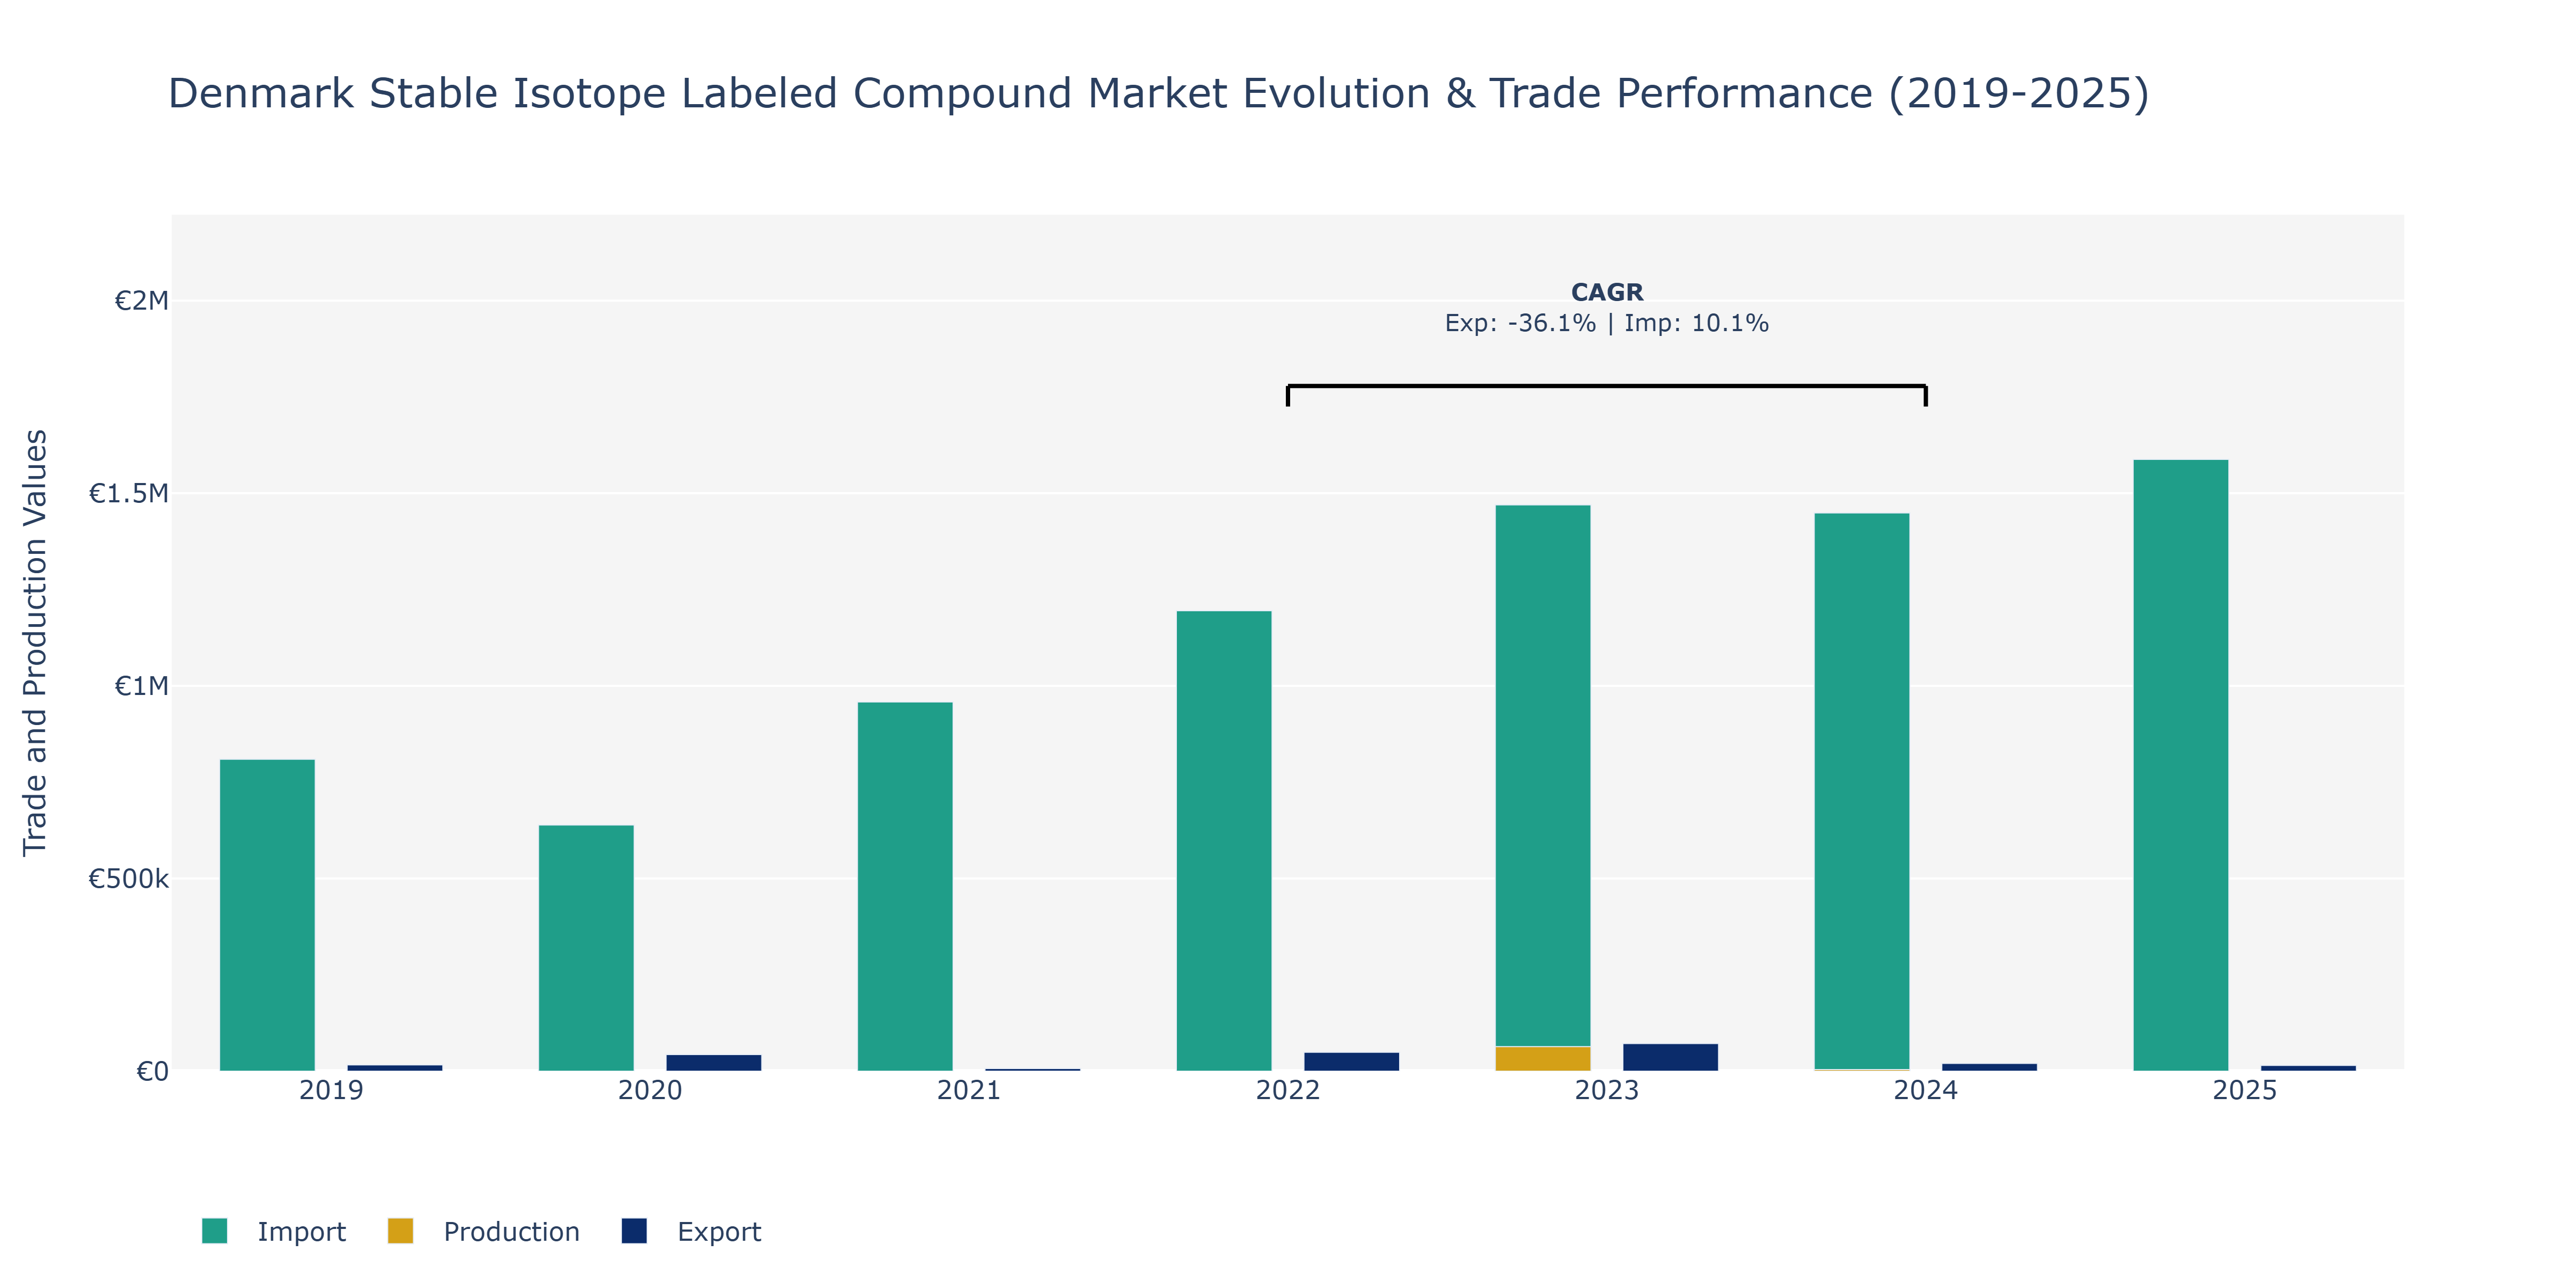
In the Denmark Stable Isotope Labeled Compound Market, from 2019 to 2025, exports exhibited notable fluctuations. Starting at €16.48 thousand in 2019, they surged to €43.31 thousand in 2020, dropped sharply to €7.00 thousand in 2021, then peaked at €71.76 thousand in 2023 before declining to €15.09 thousand in 2025. Imports followed a different trajectory, increasing consistently from €809.62 thousand in 2019 to €1.59 million in 2025. The fluctuations in exports can be attributed to changes in global demand for stable isotope labeled compounds, possibly influenced by evolving research trends or regulatory shifts impacting the market. The rise in imports reflects a growing need for these compounds domestically, potentially driven by increased research activities or expanding applications in various industries such as pharmaceuticals, environmental sciences, and healthcare.
Key Highlights of the Report:
- Denmark Stable Isotope Labeled Compound Market Outlook
- Market Size of Denmark Stable Isotope Labeled Compound Market, 2025
- Forecast of Denmark Stable Isotope Labeled Compound Market, 2032
- Historical Data and Forecast of Denmark Stable Isotope Labeled Compound Revenues & Volume for the Period 2022 - 2032
- Denmark Stable Isotope Labeled Compound Market Trend Evolution
- Denmark Stable Isotope Labeled Compound Market Drivers and Challenges
- Denmark Stable Isotope Labeled Compound Price Trends
- Denmark Stable Isotope Labeled Compound Porter's Five Forces
- Denmark Stable Isotope Labeled Compound Industry Life Cycle
- Historical Data and Forecast of Denmark Stable Isotope Labeled Compound Market Revenues & Volume By Type for the Period 2022 - 2032
- Historical Data and Forecast of Denmark Stable Isotope Labeled Compound Market Revenues & Volume By Deuterium for the Period 2022 - 2032
- Historical Data and Forecast of Denmark Stable Isotope Labeled Compound Market Revenues & Volume By Carbon 12 & 13 for the Period 2022 - 2032
- Historical Data and Forecast of Denmark Stable Isotope Labeled Compound Market Revenues & Volume By Nitrogen 15 for the Period 2022 - 2032
- Historical Data and Forecast of Denmark Stable Isotope Labeled Compound Market Revenues & Volume By Oxygen 16 & 18 for the Period 2022 - 2032
- Historical Data and Forecast of Denmark Stable Isotope Labeled Compound Market Revenues & Volume By Lithium 6 & 7 for the Period 2022 - 2032
- Historical Data and Forecast of Denmark Stable Isotope Labeled Compound Market Revenues & Volume By Sulphur 34 for the Period 2022 - 2032
- Historical Data and Forecast of Denmark Stable Isotope Labeled Compound Market Revenues & Volume By Chlorine 35 & 37 for the Period 2022 - 2032
- Historical Data and Forecast of Denmark Stable Isotope Labeled Compound Market Revenues & Volume By Application for the Period 2022 - 2032
- Historical Data and Forecast of Denmark Stable Isotope Labeled Compound Market Revenues & Volume By Research for the Period 2022 - 2032
- Historical Data and Forecast of Denmark Stable Isotope Labeled Compound Market Revenues & Volume By Clinical Diagnostics for the Period 2022 - 2032
- Historical Data and Forecast of Denmark Stable Isotope Labeled Compound Market Revenues & Volume By Industrial for the Period 2022 - 2032
- Historical Data and Forecast of Denmark Stable Isotope Labeled Compound Market Revenues & Volume By End User for the Period 2022 - 2032
- Historical Data and Forecast of Denmark Stable Isotope Labeled Compound Market Revenues & Volume By Academic & Research for the Period 2022 - 2032
- Historical Data and Forecast of Denmark Stable Isotope Labeled Compound Market Revenues & Volume By Institution for the Period 2022 - 2032
- Historical Data and Forecast of Denmark Stable Isotope Labeled Compound Market Revenues & Volume By Hospital & Diagnostic Centers for the Period 2022 - 2032
- Historical Data and Forecast of Denmark Stable Isotope Labeled Compound Market Revenues & Volume By Pharmaceutical & Biopharmaceutical Companies for the Period 2022 - 2032
- Denmark Stable Isotope Labeled Compound Import Export Trade Statistics
- Market Opportunity Assessment By Type
- Market Opportunity Assessment By Application
- Market Opportunity Assessment By End User
- Denmark Stable Isotope Labeled Compound Top Companies Market Share
- Denmark Stable Isotope Labeled Compound Competitive Benchmarking By Technical and Operational Parameters
- Denmark Stable Isotope Labeled Compound Company Profiles
- Denmark Stable Isotope Labeled Compound Key Strategic Recommendations
Frequently Asked Questions About the Market Study (FAQs):
6Wresearch actively monitors the Denmark Stable Isotope Labeled Compound Market and publishes its comprehensive annual report, highlighting emerging trends, growth drivers, revenue analysis, and forecast outlook. Our insights help businesses to make data-backed strategic decisions with ongoing market dynamics. Our analysts track relevent industries related to the Denmark Stable Isotope Labeled Compound Market, allowing our clients with actionable intelligence and reliable forecasts tailored to emerging regional needs.
Yes, we provide customisation as per your requirements. To learn more, feel free to contact us on sales@6wresearch.com
1 Executive Summary |
2 Introduction |
2.1 Key Highlights of the Report |
2.2 Report Description |
2.3 Market Scope & Segmentation |
2.4 Research Methodology |
2.5 Assumptions |
3 Denmark Stable Isotope Labeled Compound Market Overview |
3.1 Denmark Country Macro Economic Indicators |
3.2 Denmark Stable Isotope Labeled Compound Market Revenues & Volume, 2022 & 2032F |
3.3 Denmark Stable Isotope Labeled Compound Market - Industry Life Cycle |
3.4 Denmark Stable Isotope Labeled Compound Market - Porter's Five Forces |
3.5 Denmark Stable Isotope Labeled Compound Market Revenues & Volume Share, By Type, 2022 & 2032F |
3.6 Denmark Stable Isotope Labeled Compound Market Revenues & Volume Share, By Application, 2022 & 2032F |
3.7 Denmark Stable Isotope Labeled Compound Market Revenues & Volume Share, By End User, 2022 & 2032F |
4 Denmark Stable Isotope Labeled Compound Market Dynamics |
4.1 Impact Analysis |
4.2 Market Drivers |
4.3 Market Restraints |
5 Denmark Stable Isotope Labeled Compound Market Trends |
6 Denmark Stable Isotope Labeled Compound Market, By Types |
6.1 Denmark Stable Isotope Labeled Compound Market, By Type |
6.1.1 Overview and Analysis |
6.1.2 Denmark Stable Isotope Labeled Compound Market Revenues & Volume, By Type, 2022 - 2032F |
6.1.3 Denmark Stable Isotope Labeled Compound Market Revenues & Volume, By Deuterium, 2022 - 2032F |
6.1.4 Denmark Stable Isotope Labeled Compound Market Revenues & Volume, By Carbon 12 & 13, 2022 - 2032F |
6.1.5 Denmark Stable Isotope Labeled Compound Market Revenues & Volume, By Nitrogen 15, 2022 - 2032F |
6.1.6 Denmark Stable Isotope Labeled Compound Market Revenues & Volume, By Oxygen 16 & 18, 2022 - 2032F |
6.1.7 Denmark Stable Isotope Labeled Compound Market Revenues & Volume, By Lithium 6 & 7, 2022 - 2032F |
6.1.8 Denmark Stable Isotope Labeled Compound Market Revenues & Volume, By Sulphur 34, 2022 - 2032F |
6.2 Denmark Stable Isotope Labeled Compound Market, By Application |
6.2.1 Overview and Analysis |
6.2.2 Denmark Stable Isotope Labeled Compound Market Revenues & Volume, By Research, 2022 - 2032F |
6.2.3 Denmark Stable Isotope Labeled Compound Market Revenues & Volume, By Clinical Diagnostics, 2022 - 2032F |
6.2.4 Denmark Stable Isotope Labeled Compound Market Revenues & Volume, By Industrial, 2022 - 2032F |
6.3 Denmark Stable Isotope Labeled Compound Market, By End User |
6.3.1 Overview and Analysis |
6.3.2 Denmark Stable Isotope Labeled Compound Market Revenues & Volume, By Academic & Research, 2022 - 2032F |
6.3.3 Denmark Stable Isotope Labeled Compound Market Revenues & Volume, By Institution, 2022 - 2032F |
6.3.4 Denmark Stable Isotope Labeled Compound Market Revenues & Volume, By Hospital & Diagnostic Centers, 2022 - 2032F |
6.3.5 Denmark Stable Isotope Labeled Compound Market Revenues & Volume, By Pharmaceutical & Biopharmaceutical Companies, 2022 - 2032F |
7 Denmark Stable Isotope Labeled Compound Market Import-Export Trade Statistics |
7.1 Denmark Stable Isotope Labeled Compound Market Export to Major Countries |
7.2 Denmark Stable Isotope Labeled Compound Market Imports from Major Countries |
8 Denmark Stable Isotope Labeled Compound Market Key Performance Indicators |
9 Denmark Stable Isotope Labeled Compound Market - Opportunity Assessment |
9.1 Denmark Stable Isotope Labeled Compound Market Opportunity Assessment, By Type, 2022 & 2032F |
9.2 Denmark Stable Isotope Labeled Compound Market Opportunity Assessment, By Application, 2022 & 2032F |
9.3 Denmark Stable Isotope Labeled Compound Market Opportunity Assessment, By End User, 2022 & 2032F |
10 Denmark Stable Isotope Labeled Compound Market - Competitive Landscape |
10.1 Denmark Stable Isotope Labeled Compound Market Revenue Share, By Companies, 2025 |
10.2 Denmark Stable Isotope Labeled Compound Market Competitive Benchmarking, By Operating and Technical Parameters |
11 Company Profiles |
12 Recommendations |
13 Disclaimer |
Global Go To Market Strategy - 2030
Export potential enables firms to identify high-growth global markets with greater confidence by combining advanced trade intelligence with a structured quantitative methodology. The framework analyzes emerging demand trends and country-level import patterns while integrating macroeconomic and trade datasets such as GDP and population forecasts, bilateral import–export flows, tariff structures, elasticity differentials between developed and developing economies, geographic distance, and import demand projections. Using weighted trade values from 2020–2024 as the base period to project country-to-country export potential for 2030, these inputs are operationalized through calculated drivers such as gravity model parameters, tariff impact factors, and projected GDP per-capita growth. Through an analysis of hidden potentials, demand hotspots, and market conditions that are most favorable to success, this method enables firms to focus on target countries, maximize returns, and global expansion with data, backed by accuracy.
By factoring in the projected importer demand gap that is currently unmet and could be potential opportunity, it identifies the potential for the Exporter (Country) among 190 countries, against the general trade analysis, which identifies the biggest importer or exporter.
To discover high-growth global markets and optimize your business strategy:
Click Here
Pricing
- Single User License$ 1,995
- Department License$ 2,400
- Site License$ 3,120
- Global License$ 3,795

Leadership Perspectives from Industry Events
Search
Thought Leadership and Analyst Meet


Our Clients
6WResearch In News
- India Air Conditioner Market Set for Strong Rebound in 2026 After Weather-Led Correction and GST-Driven Recovery: 6Wresearch
- ADAS in India: How Automatic Emergency Braking, Blind Spot Detection & Driver Monitoring are Transforming Road Safety
- Doha a strategic location for EV manufacturing hub: IPA Qatar
- Demand for luxury TVs surging in the GCC, says Samsung
- Empowering Growth: The Thriving Journey of Bangladesh’s Cable Industry
- Demand for luxury TVs surging in the GCC, says Samsung
Latest Reports
- Nicaragua RPG Gaming Market (2026-2032)
- New Zealand RPG Gaming Market (2026-2032)
- Netherlands RPG Gaming Market (2026-2032)
- Nauru RPG Gaming Market (2026-2032)
- Namibia RPG Gaming Market (2026-2032)
- Mozambique RPG Gaming Market (2026-2032)
- Montenegro RPG Gaming Market (2026-2032)
- Mongolia RPG Gaming Market (2026-2032)
- Monaco RPG Gaming Market (2026-2032)
- Micronesia RPG Gaming Market (2026-2032)
Industry Events and Analyst Meet

EV India Expo 2026

HIMTEX 2026

India Refining Summit 2026

India EV Show 2026

EV tech India Expo 2026
Whitepaper
- Middle East & Africa Commercial Security Market Click here to view more.
- Middle East & Africa Fire Safety Systems & Equipment Market Click here to view more.
- GCC Drone Market Click here to view more.
- Middle East Lighting Fixture Market Click here to view more.
- GCC Physical & Perimeter Security Market Click here to view more.