Kenya Coding And Marking Systems Market (2026-2032) Outlook | Revenue, Size, Share, Analysis, Trends, Industry, Companies, Forecast, Growth & Value
Market Forecast By Technology (Continuous Inkjet, Laser Coding, Marking, Thermal Ink Jet Printer, Drop On Demand, Print and Apply Labelers, Thermal Transfer Overprinting), By End-User (Food and Beverage, Electrical and Electronics, Automotive and Aerospace, Chemical, Healthcare) And Competitive Landscape
| Product Code: ETC251510 | Publication Date: Aug 2022 | Updated Date: Jul 2026 | Product Type: Market Research Report | |
| Publisher: 6Wresearch | Author: Ravi Bhandari | No. of Pages: 75 | No. of Figures: 35 | No. of Tables: 20 |
Kenya Coding And Marking Systems Market Size, Share & Growth Rate
The Kenya Coding And Marking Systems Market was estimated at USD 285 Million in 2025 and is projected to reach USD 383 Million by 2032, growing at a CAGR of 4.3% from 2026 to 2032. This growth is largely attributed to the increased demand for product traceability across various sectors, especially food and beverage, pharmaceuticals, and cosmetics. As regulatory frameworks tighten and consumer expectations rise regarding product safety and authenticity, businesses are increasingly adopting advanced coding and marking technologies to enhance compliance and protect their brands.
Kenya Coding And Marking Systems Market Year-wise Growth Rate and Key Drivers
This graph highlights how the Kenya Coding And Marking Systems Market has steadily grown over the years, supported by major growth factors.
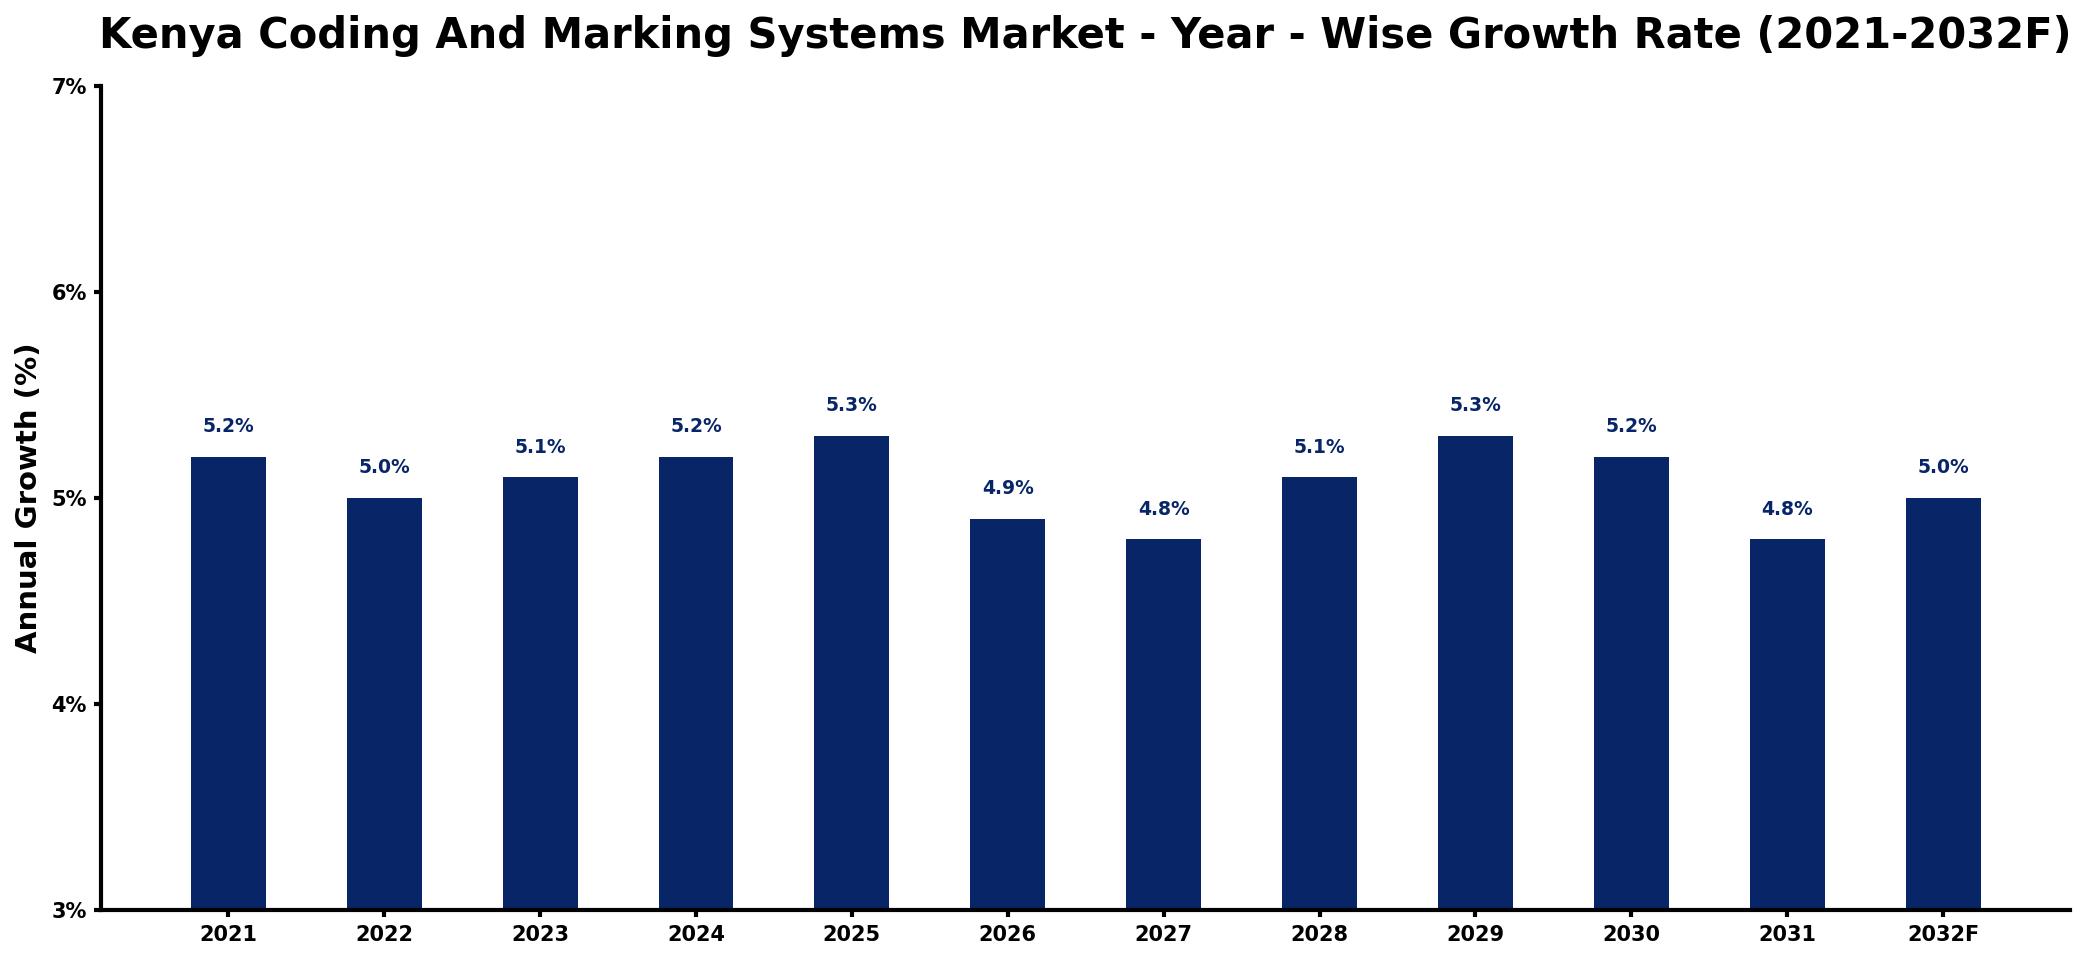
The table below presents the year‑wise growth rates along with the key drivers influencing the market
| Year | Growth Rate | Major Drivers |
| 2021 | 5.2% | Rising demand for automation solutions |
| 2022 | 5.0% | Expansion of manufacturing capacities |
| 2023 | 5.1% | Growth in retail sector investments |
| 2024 | 5.2% | Increased focus on compliance standards |
| 2025 | 5.3% | Surge in e-commerce packaging needs |
| 2026 | 4.9% | Emergence of sustainable packaging trends |
| 2027 | 4.8% | improved raw material availability |
| 2028 | 5.1% | Investment in smart manufacturing technologies |
| 2029 | 5.3% | rising export shipment volumes |
| 2030 | 5.2% | Rise in pharmaceutical production facilities |
| 2031 | 4.8% | Increased adoption of digital solutions |
| 2032 | 5.0% | expanding industrial usage applications |
Note: Market size estimations and growth projections presented in this report are based on 6Wresearch's proprietary forecasting methodology, utilizing the latest available industry data, government publications, and primary research inputs.
Kenya Coding And Marking Systems Market Synopsis
In Kenya, coding and marking systems are essential for industries striving to meet stringent labeling regulations. Technologies like inkjet printing and laser marking enable manufacturers to efficiently print critical information, such as batch numbers and expiry dates, directly on packaging. This capability not only ensures compliance but also boosts consumer confidence through better product transparency.
The increasing incidence of counterfeit products has further emphasized the need for robust coding and marking solutions. As businesses prioritize brand protection, advanced serialization techniques and automation in production lines are becoming more prevalent. This shift not only streamlines operations but also enhances overall supply chain efficiency.
Kenya Coding And Marking Systems Market Key Takeaways
- Robust growth driven by regulatory demands and enhanced product traceability.
- Technological advancements are facilitating better compliance and brand protection.
- Adoption of serialization and automation technologies is on the rise.
- Awareness and infrastructure gaps are current limitations to market expansion.
- Opportunities for investments in technology adoption and local manufacturing initiatives.
Evaluation of Restraints in Kenya Coding And Marking Systems Market
Despite the positive growth trajectory, the Kenya Coding and Marking Systems Market faces several restraints. A significant challenge is the limited awareness among manufacturers regarding the benefits of implementing advanced coding technologies for product traceability and compliance. Additionally, infrastructure limitations present barriers to effective installation and maintenance of these systems, particularly in remote regions. Such constraints can hinder the adoption of necessary technologies, slowing overall market growth.
Kenya Coding And Marking Systems Market Trends
Current trends in the Kenya Coding And Marking Systems Market include a notable shift toward automation in manufacturing processes. Companies are increasingly investing in sophisticated coding technologies that not only enhance efficiency but also minimize human error. Moreover, the adoption of sustainable practices is gaining traction, with manufacturers seeking eco-friendly inks and materials for labeling.
Another emerging trend is the integration of software solutions that enable real-time tracking and management of inventory through coded labels. These advancements in technology are not just improving operational efficiency; they are also fostering greater consumer trust by ensuring transparency in product origins.
Kenya Coding And Marking Systems Market Opportunities
Significant growth opportunities exist within the Kenya Coding And Marking Systems Market, particularly as businesses respond to rising consumer awareness about product integrity. Companies that invest in advanced coding systems can effectively differentiate themselves in a crowded marketplace. Furthermore, with ongoing government initiatives aimed at bolstering local manufacturing and compliance, there is potential for partnerships and collaborations that enhance technology adoption and drive innovation in the sector.
Government Initiatives in the Kenya Coding And Marking Systems Market
Government policies play a crucial role in shaping the Kenya Coding And Marking Systems Market. Regulatory frameworks increasingly mandate stringent labeling and traceability standards to enhance consumer safety. Initiatives aimed at promoting local manufacturing capabilities and technology adoption are also being implemented, further supporting the growth of this market. These efforts are vital in fostering an environment where compliance and innovation can flourish.
Future Insights of the Kenya Coding And Marking Systems Market
Looking ahead to 2026-2032, the Kenya Coding And Marking Systems Market is poised for significant evolution. As regulatory requirements continue to tighten, businesses will increasingly seek innovative coding solutions to enhance compliance and operational efficiency. The growing focus on sustainability will likely drive the demand for eco-friendly marking technologies. Overall, the market is expected to adapt swiftly to changing consumer expectations and regulatory landscapes, presenting a dynamic environment for continued investment and development.
Kenya Coding And Marking Systems Market Latest Developments (2025 - 2026)
Recent industry developments indicate a strong move toward the integration of smart technologies within coding and marking systems. Companies are experimenting with machine learning and IoT solutions to enhance tracking and verification processes. Additionally, there has been a noticeable push for educational campaigns aimed at increasing awareness of coding and marking solutions among local manufacturers, which could significantly impact future adoption rates.
Kenya Coding And Marking Systems Market - Key Attractiveness of the Report
- 10 Years of Market Numbers
- Historical Data Starting from 2022 to 2025
- Base Year: 2025
- Forecast Data until 2032
- Key Performance Indicators Impacting the Market
- Major Upcoming Developments and Projects
Key Highlights of the Report:
- Kenya Coding And Marking Systems Market Outlook
- Market Size of Kenya Coding And Marking Systems Market, 2025
- Forecast of Kenya Coding And Marking Systems Market, 2032
- Historical Data and Forecast of Kenya Coding And Marking Systems Revenues & Volume for the Period 2022-2032F
- Kenya Coding And Marking Systems Market Trend Evolution
- Kenya Coding And Marking Systems Market Drivers and Challenges
- Kenya Coding And Marking Systems Price Trends
- Kenya Coding And Marking Systems Porter's Five Forces
- Kenya Coding And Marking Systems Industry Life Cycle
- Historical Data and Forecast of Kenya Coding And Marking Systems Market Revenues & Volume By Technology for the Period 2022-2032F
- Historical Data and Forecast of Kenya Coding And Marking Systems Market Revenues & Volume By Continuous Inkjet for the Period 2022-2032F
- Historical Data and Forecast of Kenya Coding And Marking Systems Market Revenues & Volume By Laser Coding for the Period 2022-2032F
- Historical Data and Forecast of Kenya Coding And Marking Systems Market Revenues & Volume By Marking for the Period 2022-2032F
- Historical Data and Forecast of Kenya Coding And Marking Systems Market Revenues & Volume By Thermal Ink Jet Printer for the Period 2022-2032F
- Historical Data and Forecast of Kenya Coding And Marking Systems Market Revenues & Volume By Drop On Demand for the Period 2022-2032F
- Historical Data and Forecast of Kenya Coding And Marking Systems Market Revenues & Volume By Print and Apply Labelers for the Period 2022-2032F
- Historical Data and Forecast of Kenya Coding And Marking Systems Market Revenues & Volume By Thermal Transfer Overprinting for the Period 2022-2032F
- Historical Data and Forecast of Kenya Coding And Marking Systems Market Revenues & Volume By End-User for the Period 2022-2032F
- Historical Data and Forecast of Kenya Coding And Marking Systems Market Revenues & Volume By Food and Beverage for the Period 2022-2032F
- Historical Data and Forecast of Kenya Coding And Marking Systems Market Revenues & Volume By Electrical and Electronics for the Period 2022-2032F
- Historical Data and Forecast of Kenya Coding And Marking Systems Market Revenues & Volume By Automotive and Aerospace for the Period 2022-2032F
- Historical Data and Forecast of Kenya Coding And Marking Systems Market Revenues & Volume By Chemical for the Period 2022-2032F
- Historical Data and Forecast of Kenya Coding And Marking Systems Market Revenues & Volume By Healthcare for the Period 2022-2032F
- Kenya Coding And Marking Systems Import Export Trade Statistics
- Market Opportunity Assessment By Technology
- Market Opportunity Assessment By End-User
- Kenya Coding And Marking Systems Top Companies Market Share
- Kenya Coding And Marking Systems Competitive Benchmarking By Technical and Operational Parameters
- Kenya Coding And Marking Systems Company Profiles
- Kenya Coding And Marking Systems Key Strategic Recommendations
Frequently Asked Questions About the Market Study (FAQs):
The market is projected to grow from USD 285 Million in 2025 to USD 383 Million by 2032, reflecting a CAGR of 4.3% from 2026 to 2032.
Key demand drivers include stringent regulatory requirements for product labeling and a rising focus on brand protection amidst increasing counterfeit threats.
The food and beverage, pharmaceuticals, and cosmetics industries are at the forefront, driven by the need for compliance and traceability.
Manufacturers often struggle with limited awareness of the benefits and infrastructure limitations that impede effective implementation and maintenance of these technologies.
Yes, there is substantial opportunity for businesses that invest in sustainable coding technologies and automation, as they align with both consumer expectations and regulatory trends.
6Wresearch actively monitors the Kenya Coding And Marking Systems Market and publishes its comprehensive annual report, highlighting emerging trends, growth drivers, revenue analysis, and forecast outlook. Our insights help businesses to make data-backed strategic decisions with ongoing market dynamics. Our analysts track relevent industries related to the Kenya Coding And Marking Systems Market, allowing our clients with actionable intelligence and reliable forecasts tailored to emerging regional needs.
Yes, we provide customisation as per your requirements. To learn more, feel free to contact us on sales@6wresearch.com
1 Executive Summary |
2 Introduction |
2.1 Key Highlights of the Report |
2.2 Report Description |
2.3 Market Scope & Segmentation |
2.4 Research Methodology |
2.5 Assumptions |
3 Kenya Coding And Marking Systems Market Overview |
3.1 Kenya Country Macro Economic Indicators |
3.2 Kenya Coding And Marking Systems Market Revenues & Volume, 2022 & 2032F |
3.3 Kenya Coding And Marking Systems Market - Industry Life Cycle |
3.4 Kenya Coding And Marking Systems Market - Porter's Five Forces |
3.5 Kenya Coding And Marking Systems Market Revenues & Volume Share, By Technology, 2022 & 2032F |
3.6 Kenya Coding And Marking Systems Market Revenues & Volume Share, By End-User, 2022 & 2032F |
4 Kenya Coding And Marking Systems Market Dynamics |
4.1 Impact Analysis |
4.2 Market Drivers |
4.2.1 Increasing demand for product traceability and anti-counterfeiting measures in industries like pharmaceuticals and food beverage |
4.2.2 Growing adoption of coding and marking systems for inventory management and supply chain optimization |
4.2.3 Technological advancements leading to more efficient and versatile coding and marking solutions |
4.3 Market Restraints |
4.3.1 High initial investment costs associated with implementing coding and marking systems |
4.3.2 Lack of awareness and technical expertise among small and medium-sized enterprises |
4.3.3 Regulatory challenges and compliance requirements in certain industries |
5 Kenya Coding And Marking Systems Market Trends |
6 Kenya Coding And Marking Systems Market, By Types |
6.1 Kenya Coding And Marking Systems Market, By Technology |
6.1.1 Overview and Analysis |
6.1.2 Kenya Coding And Marking Systems Market Revenues & Volume, By Technology, 2022-2032F |
6.1.3 Kenya Coding And Marking Systems Market Revenues & Volume, By Continuous Inkjet, 2022-2032F |
6.1.4 Kenya Coding And Marking Systems Market Revenues & Volume, By Laser Coding, 2022-2032F |
6.1.5 Kenya Coding And Marking Systems Market Revenues & Volume, By Marking, 2022-2032F |
6.1.6 Kenya Coding And Marking Systems Market Revenues & Volume, By Thermal Ink Jet Printer, 2022-2032F |
6.1.7 Kenya Coding And Marking Systems Market Revenues & Volume, By Drop On Demand, 2022-2032F |
6.1.8 Kenya Coding And Marking Systems Market Revenues & Volume, By Print and Apply Labelers, 2022-2032F |
6.2 Kenya Coding And Marking Systems Market, By End-User |
6.2.1 Overview and Analysis |
6.2.2 Kenya Coding And Marking Systems Market Revenues & Volume, By Food and Beverage, 2022-2032F |
6.2.3 Kenya Coding And Marking Systems Market Revenues & Volume, By Electrical and Electronics, 2022-2032F |
6.2.4 Kenya Coding And Marking Systems Market Revenues & Volume, By Automotive and Aerospace, 2022-2032F |
6.2.5 Kenya Coding And Marking Systems Market Revenues & Volume, By Chemical, 2022-2032F |
6.2.6 Kenya Coding And Marking Systems Market Revenues & Volume, By Healthcare, 2022-2032F |
7 Kenya Coding And Marking Systems Market Import-Export Trade Statistics |
7.1 Kenya Coding And Marking Systems Market Export to Major Countries |
7.2 Kenya Coding And Marking Systems Market Imports from Major Countries |
8 Kenya Coding And Marking Systems Market Key Performance Indicators |
8.1 Overall equipment effectiveness (OEE) improvement due to the implementation of coding and marking systems |
8.2 Reduction in product recalls and errors in coding and marking |
8.3 Increase in production efficiency and throughput rates due to better inventory tracking and management |
9 Kenya Coding And Marking Systems Market - Opportunity Assessment |
9.1 Kenya Coding And Marking Systems Market Opportunity Assessment, By Technology, 2022 & 2032F |
9.2 Kenya Coding And Marking Systems Market Opportunity Assessment, By End-User, 2022 & 2032F |
10 Kenya Coding And Marking Systems Market - Competitive Landscape |
10.1 Kenya Coding And Marking Systems Market Revenue Share, By Companies, 2025 |
10.2 Kenya Coding And Marking Systems Market Competitive Benchmarking, By Operating and Technical Parameters |
11 Company Profiles |
12 Recommendations |
13 Disclaimer |
Global Go To Market Strategy - 2030
Export potential enables firms to identify high-growth global markets with greater confidence by combining advanced trade intelligence with a structured quantitative methodology. The framework analyzes emerging demand trends and country-level import patterns while integrating macroeconomic and trade datasets such as GDP and population forecasts, bilateral import–export flows, tariff structures, elasticity differentials between developed and developing economies, geographic distance, and import demand projections. Using weighted trade values from 2020–2024 as the base period to project country-to-country export potential for 2030, these inputs are operationalized through calculated drivers such as gravity model parameters, tariff impact factors, and projected GDP per-capita growth. Through an analysis of hidden potentials, demand hotspots, and market conditions that are most favorable to success, this method enables firms to focus on target countries, maximize returns, and global expansion with data, backed by accuracy.
By factoring in the projected importer demand gap that is currently unmet and could be potential opportunity, it identifies the potential for the Exporter (Country) among 190 countries, against the general trade analysis, which identifies the biggest importer or exporter.
To discover high-growth global markets and optimize your business strategy:
Click Here
Pricing
- Single User License$ 1,995
- Department License$ 2,400
- Site License$ 3,120
- Global License$ 3,795

Leadership Perspectives from Industry Events
Search
Thought Leadership and Analyst Meet


Our Clients
6WResearch In News
- India Air Conditioner Market Set for Strong Rebound in 2026 After Weather-Led Correction and GST-Driven Recovery: 6Wresearch
- ADAS in India: How Automatic Emergency Braking, Blind Spot Detection & Driver Monitoring are Transforming Road Safety
- Doha a strategic location for EV manufacturing hub: IPA Qatar
- Demand for luxury TVs surging in the GCC, says Samsung
- Empowering Growth: The Thriving Journey of Bangladesh’s Cable Industry
- Demand for luxury TVs surging in the GCC, says Samsung
Latest Reports
- Nicaragua RPG Gaming Market (2026-2032)
- New Zealand RPG Gaming Market (2026-2032)
- Netherlands RPG Gaming Market (2026-2032)
- Nauru RPG Gaming Market (2026-2032)
- Namibia RPG Gaming Market (2026-2032)
- Mozambique RPG Gaming Market (2026-2032)
- Montenegro RPG Gaming Market (2026-2032)
- Mongolia RPG Gaming Market (2026-2032)
- Monaco RPG Gaming Market (2026-2032)
- Micronesia RPG Gaming Market (2026-2032)
Industry Events and Analyst Meet

EV India Expo 2026

HIMTEX 2026

India Refining Summit 2026

India EV Show 2026

EV tech India Expo 2026
Whitepaper
- Middle East & Africa Commercial Security Market Click here to view more.
- Middle East & Africa Fire Safety Systems & Equipment Market Click here to view more.
- GCC Drone Market Click here to view more.
- Middle East Lighting Fixture Market Click here to view more.
- GCC Physical & Perimeter Security Market Click here to view more.