Lithuania Storefront Glass Market (2026-2032) | Size & Revenue, Share, Analysis, Value, Companies, Forecast, Industry, Competitive Landscape, Outlook, Trends, Segmentation, Growth
Market Forecast By Frame (All Glass, Aluminium, Steel, Bronze, Others), By Type (Clear Glass, Safety/Laminated Glass, Insulated Glass, Tempered Glass, Others), By Glazed System (Center, Offset), By Thickness Range (0.1-0.5 Inches, 0.6-1 Inches), By Fabrication (Screw Spline, Shear Block), By Application (Windows, Doors), By End User (Commercial, Institutions, Residential, Others) And Competitive Landscape
| Product Code: ETC8052190 | Publication Date: Sep 2024 | Updated Date: Apr 2026 | Product Type: Market Research Report | |
| Publisher: 6Wresearch | Author: Summon Dutta | No. of Pages: 75 | No. of Figures: 35 | No. of Tables: 20 |
Lithuania Storefront Glass Market Size (2020-2030)
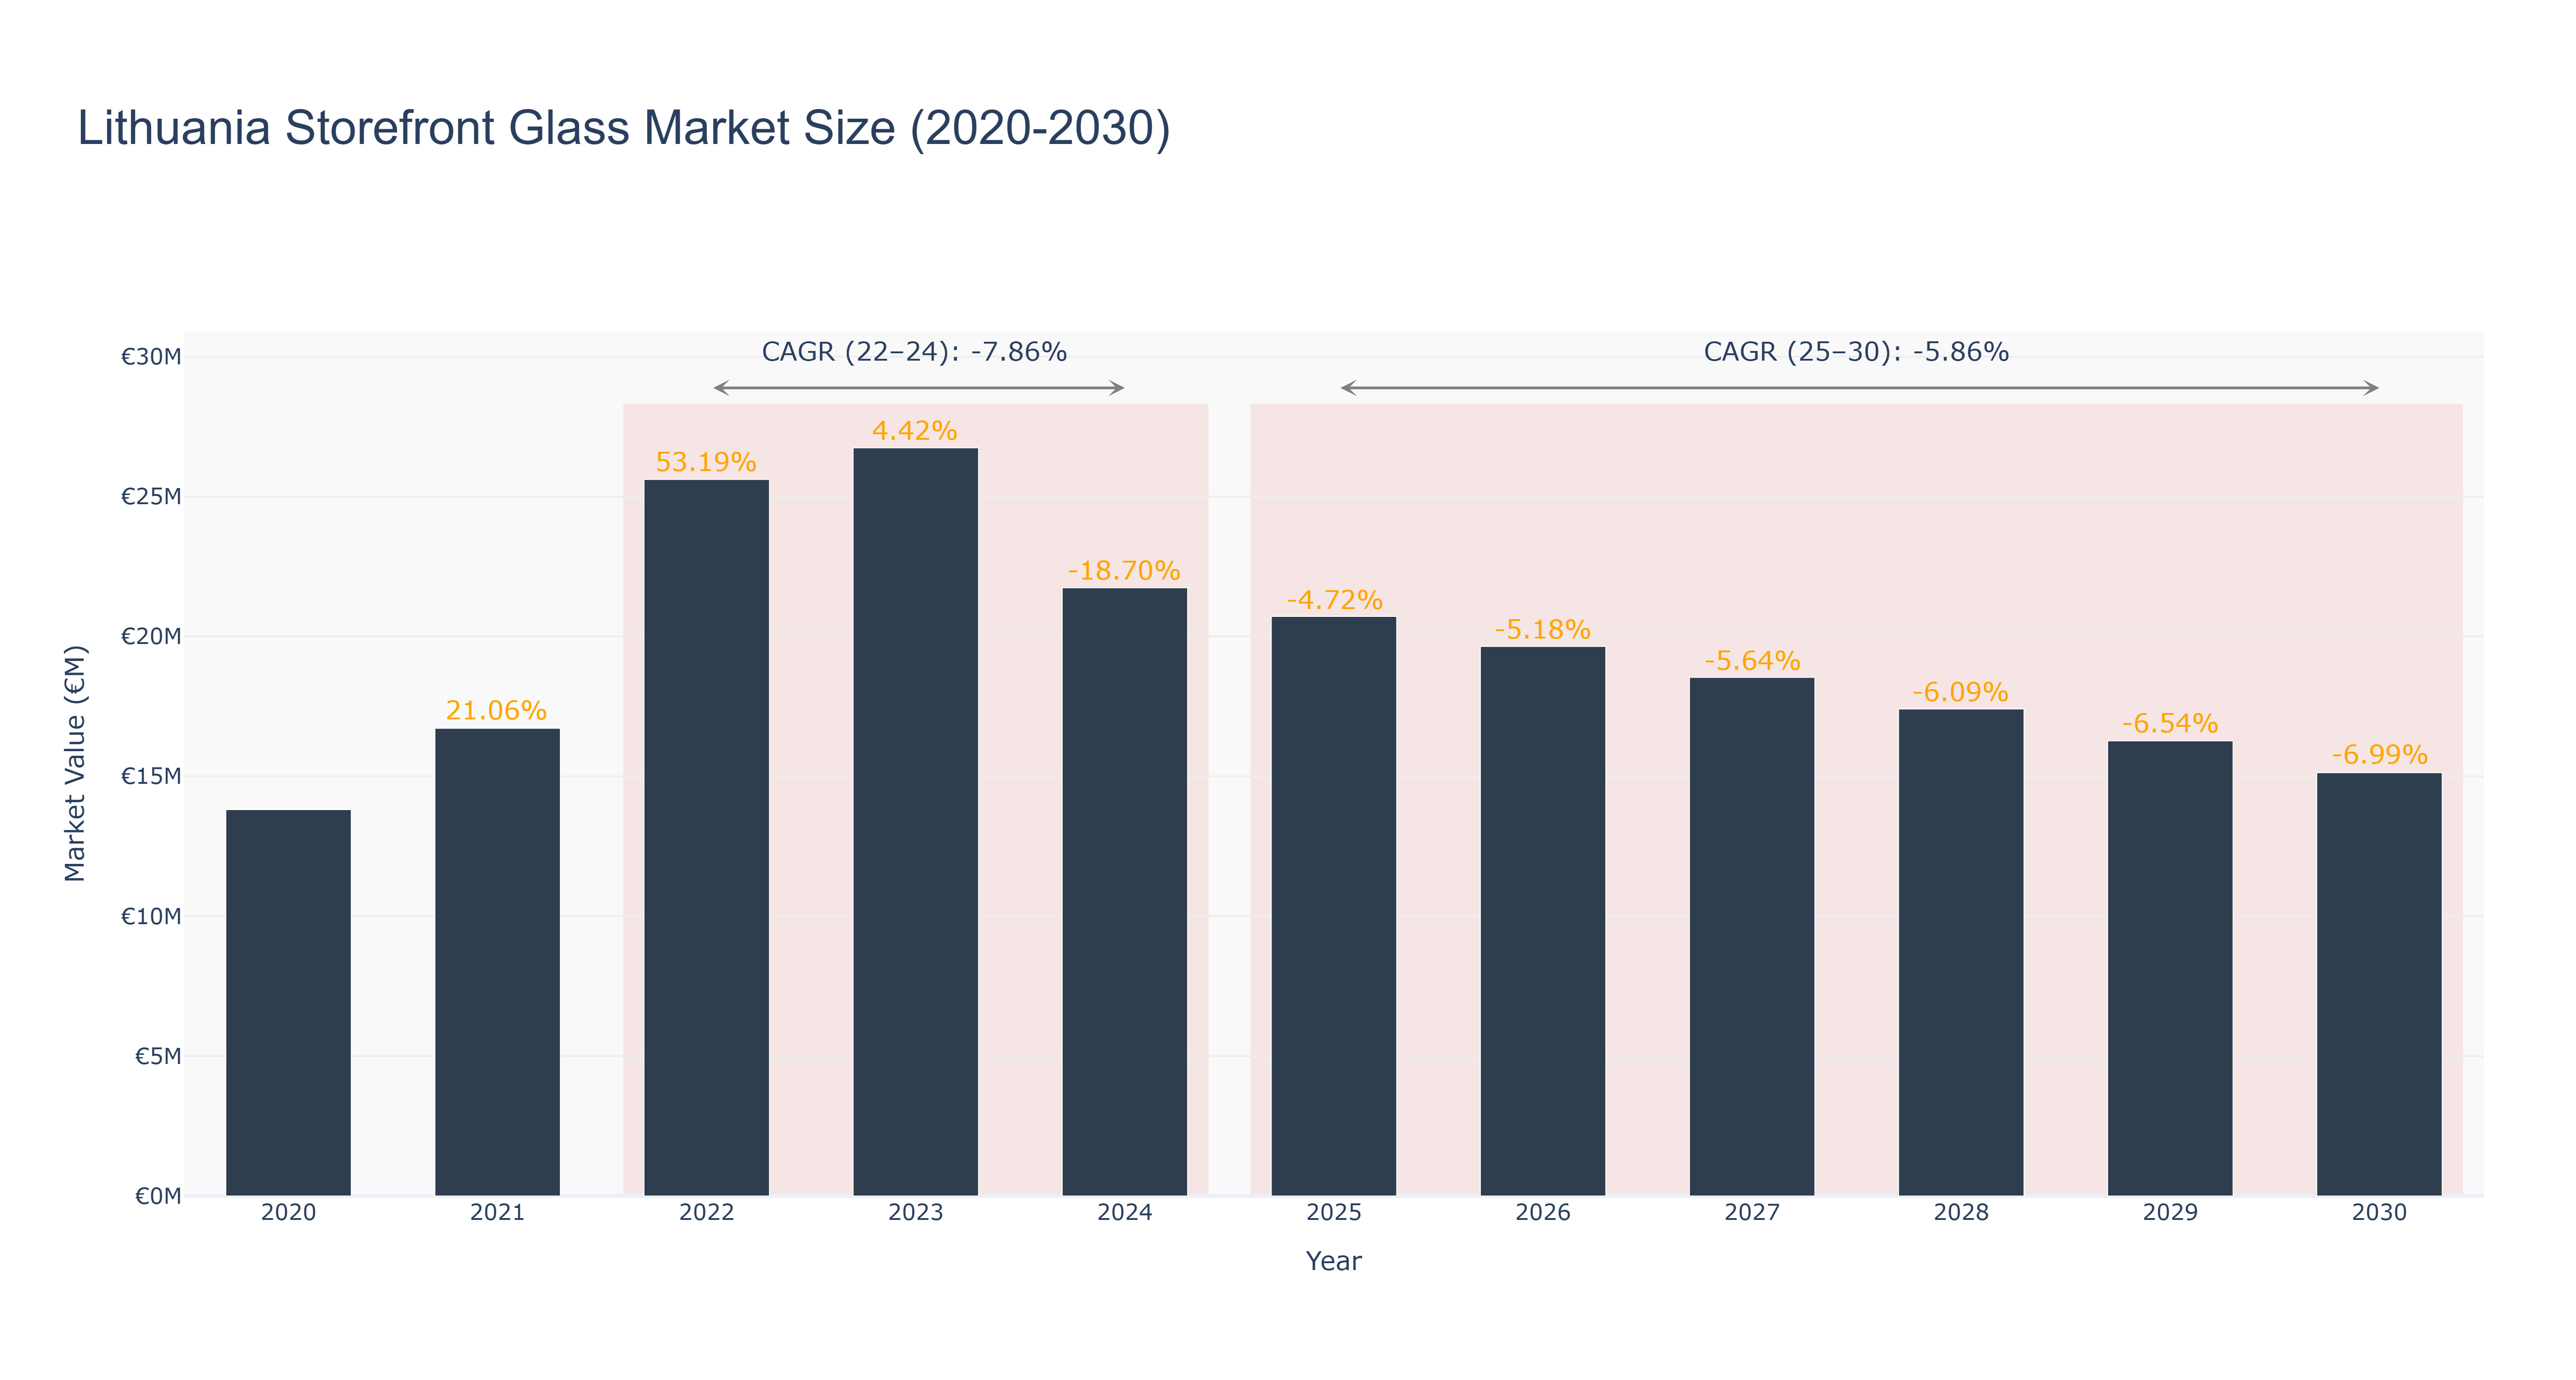
The Lithuania Storefront Glass Market experienced a peak market size of €26.74 million in 2023, followed by a decline to €20.72 million in 2025. The market is forecasted to continue shrinking to €15.13 million by 2030, with a CAGR of -5.86% from 2025 to 2030. The market has been facing challenges due to economic downturns and shifts in consumer preferences towards alternative materials. Despite the current decline, the industry drivers such as increased focus on energy efficiency and sustainability may provide opportunities for growth in the future. Recent developments indicate a shift towards more innovative glass technologies and collaborations with architects for eco-friendly building projects, which could potentially revitalize the market in the coming years.
Lithuania Storefront Glass Market: Production & Trade Performance (2019-2025)
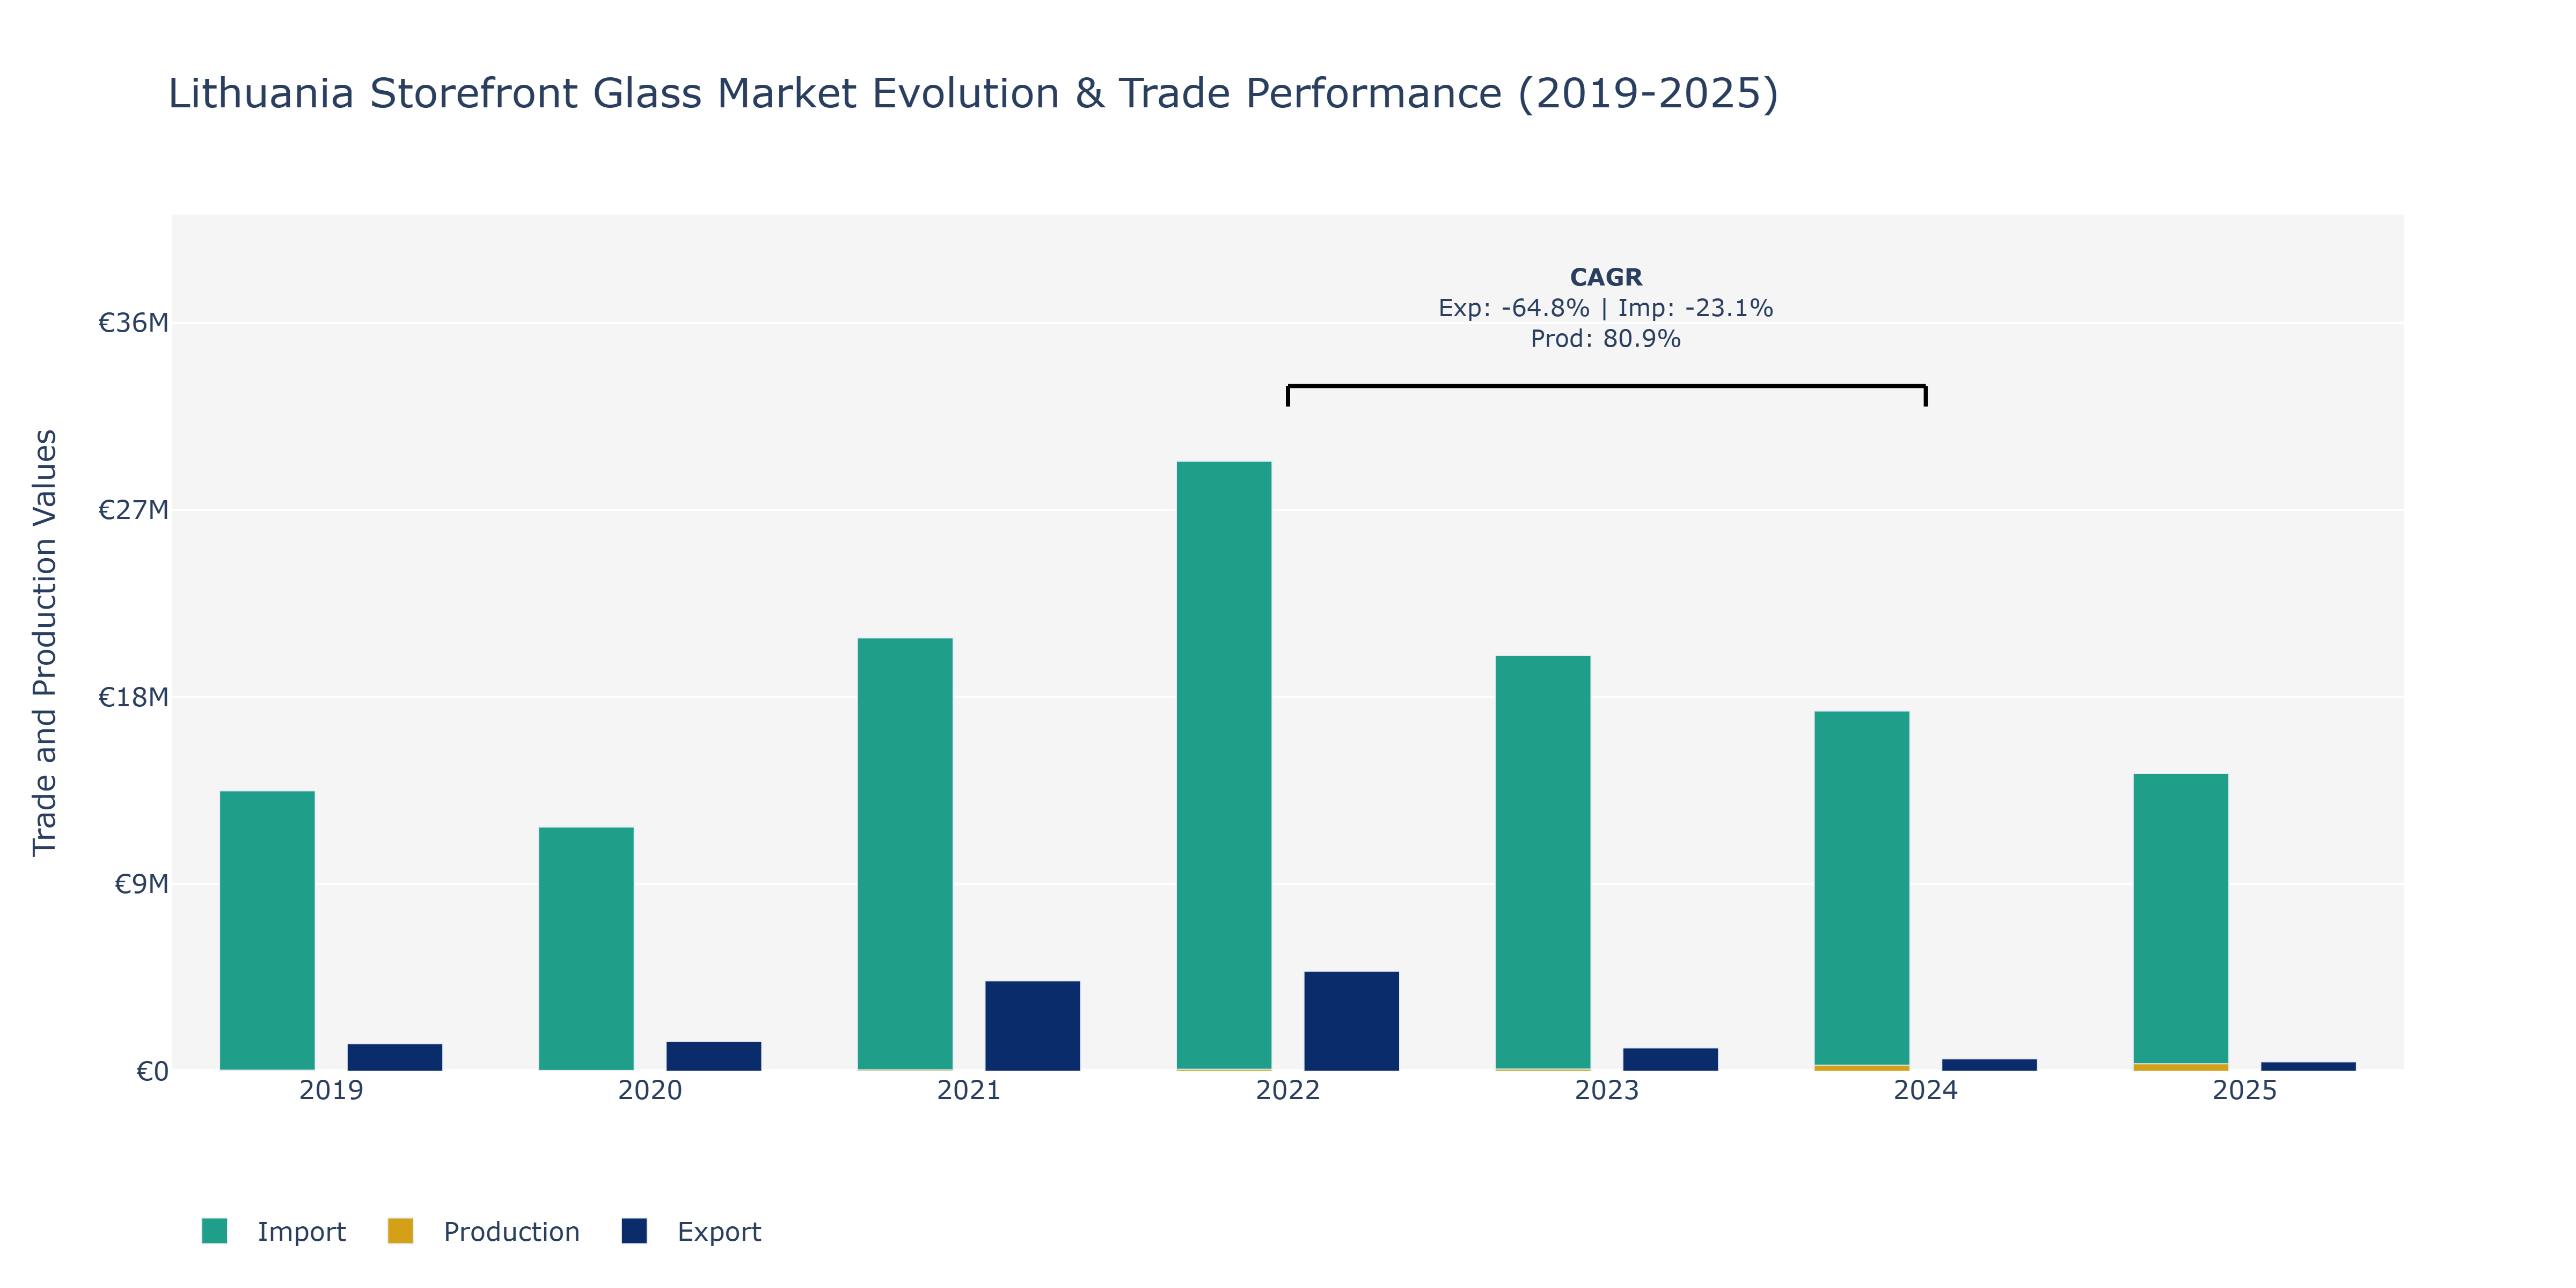
In the Lithuania Storefront Glass Market, exports witnessed a fluctuating pattern over the years, starting at €1.33 million in 2019, increasing to €1.43 million in 2020, experiencing a notable surge to €4.35 million in 2021, peaking at €4.81 million in 2022, and then declining sharply to €1.12 million in 2023, followed by a further decrease to €596.91 thousand in 2024, and €448.73 thousand in 2025. Imports, on the other hand, displayed a different trajectory, starting at €13.49 million in 2019, declining to €11.75 million in 2020, rising to €20.85 million in 2021, further increasing to €29.34 million in 2022, and then decreasing to €20.01 million in 2023, €17.33 million in 2024, and €14.33 million in 2025. Production value indicated a consistent growth trend from €54 million in 2019 to €288 million in 2024, reaching €355 million in 2025. These fluctuations can be attributed to various factors such as changes in global demand for storefront glass, shifts in pricing strategies, advancements in technology impacting production efficiency, and international trade policies affecting imports and exports. An 80.91% CAGR in production from 2022 to 2024 also reflects the industry's efforts to enhance manufacturing capabilities and meet evolving market requirements.
Key Highlights of the Report:
- Lithuania Storefront Glass Market Outlook
- Market Size of Lithuania Storefront Glass Market, 2025
- Forecast of Lithuania Storefront Glass Market, 2032
- Historical Data and Forecast of Lithuania Storefront Glass Revenues & Volume for the Period 2022 - 2032
- Lithuania Storefront Glass Market Trend Evolution
- Lithuania Storefront Glass Market Drivers and Challenges
- Lithuania Storefront Glass Price Trends
- Lithuania Storefront Glass Porter's Five Forces
- Lithuania Storefront Glass Industry Life Cycle
- Historical Data and Forecast of Lithuania Storefront Glass Market Revenues & Volume By Frame for the Period 2022 - 2032
- Historical Data and Forecast of Lithuania Storefront Glass Market Revenues & Volume By All Glass for the Period 2022 - 2032
- Historical Data and Forecast of Lithuania Storefront Glass Market Revenues & Volume By Aluminium for the Period 2022 - 2032
- Historical Data and Forecast of Lithuania Storefront Glass Market Revenues & Volume By Steel for the Period 2022 - 2032
- Historical Data and Forecast of Lithuania Storefront Glass Market Revenues & Volume By Bronze for the Period 2022 - 2032
- Historical Data and Forecast of Lithuania Storefront Glass Market Revenues & Volume By Others for the Period 2022 - 2032
- Historical Data and Forecast of Lithuania Storefront Glass Market Revenues & Volume By Type for the Period 2022 - 2032
- Historical Data and Forecast of Lithuania Storefront Glass Market Revenues & Volume By Clear Glass for the Period 2022 - 2032
- Historical Data and Forecast of Lithuania Storefront Glass Market Revenues & Volume By Safety/Laminated Glass for the Period 2022 - 2032
- Historical Data and Forecast of Lithuania Storefront Glass Market Revenues & Volume By Insulated Glass for the Period 2022 - 2032
- Historical Data and Forecast of Lithuania Storefront Glass Market Revenues & Volume By Tempered Glass for the Period 2022 - 2032
- Historical Data and Forecast of Lithuania Storefront Glass Market Revenues & Volume By Others for the Period 2022 - 2032
- Historical Data and Forecast of Lithuania Storefront Glass Market Revenues & Volume By Glazed System for the Period 2022 - 2032
- Historical Data and Forecast of Lithuania Storefront Glass Market Revenues & Volume By Center for the Period 2022 - 2032
- Historical Data and Forecast of Lithuania Storefront Glass Market Revenues & Volume By Offset for the Period 2022 - 2032
- Historical Data and Forecast of Lithuania Storefront Glass Market Revenues & Volume By Thickness Range for the Period 2022 - 2032
- Historical Data and Forecast of Lithuania Storefront Glass Market Revenues & Volume By 0.1-0.5 Inches for the Period 2022 - 2032
- Historical Data and Forecast of Lithuania Storefront Glass Market Revenues & Volume By 0.6-1 Inches for the Period 2022 - 2032
- Historical Data and Forecast of Lithuania Storefront Glass Market Revenues & Volume By Fabrication for the Period 2022 - 2032
- Historical Data and Forecast of Lithuania Storefront Glass Market Revenues & Volume By Screw Spline for the Period 2022 - 2032
- Historical Data and Forecast of Lithuania Storefront Glass Market Revenues & Volume By Shear Block for the Period 2022 - 2032
- Historical Data and Forecast of Lithuania Storefront Glass Market Revenues & Volume By Application for the Period 2022 - 2032
- Historical Data and Forecast of Lithuania Storefront Glass Market Revenues & Volume By Windows for the Period 2022 - 2032
- Historical Data and Forecast of Lithuania Storefront Glass Market Revenues & Volume By Doors for the Period 2022 - 2032
- Historical Data and Forecast of Lithuania Storefront Glass Market Revenues & Volume By End User for the Period 2022 - 2032
- Historical Data and Forecast of Lithuania Storefront Glass Market Revenues & Volume By Commercial for the Period 2022 - 2032
- Historical Data and Forecast of Lithuania Storefront Glass Market Revenues & Volume By Institutions for the Period 2022 - 2032
- Historical Data and Forecast of Lithuania Storefront Glass Market Revenues & Volume By Residential for the Period 2022 - 2032
- Historical Data and Forecast of Lithuania Storefront Glass Market Revenues & Volume By Others for the Period 2022 - 2032
- Lithuania Storefront Glass Import Export Trade Statistics
- Market Opportunity Assessment By Frame
- Market Opportunity Assessment By Type
- Market Opportunity Assessment By Glazed System
- Market Opportunity Assessment By Thickness Range
- Market Opportunity Assessment By Fabrication
- Market Opportunity Assessment By Application
- Market Opportunity Assessment By End User
- Lithuania Storefront Glass Top Companies Market Share
- Lithuania Storefront Glass Competitive Benchmarking By Technical and Operational Parameters
- Lithuania Storefront Glass Company Profiles
- Lithuania Storefront Glass Key Strategic Recommendations
Frequently Asked Questions About the Market Study (FAQs):
6Wresearch actively monitors the Lithuania Storefront Glass Market and publishes its comprehensive annual report, highlighting emerging trends, growth drivers, revenue analysis, and forecast outlook. Our insights help businesses to make data-backed strategic decisions with ongoing market dynamics. Our analysts track relevent industries related to the Lithuania Storefront Glass Market, allowing our clients with actionable intelligence and reliable forecasts tailored to emerging regional needs.
Yes, we provide customisation as per your requirements. To learn more, feel free to contact us on sales@6wresearch.com
1 Executive Summary |
2 Introduction |
2.1 Key Highlights of the Report |
2.2 Report Description |
2.3 Market Scope & Segmentation |
2.4 Research Methodology |
2.5 Assumptions |
3 Lithuania Storefront Glass Market Overview |
3.1 Lithuania Country Macro Economic Indicators |
3.2 Lithuania Storefront Glass Market Revenues & Volume, 2022 & 2032F |
3.3 Lithuania Storefront Glass Market - Industry Life Cycle |
3.4 Lithuania Storefront Glass Market - Porter's Five Forces |
3.5 Lithuania Storefront Glass Market Revenues & Volume Share, By Frame, 2022 & 2032F |
3.6 Lithuania Storefront Glass Market Revenues & Volume Share, By Type, 2022 & 2032F |
3.7 Lithuania Storefront Glass Market Revenues & Volume Share, By Glazed System, 2022 & 2032F |
3.8 Lithuania Storefront Glass Market Revenues & Volume Share, By Thickness Range, 2022 & 2032F |
3.9 Lithuania Storefront Glass Market Revenues & Volume Share, By Fabrication, 2022 & 2032F |
3.10 Lithuania Storefront Glass Market Revenues & Volume Share, By Application, 2022 & 2032F |
3.11 Lithuania Storefront Glass Market Revenues & Volume Share, By End User, 2022 & 2032F |
4 Lithuania Storefront Glass Market Dynamics |
4.1 Impact Analysis |
4.2 Market Drivers |
4.3 Market Restraints |
5 Lithuania Storefront Glass Market Trends |
6 Lithuania Storefront Glass Market, By Types |
6.1 Lithuania Storefront Glass Market, By Frame |
6.1.1 Overview and Analysis |
6.1.2 Lithuania Storefront Glass Market Revenues & Volume, By Frame, 2022 - 2032F |
6.1.3 Lithuania Storefront Glass Market Revenues & Volume, By All Glass, 2022 - 2032F |
6.1.4 Lithuania Storefront Glass Market Revenues & Volume, By Aluminium, 2022 - 2032F |
6.1.5 Lithuania Storefront Glass Market Revenues & Volume, By Steel, 2022 - 2032F |
6.1.6 Lithuania Storefront Glass Market Revenues & Volume, By Bronze, 2022 - 2032F |
6.1.7 Lithuania Storefront Glass Market Revenues & Volume, By Others, 2022 - 2032F |
6.2 Lithuania Storefront Glass Market, By Type |
6.2.1 Overview and Analysis |
6.2.2 Lithuania Storefront Glass Market Revenues & Volume, By Clear Glass, 2022 - 2032F |
6.2.3 Lithuania Storefront Glass Market Revenues & Volume, By Safety/Laminated Glass, 2022 - 2032F |
6.2.4 Lithuania Storefront Glass Market Revenues & Volume, By Insulated Glass, 2022 - 2032F |
6.2.5 Lithuania Storefront Glass Market Revenues & Volume, By Tempered Glass, 2022 - 2032F |
6.2.6 Lithuania Storefront Glass Market Revenues & Volume, By Others, 2022 - 2032F |
6.3 Lithuania Storefront Glass Market, By Glazed System |
6.3.1 Overview and Analysis |
6.3.2 Lithuania Storefront Glass Market Revenues & Volume, By Center, 2022 - 2032F |
6.3.3 Lithuania Storefront Glass Market Revenues & Volume, By Offset, 2022 - 2032F |
6.4 Lithuania Storefront Glass Market, By Thickness Range |
6.4.1 Overview and Analysis |
6.4.2 Lithuania Storefront Glass Market Revenues & Volume, By 0.1-0.5 Inches, 2022 - 2032F |
6.4.3 Lithuania Storefront Glass Market Revenues & Volume, By 0.6-1 Inches, 2022 - 2032F |
6.5 Lithuania Storefront Glass Market, By Fabrication |
6.5.1 Overview and Analysis |
6.5.2 Lithuania Storefront Glass Market Revenues & Volume, By Screw Spline, 2022 - 2032F |
6.5.3 Lithuania Storefront Glass Market Revenues & Volume, By Shear Block, 2022 - 2032F |
6.6 Lithuania Storefront Glass Market, By Application |
6.6.1 Overview and Analysis |
6.6.2 Lithuania Storefront Glass Market Revenues & Volume, By Windows, 2022 - 2032F |
6.6.3 Lithuania Storefront Glass Market Revenues & Volume, By Doors, 2022 - 2032F |
6.7 Lithuania Storefront Glass Market, By End User |
6.7.1 Overview and Analysis |
6.7.2 Lithuania Storefront Glass Market Revenues & Volume, By Commercial, 2022 - 2032F |
6.7.3 Lithuania Storefront Glass Market Revenues & Volume, By Institutions, 2022 - 2032F |
6.7.4 Lithuania Storefront Glass Market Revenues & Volume, By Others, 2022 - 2032F |
6.7.5 Lithuania Storefront Glass Market Revenues & Volume, By Others, 2022 - 2032F |
7 Lithuania Storefront Glass Market Import-Export Trade Statistics |
7.1 Lithuania Storefront Glass Market Export to Major Countries |
7.2 Lithuania Storefront Glass Market Imports from Major Countries |
8 Lithuania Storefront Glass Market Key Performance Indicators |
9 Lithuania Storefront Glass Market - Opportunity Assessment |
9.1 Lithuania Storefront Glass Market Opportunity Assessment, By Frame, 2022 & 2032F |
9.2 Lithuania Storefront Glass Market Opportunity Assessment, By Type, 2022 & 2032F |
9.3 Lithuania Storefront Glass Market Opportunity Assessment, By Glazed System, 2022 & 2032F |
9.4 Lithuania Storefront Glass Market Opportunity Assessment, By Thickness Range, 2022 & 2032F |
9.5 Lithuania Storefront Glass Market Opportunity Assessment, By Fabrication, 2022 & 2032F |
9.6 Lithuania Storefront Glass Market Opportunity Assessment, By Application, 2022 & 2032F |
9.7 Lithuania Storefront Glass Market Opportunity Assessment, By End User, 2022 & 2032F |
10 Lithuania Storefront Glass Market - Competitive Landscape |
10.1 Lithuania Storefront Glass Market Revenue Share, By Companies, 2025 |
10.2 Lithuania Storefront Glass Market Competitive Benchmarking, By Operating and Technical Parameters |
11 Company Profiles |
12 Recommendations |
13 Disclaimer |
Global Go To Market Strategy - 2030
Export potential enables firms to identify high-growth global markets with greater confidence by combining advanced trade intelligence with a structured quantitative methodology. The framework analyzes emerging demand trends and country-level import patterns while integrating macroeconomic and trade datasets such as GDP and population forecasts, bilateral import–export flows, tariff structures, elasticity differentials between developed and developing economies, geographic distance, and import demand projections. Using weighted trade values from 2020–2024 as the base period to project country-to-country export potential for 2030, these inputs are operationalized through calculated drivers such as gravity model parameters, tariff impact factors, and projected GDP per-capita growth. Through an analysis of hidden potentials, demand hotspots, and market conditions that are most favorable to success, this method enables firms to focus on target countries, maximize returns, and global expansion with data, backed by accuracy.
By factoring in the projected importer demand gap that is currently unmet and could be potential opportunity, it identifies the potential for the Exporter (Country) among 190 countries, against the general trade analysis, which identifies the biggest importer or exporter.
To discover high-growth global markets and optimize your business strategy:
Click Here
Pricing
- Single User License$ 1,995
- Department License$ 2,400
- Site License$ 3,120
- Global License$ 3,795

Leadership Perspectives from Industry Events
Search
Thought Leadership and Analyst Meet


Our Clients
6WResearch In News
- India Air Conditioner Market Set for Strong Rebound in 2026 After Weather-Led Correction and GST-Driven Recovery: 6Wresearch
- ADAS in India: How Automatic Emergency Braking, Blind Spot Detection & Driver Monitoring are Transforming Road Safety
- Doha a strategic location for EV manufacturing hub: IPA Qatar
- Demand for luxury TVs surging in the GCC, says Samsung
- Empowering Growth: The Thriving Journey of Bangladesh’s Cable Industry
- Demand for luxury TVs surging in the GCC, says Samsung
Latest Reports
- Nicaragua RPG Gaming Market (2026-2032)
- New Zealand RPG Gaming Market (2026-2032)
- Netherlands RPG Gaming Market (2026-2032)
- Nauru RPG Gaming Market (2026-2032)
- Namibia RPG Gaming Market (2026-2032)
- Mozambique RPG Gaming Market (2026-2032)
- Montenegro RPG Gaming Market (2026-2032)
- Mongolia RPG Gaming Market (2026-2032)
- Monaco RPG Gaming Market (2026-2032)
- Micronesia RPG Gaming Market (2026-2032)
Industry Events and Analyst Meet

EV India Expo 2026

HIMTEX 2026

India Refining Summit 2026

India EV Show 2026

EV tech India Expo 2026
Whitepaper
- Middle East & Africa Commercial Security Market Click here to view more.
- Middle East & Africa Fire Safety Systems & Equipment Market Click here to view more.
- GCC Drone Market Click here to view more.
- Middle East Lighting Fixture Market Click here to view more.
- GCC Physical & Perimeter Security Market Click here to view more.