Philippines Interactive Tables Market (2026-2032) Outlook | Analysis, Size, Share, Forecast, Companies, Industry, Value, Trends, Revenue & Growth
Market Forecast By Technology (LCD, LED, Capacitive, Others), By Screen Size (32-65 Inch, 65 Inch & Above), By Application (Exhibition & Trade Shows, Education, Retail, Control Room, Hospitality, Transportation, Others) And Competitive Landscape
| Product Code: ETC275069 | Publication Date: Aug 2022 | Updated Date: Jul 2026 | Product Type: Market Research Report | |
| Publisher: 6Wresearch | Author: Ravi Bhandari | No. of Pages: 75 | No. of Figures: 35 | No. of Tables: 20 |
Philippines Interactive Tables Market Size, Share & Growth Rate
The Philippines Interactive Tables Market was estimated at USD 313 Million in 2025 and is projected to reach USD 433 Million by 2032, growing at a CAGR of 4.7% from 2026 to 2032. This growth trajectory is being propelled by increasing demand from the education sector, where interactive tables are transforming traditional learning environments into engaging, collaborative spaces. Additionally, rising consumer interest in interactive dining experiences and the expanding adoption of digital solutions in various industries further underpin this market's expansion.
Philippines Interactive Tables Market Year-wise Growth Rate and Key Drivers
This graph highlights how the Philippines Interactive Tables Market has steadily grown over the years, supported by major growth factors.
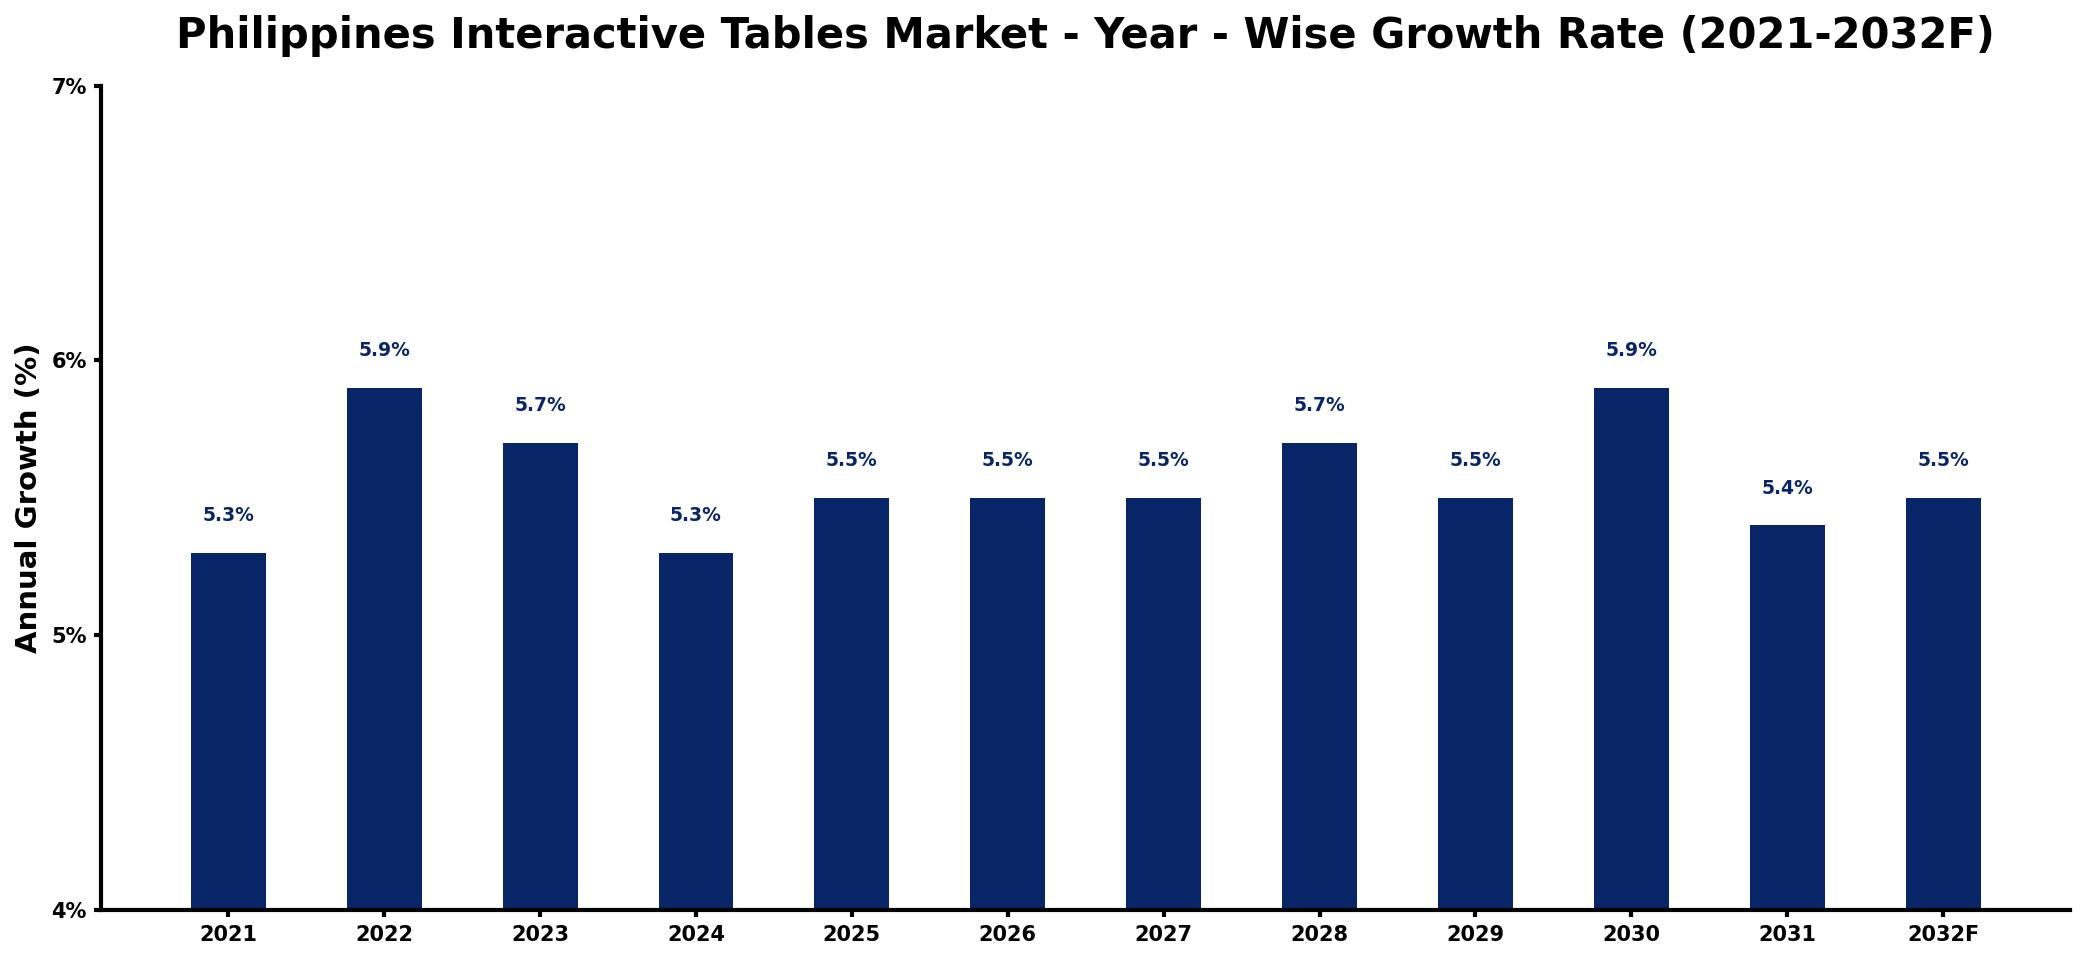
The table below presents the year‑wise growth rates along with the key drivers influencing the market
| Year | Growth Rate | Major Drivers |
| 2021 | 5.3% | increased demand for digital solutions |
| 2022 | 5.9% | growth in hospitality sector investments |
| 2023 | 5.7% | rise in educational technology adoption |
| 2024 | 5.3% | expansion of retail customer engagement |
| 2025 | 5.5% | enhanced user experience expectations |
| 2026 | 5.5% | emergence of smart city initiatives |
| 2027 | 5.5% | boost in corporate training programs |
| 2028 | 5.7% | rising end-use demand growth |
| 2029 | 5.5% | advancements in digital marketing strategies |
| 2030 | 5.9% | increased focus on customer interaction |
| 2031 | 5.4% | development of immersive entertainment experiences |
| 2032 | 5.5% | surge in event management technology |
Note: Market size estimations and growth projections presented in this report are based on 6Wresearch's proprietary forecasting methodology, utilizing the latest available industry data, government publications, and primary research inputs.
Philippines Interactive Tables Market Synopsis
The primary catalyst influencing the Philippines Interactive Tables Market is the surge in technological adoption across educational institutions. Schools and universities are investing in innovative teaching tools that foster interactive learning, making interactive tables highly sought after. This trend is further supported by a growing tech-savvy population eager to embrace digital solutions.
In tandem with educational advancements, the hospitality and restaurant sectors are also evolving, leveraging interactive tables to enhance customer engagement and streamline service delivery. As dining experiences become increasingly tech-driven, the demand for interactive tables is expected to rise, positioning this market for substantial growth over the coming years.
Philippines Interactive Tables Market Key Takeaways
- The market is driven by increasing investments in educational technology and digital learning solutions.
- Interactive tables are gaining traction in the hospitality sector, reshaping customer interactions and service efficiency.
- A shift towards experiential learning environments is propelling demand for interactive tables in schools and universities.
- The integration of advanced technologies such as touch screens and interactive software is enhancing product offerings.
- The market is supported by a growing consumer base that values digital solutions for both education and entertainment.
Evaluation of Restraints in Philippines Interactive Tables Market
While the Philippines Interactive Tables Market presents various growth avenues, it is not without its challenges. The initial investment costs associated with implementing interactive technologies can be a significant barrier for smaller educational institutions and businesses. Moreover, the rapid pace of technological advancement necessitates continuous upgrades, which can strain budgets. Concerns about the effectiveness of these tools in diverse learning environments also contribute to a cautious approach among potential adopters, impacting overall market uptake.
Philippines Interactive Tables Market Trends
Current trends in the Philippines Interactive Tables Market indicate a growing preference for hybrid learning solutions that combine physical and digital interactions. This convergence is compelling educational institutions to invest in multi-functional interactive tables that accommodate both traditional teaching methods and modern, interactive learning. Additionally, the rise of mobile technology is influencing the design and functionality of interactive tables, leading to the integration of apps and software that enhance user experience.
Philippines Interactive Tables Market Opportunities
Opportunities for growth within the Philippines Interactive Tables Market are plentiful. The increasing emphasis on STEM (Science, Technology, Engineering, and Mathematics) education is driving schools to adopt interactive learning tools that promote collaboration and critical thinking. Furthermore, the corporate sector is beginning to explore the benefits of interactive tables for meetings and presentations, indicating potential avenues for market expansion. As digital transformation continues to reshape various sectors, proactive investment in interactive technologies will likely yield high returns.
Government Initiatives in the Philippines Interactive Tables Market
The Philippine government has launched several initiatives aimed at enhancing educational infrastructure through technology. Funding programs aimed at modernizing classrooms and supporting digital learning are creating a favorable environment for the adoption of interactive tables. Public-private partnerships are also on the rise, further encouraging educational institutions to integrate advanced technologies into their curriculums. These initiatives are expected to bolster market growth, fostering a robust ecosystem for interactive learning solutions.
Future Insights of the Philippines Interactive Tables Market
Looking ahead to 2026-2032, the Philippines Interactive Tables Market is poised for significant advancements. As educational institutions increasingly recognize the value of interactive learning, the demand for these technologies is likely to rise. The continuous evolution of software and user interface designs will further enhance the functionality of interactive tables, making them more appealing to a broader audience. Moreover, as more businesses adopt digital solutions, the integration of interactive tables in corporate environments will likely expand, promoting an era of digital interactivity that transcends traditional boundaries.
Philippines Interactive Tables Market Latest Developments (2025 - 2026)
Recent developments in the Philippines Interactive Tables Market highlight an increasing focus on user-centered design. Manufacturers are enhancing product features to meet the evolving needs of educational institutions and businesses, emphasizing customization and adaptability. Moreover, emerging collaborations between technology firms and educational entities are fostering innovation, leading to new applications and functionalities for interactive tables. This trend signifies an industry leaning towards more integrated and holistic approaches to interactive learning and engagement.
Philippines Interactive Tables Market - Key Attractiveness of the Report
- 10 Years of Market Numbers
- Historical Data Starting from 2022 to 2025
- Base Year: 2025
- Forecast Data until 2032
- Key Performance Indicators Impacting the Market
- Major Upcoming Developments and Projects
Key Highlights of the Report:
- Philippines Interactive Tables Market Outlook
- Market Size of Philippines Interactive Tables Market, 2025
- Forecast of Philippines Interactive Tables Market, 2032
- Historical Data and Forecast of Philippines Interactive Tables Revenues & Volume for the Period 2022-2032F
- Philippines Interactive Tables Market Trend Evolution
- Philippines Interactive Tables Market Drivers and Challenges
- Philippines Interactive Tables Price Trends
- Philippines Interactive Tables Porter's Five Forces
- Philippines Interactive Tables Industry Life Cycle
- Historical Data and Forecast of Philippines Interactive Tables Market Revenues & Volume By Technology for the Period 2022-2032F
- Historical Data and Forecast of Philippines Interactive Tables Market Revenues & Volume By LCD for the Period 2022-2032F
- Historical Data and Forecast of Philippines Interactive Tables Market Revenues & Volume By LED for the Period 2022-2032F
- Historical Data and Forecast of Philippines Interactive Tables Market Revenues & Volume By Capacitive for the Period 2022-2032F
- Historical Data and Forecast of Philippines Interactive Tables Market Revenues & Volume By Others for the Period 2022-2032F
- Historical Data and Forecast of Philippines Interactive Tables Market Revenues & Volume By Screen Size for the Period 2022-2032F
- Historical Data and Forecast of Philippines Interactive Tables Market Revenues & Volume By 32-65 Inch for the Period 2022-2032F
- Historical Data and Forecast of Philippines Interactive Tables Market Revenues & Volume By 65 Inch & Above for the Period 2022-2032F
- Historical Data and Forecast of Philippines Interactive Tables Market Revenues & Volume By Application for the Period 2022-2032F
- Historical Data and Forecast of Philippines Interactive Tables Market Revenues & Volume By Exhibition & Trade Shows for the Period 2022-2032F
- Historical Data and Forecast of Philippines Interactive Tables Market Revenues & Volume By Education for the Period 2022-2032F
- Historical Data and Forecast of Philippines Interactive Tables Market Revenues & Volume By Retail for the Period 2022-2032F
- Historical Data and Forecast of Philippines Interactive Tables Market Revenues & Volume By Control Room for the Period 2022-2032F
- Historical Data and Forecast of Philippines Interactive Tables Market Revenues & Volume By Hospitality for the Period 2022-2032F
- Historical Data and Forecast of Philippines Interactive Tables Market Revenues & Volume By Transportation for the Period 2022-2032F
- Historical Data and Forecast of Philippines Interactive Tables Market Revenues & Volume By Others for the Period 2022-2032F
- Philippines Interactive Tables Import Export Trade Statistics
- Market Opportunity Assessment By Technology
- Market Opportunity Assessment By Screen Size
- Market Opportunity Assessment By Application
- Philippines Interactive Tables Top Companies Market Share
- Philippines Interactive Tables Competitive Benchmarking By Technical and Operational Parameters
- Philippines Interactive Tables Company Profiles
- Philippines Interactive Tables Key Strategic Recommendations
Frequently Asked Questions About the Market Study (FAQs):
The Philippines Interactive Tables Market is estimated at USD 313 Million in 2025 and is projected to reach USD 433 Million by 2032, growing at a CAGR of 4.7% from 2026 to 2032.
In the education sector, interactive tables are enhancing collaborative learning by allowing students to engage directly with digital content, fostering teamwork, and facilitating interactive lessons.
Key trends include the shift towards hybrid learning models, growing interest in experiential education, and advancements in digital technology that enhance user engagement.
Yes, various industries, particularly hospitality and corporate environments, are increasingly investing in interactive tables to improve customer experiences and streamline operations.
Government initiatives focus on enhancing educational technology through funding programs and public-private partnerships aimed at modernizing classrooms and integrating advanced learning tools.
6Wresearch actively monitors the Philippines Interactive Tables Market and publishes its comprehensive annual report, highlighting emerging trends, growth drivers, revenue analysis, and forecast outlook. Our insights help businesses to make data-backed strategic decisions with ongoing market dynamics. Our analysts track relevent industries related to the Philippines Interactive Tables Market, allowing our clients with actionable intelligence and reliable forecasts tailored to emerging regional needs.
Yes, we provide customisation as per your requirements. To learn more, feel free to contact us on sales@6wresearch.com
1 Executive Summary |
2 Introduction |
2.1 Key Highlights of the Report |
2.2 Report Description |
2.3 Market Scope & Segmentation |
2.4 Research Methodology |
2.5 Assumptions |
3 Philippines Interactive Tables Market Overview |
3.1 Philippines Country Macro Economic Indicators |
3.2 Philippines Interactive Tables Market Revenues & Volume, 2022 & 2032F |
3.3 Philippines Interactive Tables Market - Industry Life Cycle |
3.4 Philippines Interactive Tables Market - Porter's Five Forces |
3.5 Philippines Interactive Tables Market Revenues & Volume Share, By Technology, 2022 & 2032F |
3.6 Philippines Interactive Tables Market Revenues & Volume Share, By Screen Size, 2022 & 2032F |
3.7 Philippines Interactive Tables Market Revenues & Volume Share, By Application, 2022 & 2032F |
4 Philippines Interactive Tables Market Dynamics |
4.1 Impact Analysis |
4.2 Market Drivers |
4.2.1 Increasing demand for interactive and engaging technologies in educational institutions and corporate sectors |
4.2.2 Growing trend towards digitalization and modernization of businesses and services |
4.2.3 Rising adoption of interactive tables in retail stores and entertainment venues |
4.3 Market Restraints |
4.3.1 High initial investment cost associated with interactive table technology |
4.3.2 Limited awareness and understanding of the benefits of interactive tables among potential end-users |
4.3.3 Lack of skilled professionals for the maintenance and support of interactive table systems |
5 Philippines Interactive Tables Market Trends |
6 Philippines Interactive Tables Market, By Types |
6.1 Philippines Interactive Tables Market, By Technology |
6.1.1 Overview and Analysis |
6.1.2 Philippines Interactive Tables Market Revenues & Volume, By Technology, 2022-2032F |
6.1.3 Philippines Interactive Tables Market Revenues & Volume, By LCD, 2022-2032F |
6.1.4 Philippines Interactive Tables Market Revenues & Volume, By LED, 2022-2032F |
6.1.5 Philippines Interactive Tables Market Revenues & Volume, By Capacitive, 2022-2032F |
6.1.6 Philippines Interactive Tables Market Revenues & Volume, By Others, 2022-2032F |
6.2 Philippines Interactive Tables Market, By Screen Size |
6.2.1 Overview and Analysis |
6.2.2 Philippines Interactive Tables Market Revenues & Volume, By 32-65 Inch, 2022-2032F |
6.2.3 Philippines Interactive Tables Market Revenues & Volume, By 65 Inch & Above, 2022-2032F |
6.3 Philippines Interactive Tables Market, By Application |
6.3.1 Overview and Analysis |
6.3.2 Philippines Interactive Tables Market Revenues & Volume, By Exhibition & Trade Shows, 2022-2032F |
6.3.3 Philippines Interactive Tables Market Revenues & Volume, By Education, 2022-2032F |
6.3.4 Philippines Interactive Tables Market Revenues & Volume, By Retail, 2022-2032F |
6.3.5 Philippines Interactive Tables Market Revenues & Volume, By Control Room, 2022-2032F |
6.3.6 Philippines Interactive Tables Market Revenues & Volume, By Hospitality, 2022-2032F |
6.3.7 Philippines Interactive Tables Market Revenues & Volume, By Transportation, 2022-2032F |
7 Philippines Interactive Tables Market Import-Export Trade Statistics |
7.1 Philippines Interactive Tables Market Export to Major Countries |
7.2 Philippines Interactive Tables Market Imports from Major Countries |
8 Philippines Interactive Tables Market Key Performance Indicators |
8.1 Average time spent by users on interactive tables |
8.2 Number of new installations and deployments of interactive tables in different sectors |
8.3 Rate of adoption of interactive table technology in various industries |
9 Philippines Interactive Tables Market - Opportunity Assessment |
9.1 Philippines Interactive Tables Market Opportunity Assessment, By Technology, 2022 & 2032F |
9.2 Philippines Interactive Tables Market Opportunity Assessment, By Screen Size, 2022 & 2032F |
9.3 Philippines Interactive Tables Market Opportunity Assessment, By Application, 2022 & 2032F |
10 Philippines Interactive Tables Market - Competitive Landscape |
10.1 Philippines Interactive Tables Market Revenue Share, By Companies, 2025 |
10.2 Philippines Interactive Tables Market Competitive Benchmarking, By Operating and Technical Parameters |
11 Company Profiles |
12 Recommendations |
13 Disclaimer |
Global Go To Market Strategy - 2030
Export potential enables firms to identify high-growth global markets with greater confidence by combining advanced trade intelligence with a structured quantitative methodology. The framework analyzes emerging demand trends and country-level import patterns while integrating macroeconomic and trade datasets such as GDP and population forecasts, bilateral import–export flows, tariff structures, elasticity differentials between developed and developing economies, geographic distance, and import demand projections. Using weighted trade values from 2020–2024 as the base period to project country-to-country export potential for 2030, these inputs are operationalized through calculated drivers such as gravity model parameters, tariff impact factors, and projected GDP per-capita growth. Through an analysis of hidden potentials, demand hotspots, and market conditions that are most favorable to success, this method enables firms to focus on target countries, maximize returns, and global expansion with data, backed by accuracy.
By factoring in the projected importer demand gap that is currently unmet and could be potential opportunity, it identifies the potential for the Exporter (Country) among 190 countries, against the general trade analysis, which identifies the biggest importer or exporter.
To discover high-growth global markets and optimize your business strategy:
Click Here
Pricing
- Single User License$ 1,995
- Department License$ 2,400
- Site License$ 3,120
- Global License$ 3,795

Leadership Perspectives from Industry Events
Search
Thought Leadership and Analyst Meet


Our Clients
6WResearch In News
- India Air Conditioner Market Set for Strong Rebound in 2026 After Weather-Led Correction and GST-Driven Recovery: 6Wresearch
- ADAS in India: How Automatic Emergency Braking, Blind Spot Detection & Driver Monitoring are Transforming Road Safety
- Doha a strategic location for EV manufacturing hub: IPA Qatar
- Demand for luxury TVs surging in the GCC, says Samsung
- Empowering Growth: The Thriving Journey of Bangladesh’s Cable Industry
- Demand for luxury TVs surging in the GCC, says Samsung
Latest Reports
- Nicaragua RPG Gaming Market (2026-2032)
- New Zealand RPG Gaming Market (2026-2032)
- Netherlands RPG Gaming Market (2026-2032)
- Nauru RPG Gaming Market (2026-2032)
- Namibia RPG Gaming Market (2026-2032)
- Mozambique RPG Gaming Market (2026-2032)
- Montenegro RPG Gaming Market (2026-2032)
- Mongolia RPG Gaming Market (2026-2032)
- Monaco RPG Gaming Market (2026-2032)
- Micronesia RPG Gaming Market (2026-2032)
Industry Events and Analyst Meet

EV India Expo 2026

HIMTEX 2026

India Refining Summit 2026

India EV Show 2026

EV tech India Expo 2026
Whitepaper
- Middle East & Africa Commercial Security Market Click here to view more.
- Middle East & Africa Fire Safety Systems & Equipment Market Click here to view more.
- GCC Drone Market Click here to view more.
- Middle East Lighting Fixture Market Click here to view more.
- GCC Physical & Perimeter Security Market Click here to view more.