Uruguay Display Market (2025-2031) | Size, Trends, Companies, Forecast, Value, Industry, Analysis, Segmentation, Outlook, Revenue, Growth & Share
Market Forecast By Display Technology (LCD, OLED, Micro-LED, Direct-vew LED, Other), By Panel Size (Microdisplays, Small and Medium-sized Panels, Large Panels), By Product Type (Smartphones, Television Sets, PC Monitors & Laptops, Digital Signage/Large Format Displays, Automotive Displays, Tablets, Smart Wearables, Others), By Vertical (Consumer, Automotive, Sports & Entertainment, Transportation, Industrial & Enterprise, Education, Healthcare) And Competitive Landscape
| Product Code: ETC5115300 | Publication Date: Nov 2023 | Updated Date: Sep 2025 | Product Type: Market Research Report | |
| Publisher: 6Wresearch | Author: Shubham Padhi | No. of Pages: 60 | No. of Figures: 30 | No. of Tables: 5 |
Uruguay Display Market Year-wise Growth Rate (2021-2031F)
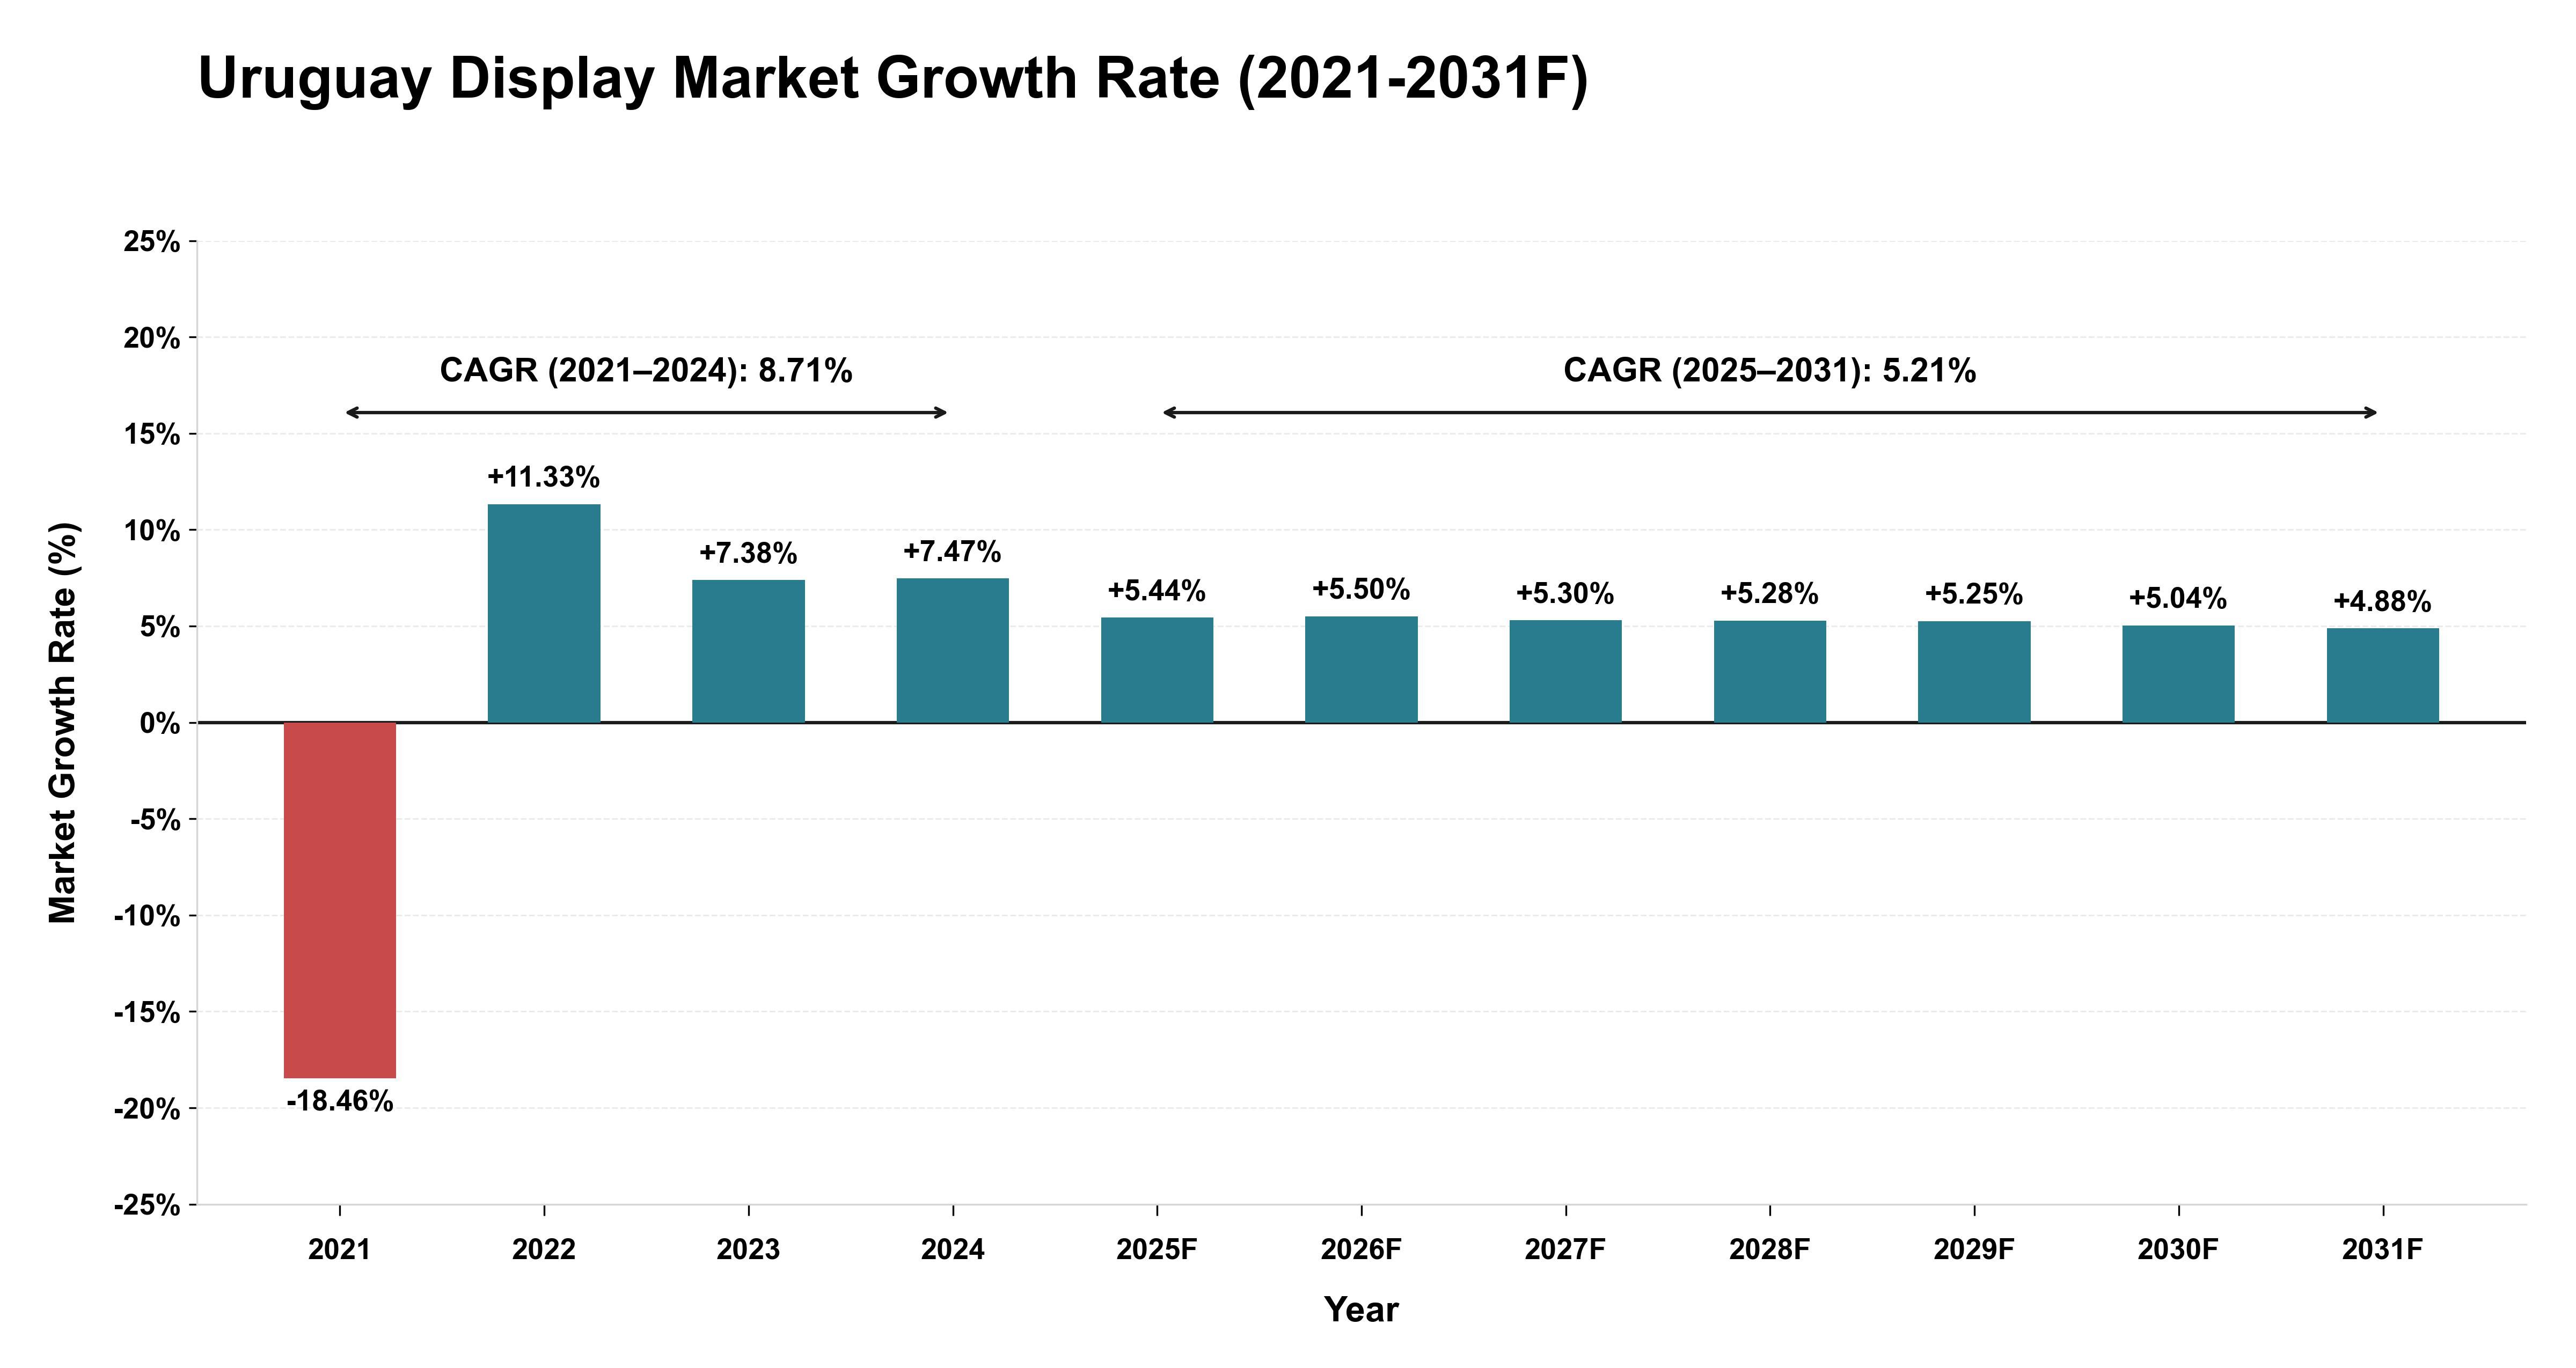
The Uruguay Display Market experienced a tumultuous period from 2021 to 2024, with a sharp decline in growth of -18.46% in 2021 followed by a notable rebound of 11.33% in 2022. This erratic behavior was influenced by shifting consumer preferences and technological advancements impacting demand dynamics. From 2025 to 2031, the market is expected to stabilize with a forecasted CAGR of 5.21%, indicating a more sustainable growth path driven by improved supply chain efficiencies and regulatory stability. The gradual deceleration in growth rates over the forecast period reflects a maturing market landscape as competition intensifies and product innovation becomes incremental rather than revolutionary, emphasizing the importance of strategic differentiation to maintain market share in the Uruguay Display Market.
Key Highlights of the Report:
- Uruguay Display Market Outlook
- Market Size of Uruguay Display Market, 2024
- Forecast of Uruguay Display Market, 2031
- Historical Data and Forecast of Uruguay Display Revenues & Volume for the Period 2021-2031
- Uruguay Display Market Trend Evolution
- Uruguay Display Market Drivers and Challenges
- Uruguay Display Price Trends
- Uruguay Display Porter`s Five Forces
- Uruguay Display Industry Life Cycle
- Historical Data and Forecast of Uruguay Display Market Revenues & Volume By Display Technology for the Period 2021-2031
- Historical Data and Forecast of Uruguay Display Market Revenues & Volume By LCD for the Period 2021-2031
- Historical Data and Forecast of Uruguay Display Market Revenues & Volume By OLED for the Period 2021-2031
- Historical Data and Forecast of Uruguay Display Market Revenues & Volume By Micro-LED for the Period 2021-2031
- Historical Data and Forecast of Uruguay Display Market Revenues & Volume By Direct-vew LED for the Period 2021-2031
- Historical Data and Forecast of Uruguay Display Market Revenues & Volume By Other for the Period 2021-2031
- Historical Data and Forecast of Uruguay Display Market Revenues & Volume By Panel Size for the Period 2021-2031
- Historical Data and Forecast of Uruguay Display Market Revenues & Volume By Microdisplays for the Period 2021-2031
- Historical Data and Forecast of Uruguay Display Market Revenues & Volume By Small and Medium-sized Panels for the Period 2021-2031
- Historical Data and Forecast of Uruguay Display Market Revenues & Volume By Large Panels for the Period 2021-2031
- Historical Data and Forecast of Uruguay Display Market Revenues & Volume By Product Type for the Period 2021-2031
- Historical Data and Forecast of Uruguay Display Market Revenues & Volume By Smartphones for the Period 2021-2031
- Historical Data and Forecast of Uruguay Display Market Revenues & Volume By Television Sets for the Period 2021-2031
- Historical Data and Forecast of Uruguay Display Market Revenues & Volume By PC Monitors & Laptops for the Period 2021-2031
- Historical Data and Forecast of Uruguay Display Market Revenues & Volume By Digital Signage/Large Format Displays for the Period 2021-2031
- Historical Data and Forecast of Uruguay Display Market Revenues & Volume By Automotive Displays for the Period 2021-2031
- Historical Data and Forecast of Uruguay Display Market Revenues & Volume By Tablets for the Period 2021-2031
- Historical Data and Forecast of Uruguay Display Market Revenues & Volume By Smart Wearables for the Period 2021-2031
- Historical Data and Forecast of Uruguay Display Market Revenues & Volume By Others for the Period 2021-2031
- Historical Data and Forecast of Uruguay Display Market Revenues & Volume By Vertical for the Period 2021-2031
- Historical Data and Forecast of Uruguay Display Market Revenues & Volume By Consumer for the Period 2021-2031
- Historical Data and Forecast of Uruguay Display Market Revenues & Volume By Automotive for the Period 2021-2031
- Historical Data and Forecast of Uruguay Display Market Revenues & Volume By Sports & Entertainment for the Period 2021-2031
- Historical Data and Forecast of Uruguay Display Market Revenues & Volume By Transportation for the Period 2021-2031
- Historical Data and Forecast of Uruguay Display Market Revenues & Volume By Industrial & Enterprise for the Period 2021-2031
- Historical Data and Forecast of Uruguay Display Market Revenues & Volume By Education for the Period 2021-2031
- Historical Data and Forecast of Uruguay Display Market Revenues & Volume By Healthcare for the Period 2021-2031
- Uruguay Display Import Export Trade Statistics
- Market Opportunity Assessment By Display Technology
- Market Opportunity Assessment By Panel Size
- Market Opportunity Assessment By Product Type
- Market Opportunity Assessment By Vertical
- Uruguay Display Top Companies Market Share
- Uruguay Display Competitive Benchmarking By Technical and Operational Parameters
- Uruguay Display Company Profiles
- Uruguay Display Key Strategic Recommendations
Frequently Asked Questions About the Market Study (FAQs):
6Wresearch actively monitors the Uruguay Display Market and publishes its comprehensive annual report, highlighting emerging trends, growth drivers, revenue analysis, and forecast outlook. Our insights help businesses to make data-backed strategic decisions with ongoing market dynamics. Our analysts track relevent industries related to the Uruguay Display Market, allowing our clients with actionable intelligence and reliable forecasts tailored to emerging regional needs.
Yes, we provide customisation as per your requirements. To learn more, feel free to contact us on sales@6wresearch.com
1 Executive Summary |
2 Introduction |
2.1 Key Highlights of the Report |
2.2 Report Description |
2.3 Market Scope & Segmentation |
2.4 Research Methodology |
2.5 Assumptions |
3 Uruguay Display Market Overview |
3.1 Uruguay Country Macro Economic Indicators |
3.2 Uruguay Display Market Revenues & Volume, 2021 & 2031F |
3.3 Uruguay Display Market - Industry Life Cycle |
3.4 Uruguay Display Market - Porter's Five Forces |
3.5 Uruguay Display Market Revenues & Volume Share, By Display Technology, 2021 & 2031F |
3.6 Uruguay Display Market Revenues & Volume Share, By Panel Size, 2021 & 2031F |
3.7 Uruguay Display Market Revenues & Volume Share, By Product Type, 2021 & 2031F |
3.8 Uruguay Display Market Revenues & Volume Share, By Vertical, 2021 & 2031F |
4 Uruguay Display Market Dynamics |
4.1 Impact Analysis |
4.2 Market Drivers |
4.2.1 Increasing demand for advanced display technologies in various industries such as retail, healthcare, and automotive |
4.2.2 Growing adoption of digital signage for advertising and promotional activities |
4.2.3 Technological advancements leading to the development of higher resolution and energy-efficient displays |
4.3 Market Restraints |
4.3.1 High initial investment cost associated with implementing advanced display technologies |
4.3.2 Limited consumer awareness and understanding of the benefits of new display technologies |
4.3.3 Potential challenges related to compatibility and integration issues with existing systems |
5 Uruguay Display Market Trends |
6 Uruguay Display Market Segmentations |
6.1 Uruguay Display Market, By Display Technology |
6.1.1 Overview and Analysis |
6.1.2 Uruguay Display Market Revenues & Volume, By LCD, 2021-2031F |
6.1.3 Uruguay Display Market Revenues & Volume, By OLED, 2021-2031F |
6.1.4 Uruguay Display Market Revenues & Volume, By Micro-LED, 2021-2031F |
6.1.5 Uruguay Display Market Revenues & Volume, By Direct-vew LED, 2021-2031F |
6.1.6 Uruguay Display Market Revenues & Volume, By Other, 2021-2031F |
6.2 Uruguay Display Market, By Panel Size |
6.2.1 Overview and Analysis |
6.2.2 Uruguay Display Market Revenues & Volume, By Microdisplays, 2021-2031F |
6.2.3 Uruguay Display Market Revenues & Volume, By Small and Medium-sized Panels, 2021-2031F |
6.2.4 Uruguay Display Market Revenues & Volume, By Large Panels, 2021-2031F |
6.3 Uruguay Display Market, By Product Type |
6.3.1 Overview and Analysis |
6.3.2 Uruguay Display Market Revenues & Volume, By Smartphones, 2021-2031F |
6.3.3 Uruguay Display Market Revenues & Volume, By Television Sets, 2021-2031F |
6.3.4 Uruguay Display Market Revenues & Volume, By PC Monitors & Laptops, 2021-2031F |
6.3.5 Uruguay Display Market Revenues & Volume, By Digital Signage/Large Format Displays, 2021-2031F |
6.3.6 Uruguay Display Market Revenues & Volume, By Automotive Displays, 2021-2031F |
6.3.7 Uruguay Display Market Revenues & Volume, By Tablets, 2021-2031F |
6.3.8 Uruguay Display Market Revenues & Volume, By Others, 2021-2031F |
6.3.9 Uruguay Display Market Revenues & Volume, By Others, 2021-2031F |
6.4 Uruguay Display Market, By Vertical |
6.4.1 Overview and Analysis |
6.4.2 Uruguay Display Market Revenues & Volume, By Consumer, 2021-2031F |
6.4.3 Uruguay Display Market Revenues & Volume, By Automotive, 2021-2031F |
6.4.4 Uruguay Display Market Revenues & Volume, By Sports & Entertainment, 2021-2031F |
6.4.5 Uruguay Display Market Revenues & Volume, By Transportation, 2021-2031F |
6.4.6 Uruguay Display Market Revenues & Volume, By Industrial & Enterprise, 2021-2031F |
6.4.7 Uruguay Display Market Revenues & Volume, By Education, 2021-2031F |
7 Uruguay Display Market Import-Export Trade Statistics |
7.1 Uruguay Display Market Export to Major Countries |
7.2 Uruguay Display Market Imports from Major Countries |
8 Uruguay Display Market Key Performance Indicators |
8.1 Average time spent by consumers interacting with digital displays |
8.2 Number of new product launches incorporating advanced display technologies |
8.3 Adoption rate of high-resolution displays in key industries in Uruguay |
9 Uruguay Display Market - Opportunity Assessment |
9.1 Uruguay Display Market Opportunity Assessment, By Display Technology, 2021 & 2031F |
9.2 Uruguay Display Market Opportunity Assessment, By Panel Size, 2021 & 2031F |
9.3 Uruguay Display Market Opportunity Assessment, By Product Type, 2021 & 2031F |
9.4 Uruguay Display Market Opportunity Assessment, By Vertical, 2021 & 2031F |
10 Uruguay Display Market - Competitive Landscape |
10.1 Uruguay Display Market Revenue Share, By Companies, 2024 |
10.2 Uruguay Display Market Competitive Benchmarking, By Operating and Technical Parameters |
11 Company Profiles |
12 Recommendations | 13 Disclaimer |
Global Go To Market Strategy - 2030
Export potential enables firms to identify high-growth global markets with greater confidence by combining advanced trade intelligence with a structured quantitative methodology. The framework analyzes emerging demand trends and country-level import patterns while integrating macroeconomic and trade datasets such as GDP and population forecasts, bilateral import–export flows, tariff structures, elasticity differentials between developed and developing economies, geographic distance, and import demand projections. Using weighted trade values from 2020–2024 as the base period to project country-to-country export potential for 2030, these inputs are operationalized through calculated drivers such as gravity model parameters, tariff impact factors, and projected GDP per-capita growth. Through an analysis of hidden potentials, demand hotspots, and market conditions that are most favorable to success, this method enables firms to focus on target countries, maximize returns, and global expansion with data, backed by accuracy.
By factoring in the projected importer demand gap that is currently unmet and could be potential opportunity, it identifies the potential for the Exporter (Country) among 190 countries, against the general trade analysis, which identifies the biggest importer or exporter.
To discover high-growth global markets and optimize your business strategy:
Click Here
Pricing
- Single User License$ 1,995
- Department License$ 2,400
- Site License$ 3,120
- Global License$ 3,795

Leadership Perspectives from Industry Events
Search
Thought Leadership and Analyst Meet


Our Clients
6WResearch In News
- India Air Conditioner Market Set for Strong Rebound in 2026 After Weather-Led Correction and GST-Driven Recovery: 6Wresearch
- ADAS in India: How Automatic Emergency Braking, Blind Spot Detection & Driver Monitoring are Transforming Road Safety
- Doha a strategic location for EV manufacturing hub: IPA Qatar
- Demand for luxury TVs surging in the GCC, says Samsung
- Empowering Growth: The Thriving Journey of Bangladesh’s Cable Industry
- Demand for luxury TVs surging in the GCC, says Samsung
Latest Reports
- Nicaragua RPG Gaming Market (2026-2032)
- New Zealand RPG Gaming Market (2026-2032)
- Netherlands RPG Gaming Market (2026-2032)
- Nauru RPG Gaming Market (2026-2032)
- Namibia RPG Gaming Market (2026-2032)
- Mozambique RPG Gaming Market (2026-2032)
- Montenegro RPG Gaming Market (2026-2032)
- Mongolia RPG Gaming Market (2026-2032)
- Monaco RPG Gaming Market (2026-2032)
- Micronesia RPG Gaming Market (2026-2032)
Industry Events and Analyst Meet

EV India Expo 2026

HIMTEX 2026

India Refining Summit 2026

India EV Show 2026

EV tech India Expo 2026
Whitepaper
- Middle East & Africa Commercial Security Market Click here to view more.
- Middle East & Africa Fire Safety Systems & Equipment Market Click here to view more.
- GCC Drone Market Click here to view more.
- Middle East Lighting Fixture Market Click here to view more.
- GCC Physical & Perimeter Security Market Click here to view more.