Brazil Thermal Imaging Market (2016-2022) | Share, Companies, Forecast, Size, Value, Revenue, Analysis, Trends, Growth, Industry & Outlook
Market Forecast by Technologies (Cooled and Uncooled), Form Factors (Fixed and Handheld), Verticals (Defense/Military, Commercial and Industrial) and Applications (Security, testing & Detection, Surveillance, Firefighting and Others)
| Product Code: ETC000299 | Publication Date: Mar 2016 | Product Type: Report | ||
| Publisher: 6Wresearch | Author: Ravi Bhandari | No. of Pages: 104 | No. of Figures: 62 | No. of Tables: 7 |
Brazil thermal imaging market has been divided into two major sub-segment markets i.e. cooled and uncooled thermal imaging devices & systems. Apart from this Brazil thermal imaging market is further divided into form factors, i.e. fixed-mounted (rotary & non-rotary) and handheld thermal imaging devices & systems.Growing security concerns, Rio Olympics 2016 and rising UAVs market have led the overall growth in demand for thermal imaging devices/ systems in Brazil. Brazil government is investing heavily on security to counter terrorism, drug trafficking and cross border intrusion. Amongst all verticals, defense recorded lion share in terms of revenues, whereas industrial vertical registered majority of the share in terms of volume during 2015.According to 6Wresearch, Brazil thermal imaging market is expected to reach $79.4 million by 2022. The market inclined during 2012-14 owing to several defense upgrade projects such as AMX and F-5 fighter jets along with modernization of Panthers, Fennec and Esquilo helicopters. Overall market volume declined in 2015 due to weak economic conditions, lower defense spending and rising prices. Similar trend is anticipated in 2016, however, the market is expected to revive back in 2017. The report thoroughly covers thermal imaging market types, technology, applications and verticals. The report provides an unbiased and detailed analysis of the on-going trends, opportunities/high growth areas, market drivers which would help the stakeholders to decide and align their market strategies according to the current and future market dynamics.
Key Highlights of the Report:
• Market Dynamics Including Drivers, Restraints, Opportunity for Brazil Thermal Imaging Market
• Historical Market Revenue & Volume Trends for Global Thermal Imaging Market, 2010 - 2015
• Market Size & Revenue & Volume Forecast of Global Thermal Imaging Market until 2022
• Historical Market Revenue Trends for Brazil Thermal Imaging Market, 2012 - 2015
• Market Size & Revenue Forecast of Brazil Thermal Imaging Market until 2022
• Historical Market Volume Trends for Brazil Thermal Imaging Market, 2012 - 2015
• Market Size & Volume Forecast of Brazil Thermal Imaging Market until 2022
• Market Volume and Revenue Forecast and Estimations by Technology until 2022
• Market Volume and Revenue Forecast and Estimations by Form Factor until 2022
• Market Revenue Trends and Forecast by Verticals & Applications until 2022
• Existing Market Trends
• Industry Life Cycle & Value Chain Analysis
• Porter's Five Forces Analysis
• Players Market Share
• Competitive Benchmarking
• Company Profiles and Key Strategic Pointers
Markets Covered:
The report provides the detailed analysis of the following market segments:
• By Technologies:
o Cooled
o Uncooled
• Form Factors:
o Fixed Mount
• Rotary
• Non-Rotary
o Handheld
• Verticals:
o Defense/Military
o Commercial
o Industrial
• Applications:
o Security
o Testing & Detection
o Surveillance
o Firefighting
o Others
Frequently Asked Questions About the Market Study (FAQs):
6Wresearch actively monitors the Brazil Thermal Imaging Market and publishes its comprehensive annual report, highlighting emerging trends, growth drivers, revenue analysis, and forecast outlook. Our insights help businesses to make data-backed strategic decisions with ongoing market dynamics. Our analysts track relevent industries related to the Brazil Thermal Imaging Market, allowing our clients with actionable intelligence and reliable forecasts tailored to emerging regional needs.
Yes, we provide customisation as per your requirements. To learn more, feel free to contact us on sales@6wresearch.com
TABLE OF CONTENTS
1 Executive Summary
2 Introduction
2.1 Key Highlights of the Report
2.2 Report Description
2.3 Market Scope & Segmentation
2.4 Assumptions & Methodology
3 Global Thermal Imaging Market Overview
3.1 Global Thermal Imaging Market Revenues (2012-2022F)
3.2 Global Thermal Imaging Market Volume (2012-2022F)
3.3 Global Thermal Imaging Market Revenue Share, By Region (2015 & 2022F)
4 Brazil Thermal Imaging Market Overview
4.1 Brazil Thermal Imaging Market Revenues (2012-2022F)
4.2 Brazil Thermal Imaging Market Volume (2012-2022F)
4.3 Brazil Thermal Imaging Industry Life Cycle
4.4 Brazil Thermal Imaging Market Opportunistic Matrix
4.5 Brazil Thermal Imaging Market Value Chain Analysis
4.6 Brazil Thermal Imaging Market Porter's Five Forces Model
4.7 Brazil Thermal Imaging Market Revenue Share, By Technology (2015 & 2022F)
4.8 Brazil Thermal Imaging Market Revenue Share, By Vertical (2015 & 2022F)
5 Brazil Thermal Imaging Market Dynamics
5.1 Impact Analysis
5.2 Market Drivers
5.3 Market Restraints
6 Brazil Thermal Imaging Market Current & Future Trends
6.1 Import Driven Market
6.2 Thermal Imaging Technology Adoption in UAVs
7 Brazil Thermal Imaging Market Overview, By Technology
7.1 Brazil Cooled Thermal Imaging Devices/ Systems' Market Revenues (2012-2022F)
7.2 Brazil Cooled Thermal Imaging Devices/ Systems' Market Volume (2012-2022F)
7.3 Brazil Uncooled Thermal Imaging Devices/ Systems' Market Revenues (2012-2022F)
7.4 Brazil Uncooled Thermal Imaging Devices/ Systems' Market Volume (2012-2022F)
8 Brazil Thermal Imaging Market Overview, By Form Factor
8.1 Brazil Fixed-Mounted Thermal Imaging Devices/ Systems' Market Revenues (2012-2022F)
8.1.1 Brazil Fixed-Mounted Thermal Imaging Devices/ Systems' Market Revenues,
By Rotary & Non-Rotary (2012-2022F)
8.2 Brazil Fixed-Mounted Thermal Imaging Devices/ Systems' Market Volume (2012-2022F)
8.2.1 Brazil Fixed-Mounted Thermal Imaging Devices/ Systems' Market Volume,
By Rotary & Non-Rotary (2012-2022F)
8.3 Brazil Handheld Thermal Imaging Devices/ Systems' Market Revenues (2012-2022F)
8.4 Brazil Handheld Thermal Imaging Devices/ Systems' Market Volume (2012-2022F)
9 Brazil Thermal Imaging Market Overview, By Vertical
9.1 Brazil Thermal Imaging Market Revenues, By Military/ Defense Vertical (2012-2022F)
9.2 Brazil Thermal Imaging Market Revenues, By Industrial Vertical (2012-2022F)
9.3 Brazil Thermal Imaging Market Revenues, By Commercial Vertical (2012-2022F)
10 Brazil Thermal Imaging Market Overview, By Applications
10.1 Brazil Thermal Imaging Market Revenues, By Security Application (2012-2022F)
10.2 Brazil Thermal Imaging Market Revenues, By Surveillance Application (2012-2022F)
10.3 Brazil Thermal Imaging Market Revenues, By Testing & Detection Application (2012-2022F)
10.4 Brazil Thermal Imaging Market Revenues, By Firefighting Application (2012-2022F)
10.5 Brazil Thermal Imaging Market Revenues, By Other Applications (2012-2022F)
11 Brazil Thermal Imaging Market Price Trend, By Technology
12 Brazil Thermal Imaging Market Price Trend, By Form Factor
13 Competitive Landscape
13.1 Brazil Thermal Imaging Market Volume Share, By Company (2015)
13.2 Competitive Benchmarking, By Application
14 Company Profiles
14.1 FLIR Inc.
14.2 Elbit Systems
14.3 Testo AG
14.4 Fluke Inc.
14.5 Sagem Avionics LLC
14.6 ULIS
15 Strategic Recommendations
16 Disclaimer
List of Figures
Figure 1 Global Thermal Imaging Market Revenues, 2010-2015 ($ Billion)
Figure 2 Global Thermal Imaging Market Revenues, 2016E-2022F ($ Billion)
Figure 3 Global Thermal Imaging Market Volume, 2010-2022F (Million Units)
Figure 4 Global Thermal Imaging Devices/ Systems' Market Price Trend, 2010-2022F ($ Per Unit)
Figure 5 Global Thermal Imaging Market Revenue Share, By Region (2015)
Figure 6 Brazil Thermal Imaging Market Revenues, 2012-2015 ($ Million)
Figure 7 Brazil Thermal Imaging Market Revenues, 2016E-2022F ($ Million)
Figure 8 Brazil Homeland Security Expenditure, 2010-2022F ($ Million)
Figure 9 Brazil Thermal Imaging Market Volume, 2012-2015 (Units)
Figure 10 Brazil Thermal Imaging Market Volume, 2016E-2022F (Units)
Figure 11 Brazil Thermal Imaging Industry Life Cycle (2015)
Figure 12 Value Chain Analysis of Brazil Thermal Imaging Market
Figure 13 Brazil Thermal Imaging Market Revenue Share, By Technology (2015)
Figure 14 Brazil Thermal Imaging Market Revenue Share, By Technology (2022F)
Figure 15 Brazil Thermal Imaging Market Revenue Share, By Vertical (2015)
Figure 16 Brazil Thermal Imaging Market Revenue Share, By Vertical (2022F)
Figure 17 Brazil Electricity Production, 2004-2014 (Terawatt-hours)
Figure 18 Brazil Thermal Imaging Devices/ Systems' Market Price Trend, 2012-2022F ($ Thousand Per Unit)
Figure 19 Brazil MALE UAV Market Volume, 2012-2022 (Units)
Figure 20 Brazil Cooled Thermal Imaging Devices/ Systems' Market Revenues, 2012-2015 ($ Million)
Figure 21 Brazil Cooled Thermal Imaging Devices/ Systems' Market Revenues, 2016E-2022F ($ Million)
Figure 22 Brazil Cooled Thermal Imaging Devices/ Systems' Market Volume, 2012-2015 (Units)
Figure 23 Brazil Cooled Thermal Imaging Devices/ Systems' Market Volume, 2016E-2022F (Units)
Figure 24 Brazil Uncooled Thermal Imaging Devices/ Systems' Market Revenues, 2012-2015 ($ Million)
Figure 25 Brazil Uncooled Thermal Imaging Devices/ Systems' Market Revenues, 2016E-2022F ($ Million)
Figure 26 Brazil Uncooled Thermal Imaging Devices/ Systems' Market Volume, 2012-2015 (Units)
Figure 27 Brazil Uncooled Thermal Imaging Devices/ Systems' Market Volume, 2016E-2022F (Units)
Figure 28 Brazil Fixed-Mounted Thermal Imaging Devices/ Systems' Market Revenues, 2012-2015 ($ Million)
Figure 29 Brazil Fixed-Mounted Thermal Imaging Devices/ Systems' Market Revenues, 2016E-2022F ($ Million)
Figure 30 Brazil Fixed-Mounted Thermal Imaging Devices/ Systems' Market Volume, 2012-2015 (Units)
Figure 31 Brazil Fixed-Mounted Thermal Imaging Devices/ Systems' Market Volume, 2016E-2022F (Units)
Figure 32 Brazil Handheld Thermal Imaging Devices/ Systems' Market Revenues, 2012-2015 ($ Million)
Figure 33 Brazil Handheld Thermal Imaging Devices/ Systems' Market Revenues, 2016E-2022F ($ Million)
Figure 34 Brazil Handheld Thermal Imaging Devices/ Systems' Market Volume, 2012-2015 (Units)
Figure 35 Brazil Handheld Thermal Imaging Devices/ Systems' Market Volume, 2016E-2022F (Units)
Figure 36 Brazil Thermal Imaging Military/ Defense Vertical Market Revenues, 2012-2015 ($ Million)
Figure 37 Brazil Thermal Imaging Military/ Defense Vertical Market Revenues, 2016E-2022F ($ Million)
Figure 38 Brazil Defense Spending, 2012-2022F ($ Billion)
Figure 39 Brazil Thermal Imaging Industrial Vertical Market Revenues, 2012-2015 ($ Million)
Figure 40 Brazil Thermal Imaging Industrial Vertical Market Revenues, 2016E-2022F ($ Million)
Figure 41 Brazil Oil Production & Refinery Capacities, 2005-2014 (Thousand Barrels Daily)
Figure 42 Brazil Gas Production, 2005-2014 (Billion Cubic Meters)
Figure 43 Brazil Thermal Imaging Commercial Vertical Market Revenues, 2012-2015 ($ Million)
Figure 44 Brazil Thermal Imaging Commercial Vertical Market Revenues, 2016E-2022F ($ Million)
Figure 45 Brazil Thermal Imaging Security Application Market Revenues, 2012-2015 ($ Million)
Figure 46 Brazil Thermal Imaging Security Vertical Market Revenues, 2016E-2022F ($ Million)
Figure 47 Brazil Video Surveillance Market, 2012-2022 ($ Billon)
Figure 48 Brazil Thermal Imaging Surveillance Application Market Revenues, 2012-2015 ($ Million)
Figure 49 Brazil Thermal Imaging Surveillance Application Market Revenues, 2016E-2022F ($ Million)
Figure 50 Brazil Thermal Imaging Testing & Detection Application Market Revenues, 2012-2015 ($ Million)
Figure 51 Brazil Thermal Imaging Testing & Detection Application Market Revenues, 2016E-2022F ($ Million)
Figure 52 Brazil Thermal Imaging Firefighting Application Market Revenues, 2012-2015 ($ Million)
Figure 53 Brazil Thermal Imaging Firefighting Application Market Revenues, 2016E-2022F ($ Million)
Figure 54 Brazil Thermal Imaging Other Applications Market Revenues, 2012-2015 ($ Million)
Figure 55 Brazil Thermal Imaging Other Application Market Revenues, 2016E-2022F ($ Million)
Figure 56 Brazil Smartphones Market Volume & Penetration, 2012-2022F (Million Units)
Figure 57 Brazil Smartphones Market Volume Share, By Operating System (2015 & 2022F)
Figure 58 Brazil Cooled Thermal Imaging Devices/ Systems' Market Price Trend, 2012-2022F ($ Thousand Per Unit)
Figure 59 Brazil Uncooled Thermal Imaging Devices/ Systems' Market Price Trend, 2012-2022F ($ Thousand Per Unit)
Figure 60 Brazil Fixed-Mounted Thermal Imaging Devices/ Systems' Market Price Trend, 2012-2022F ($ Thousand Per Unit)
Figure 61 Brazil Hand Thermal Imaging Devices/ Systems' Market Price Trend, 2012-2022F ($ Thousand Per Unit)
Figure 62 Brazil Thermal Imaging Market Volume Share, By Company (2015)
List of Tables
Table 1 Brazil Outdoor Eradication of Cannabis Plants and Sites Vs. Key Countries (2012)
Table 2 Brazil Fixed-Mounted Thermal Imaging Devices/ Systems' Market Revenues, By Type, 2012-2015 ($ Million)
Table 3 Brazil Fixed-Mounted Thermal Imaging Devices/ Systems' Market Revenues, By Type, 2016E-2022F ($ Million)
Table 4 Brazil Fixed-Mount Thermal Imaging Devices/ Systems' Market Volume, By Type, 2012-2015 (Units)
Table 5 Brazil Fixed-Mount Thermal Imaging Devices/ Systems‘ Market Volume, By Type, 2016E-2022F (Units)
Table 6 Key Defense Projects for Thermal Imaging Devices/ Systems
Table 7 Brazil Thermal Imaging Market Volume Share of Top 3 Players, 2015E (Units)
Brazil thermal imaging market is expected to grow on account of increasing number of defense up-gradation to improve the operational capabilities of the armed forces of Brazil so as to counter drug trafficking activities as well as strengthening security setup in the country for upcoming Rio Olympic, 2016. This has led foreign thermal imaging systems manufacturers to target Brazilian market.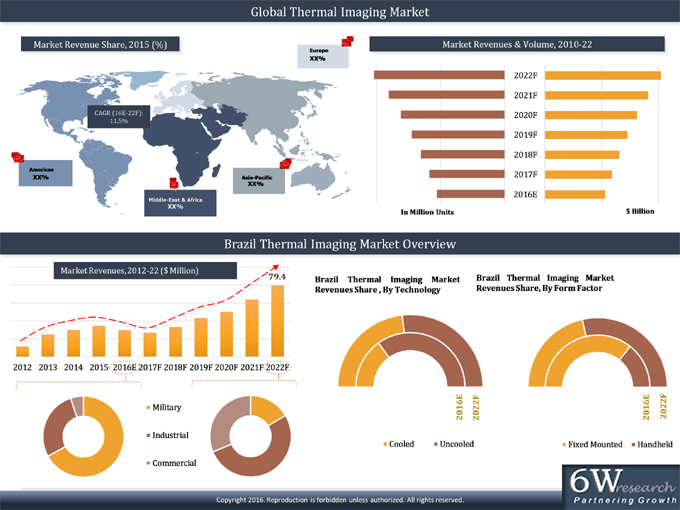
Source: 6Wresearch
Military/ defense vertical accounted for highest revenue market share owing to wide deployment of thermal imaging systems in aircrafts & helicopters especially, fixed mounted cooled thermal imaging systems.
In terms of technology type, uncooled thermal imaging systems/ devices accounted for highest revenue share owing to price advantage over cooled thermal imaging devices/ systems. Market saw influx of U.S. and Israel thermal imaging manufacturers in last few years. These players have either tied up with local defense player, distributor or opened local subsidiary to target the market.
The report estimates and forecast overall Brazil thermal imaging market by revenue & volume and by technology type, form factor, applications and verticals. The report also gives insights price trends, market trends, company profiles, competitive landscape, market drivers and restraints.
Global Go To Market Strategy - 2030
Export potential enables firms to identify high-growth global markets with greater confidence by combining advanced trade intelligence with a structured quantitative methodology. The framework analyzes emerging demand trends and country-level import patterns while integrating macroeconomic and trade datasets such as GDP and population forecasts, bilateral import–export flows, tariff structures, elasticity differentials between developed and developing economies, geographic distance, and import demand projections. Using weighted trade values from 2020–2024 as the base period to project country-to-country export potential for 2030, these inputs are operationalized through calculated drivers such as gravity model parameters, tariff impact factors, and projected GDP per-capita growth. Through an analysis of hidden potentials, demand hotspots, and market conditions that are most favorable to success, this method enables firms to focus on target countries, maximize returns, and global expansion with data, backed by accuracy.
By factoring in the projected importer demand gap that is currently unmet and could be potential opportunity, it identifies the potential for the Exporter (Country) among 190 countries, against the general trade analysis, which identifies the biggest importer or exporter.
To discover high-growth global markets and optimize your business strategy:
Click Here
Pricing
- Single User License$ 1,995
- Department License$ 2,400
- Site License$ 3,120
- Global License$ 3,795

Leadership Perspectives from Industry Events
Search
Thought Leadership and Analyst Meet


Our Clients
6WResearch In News
- India Air Conditioner Market Set for Strong Rebound in 2026 After Weather-Led Correction and GST-Driven Recovery: 6Wresearch
- ADAS in India: How Automatic Emergency Braking, Blind Spot Detection & Driver Monitoring are Transforming Road Safety
- Doha a strategic location for EV manufacturing hub: IPA Qatar
- Demand for luxury TVs surging in the GCC, says Samsung
- Empowering Growth: The Thriving Journey of Bangladesh’s Cable Industry
- Demand for luxury TVs surging in the GCC, says Samsung
Latest Reports
- Nicaragua RPG Gaming Market (2026-2032)
- New Zealand RPG Gaming Market (2026-2032)
- Netherlands RPG Gaming Market (2026-2032)
- Nauru RPG Gaming Market (2026-2032)
- Namibia RPG Gaming Market (2026-2032)
- Mozambique RPG Gaming Market (2026-2032)
- Montenegro RPG Gaming Market (2026-2032)
- Mongolia RPG Gaming Market (2026-2032)
- Monaco RPG Gaming Market (2026-2032)
- Micronesia RPG Gaming Market (2026-2032)
Industry Events and Analyst Meet

EV India Expo 2026

HIMTEX 2026

India Refining Summit 2026

India EV Show 2026

EV tech India Expo 2026
Whitepaper
- Middle East & Africa Commercial Security Market Click here to view more.
- Middle East & Africa Fire Safety Systems & Equipment Market Click here to view more.
- GCC Drone Market Click here to view more.
- Middle East Lighting Fixture Market Click here to view more.
- GCC Physical & Perimeter Security Market Click here to view more.