Algeria Digital Biomarkers Market (2026-2032) Outlook | Share, Size, Value, Analysis, Revenue, Growth, Forecast, Industry, Companies & Trends
Market Forecast By Type (Wellness, Disease, Drugs), By Collection System Type (Wearables, Biosensors, Mobile Apps, Devices and Platforms, Desktop Based Software), By End-users (Pharmaceutical, Life Sciences, Medical Devices, App Vendors, Clinical Research Organizations), By Technology (Cloud Computing, Artificial Intelligence and Machine Learning, Augmented Reality, Blockchain) And Competitive Landscape
| Product Code: ETC072130 | Publication Date: Jun 2021 | Updated Date: Jun 2026 | Product Type: Report | |
| Publisher: 6Wresearch | Author: Sumit Sagar | No. of Pages: 70 | No. of Figures: 35 | No. of Tables: 5 |
Qatar Electric Vehicle Charging Infrastructure Market Size, Share & Growth Rate
The Qatar Electric Vehicle Charging Infrastructure Market was estimated at USD 772 Million in 2025 and is projected to reach USD 1100 Million by 2032, growing at a CAGR of 5.2% from 2026 to 2032. This growth is primarily driven by the increasing adoption of electric vehicles (EVs) in response to environmental initiatives and government policies aimed at reducing carbon emissions. The rapid expansion of urban centers and the surge in infrastructure investments further catalyze the demand for robust charging networks across the nation.
Algeria Digital Biomarkers Market Growth Rate Analysis (2021-2032)
Qatar Electric Vehicle Charging Infrastructure Market Growth Rate Analysis (2021-2032)
The Qatar Electric Vehicle Charging Infrastructure market is experiencing a stable growth trajectory, with yearly growth rates of 5.8% in 2021 and 2022, escalating to 6.4% in 2023. This upward trend reflects significant investments in infrastructure and the government’s commitment to fostering sustainable transport solutions amid a global energy transition. The growth rates, projected to moderate slightly to 6.1% in 2025 and 2026, indicate a robust but maturing market. As consumer demand for electric vehicles increases, driven by technological advancements and supportive policies, the market is expected to sustain growth, with a 6.4% rise anticipated in 2032, driven by enhanced digitalization and energy management solutions.
Qatar Electric Vehicle Charging Infrastructure Market Year-wise Growth Rate and Key Drivers
This graph highlights how the Qatar Electric Vehicle Charging Infrastructure Market has steadily grown over the past five years, supported by major growth factors.
The table below presents the year‑wise growth rates along with the key drivers influencing the market
| Year | Growth Rate | Major Drivers |
| 2021 | 5.8% | Government incentives supported adoption |
| 2022 | 5.8% | Infrastructure investments enhanced accessibility |
| 2023 | 6.4% | Corporate sustainability initiatives accelerated |
| 2024 | 6.3% | Public awareness campaigns increased usage |
| 2025 | 6.1% | Technological advancements improved efficiency |
| 2026 | 6.1% | Partnerships expanded charging networks |
| 2027 | 6.0% | Consumer demand for EVs surged |
| 2028 | 6.3% | Renewable energy integration enhanced appeal |
| 2029 | 6.0% | Urban planning prioritized charging stations |
| 2030 | 5.8% | Fleet electrification drove installations |
| 2031 | 6.0% | Smart charging solutions gained traction |
| 2032 | 6.4% | International collaborations fostered growth |
Note - Market size estimations and growth projections presented in this report are based on 6Wresearch’s advanced forecasting approach, validated with industry datasets as of June 2026.
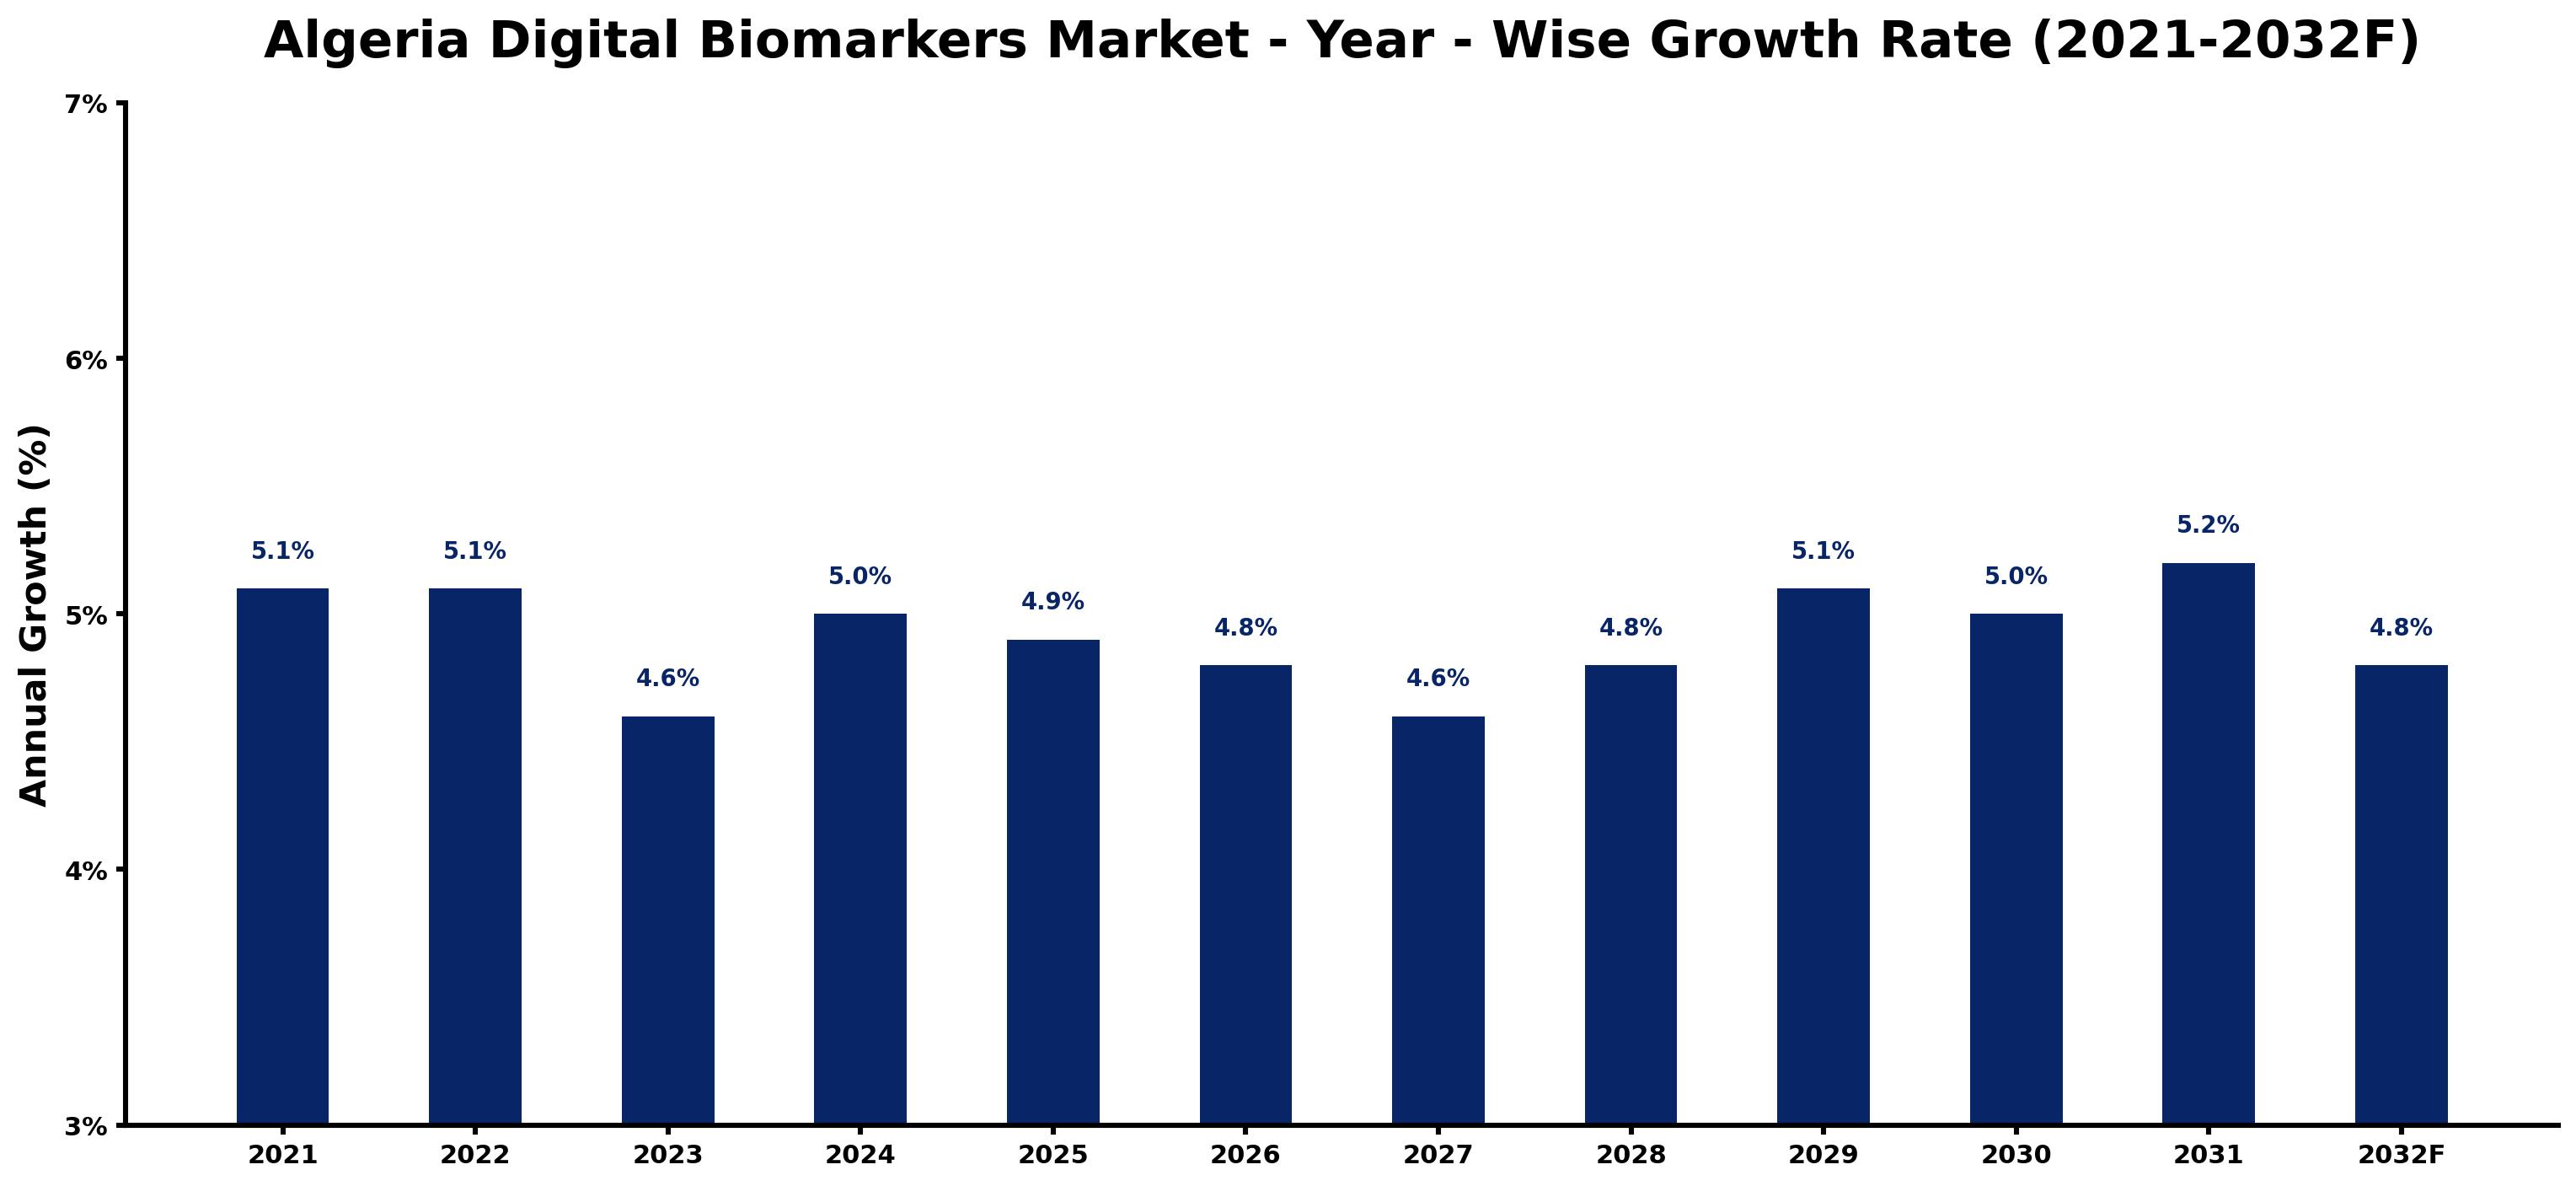
The Algeria Digital Biomarkers Market has experienced steady growth, reflecting a consistent expansion driven by advancements in technology and increasing consumer demand. From a 5.1% growth in 2021 and 2022, the market experienced a slight dip to 4.6% in 2023, possibly due to temporary regulatory adjustments affecting digital health initiatives. However, growth rebounded to 5.0% in 2024, fueled by investments in health infrastructure and a favorable policy environment aimed at digitalization in healthcare. As we look forward, growth rates are projected to stabilize around 4.8% to 5.2% through 2032, supported by a robust energy transition strategy and heightened awareness of the importance of digital health solutions among consumers.
Algeria Digital Biomarkers Market Year-wise Growth Rate and Key Drivers
This graph highlights how the Algeria Digital Biomarkers Market has steadily grown over the past five years, supported by major growth factors.
The table below presents the year‑wise growth rates along with the key drivers influencing the market
| Year | Growth Rate | Major Drivers |
| 2021 | 5.1% | Increasing industrial infrastructure investments |
| 2022 | 5.1% | Rapid growth in telecom and data center sectors |
| 2023 | 4.6% | Growing urbanization and commercial development |
| 2024 | 5.0% | Government infrastructure modernization initiatives |
| 2025 | 4.9% | Expansion of commercial construction activities |
| 2026 | 4.8% | Increasing adoption of advanced technologies |
| 2027 | 4.6% | Increasing industrial automation investments |
| 2028 | 4.8% | Expansion of transportation and logistics networks |
| 2029 | 5.1% | Increasing industrial infrastructure investments |
| 2030 | 5.0% | Growing renewable energy integration projects |
| 2031 | 5.2% | Increasing industrial infrastructure investments |
| 2032 | 4.8% | Government infrastructure modernization initiatives |
Note - Market size estimations and growth projections presented in this report are based on 6Wresearch’s advanced forecasting approach, validated with industry datasets as of June 2026.
Qatar Electric Vehicle Charging Infrastructure Market Synopsis
As Qatar positions itself at the forefront of sustainable transport solutions, the electric vehicle charging infrastructure market is witnessing substantial momentum. The government's commitment to creating a greener urban environment, alongside increasing consumer interest in EVs, is shaping the landscape of charging solutions. The market is characterized by a range of public and private initiatives aimed at expanding charging networks throughout the country.
A significant aspect of this market's evolution is the partnership between governmental bodies and private enterprises to develop comprehensive charging solutions. Emerging technologies such as fast-charging stations and renewable energy integration are further enhancing the appeal of electric vehicle use, indicating a trend towards smart and sustainable urban mobility.
Qatar Electric Vehicle Charging Infrastructure Market Key Takeaways
- Significant growth anticipated due to increasing adoption of electric vehicles and supportive government policies.
- Expansion of urban infrastructure and investments in technology are driving demand for charging stations.
- Integration of fast-charging and renewable energy solutions is transforming the charging landscape.
- Public-private partnerships are crucial for establishing a comprehensive charging network across Qatar.
- Consumer awareness and interest in sustainability are reshaping transportation dynamics in urban areas.
Evaluation of Restraints in Qatar Electric Vehicle Charging Infrastructure Market
Despite the optimistic growth trajectory, several restraints are hindering the Qatar Electric Vehicle Charging Infrastructure Market. A key limitation is the current lack of widespread public awareness regarding the benefits of electric vehicles and their associated charging needs. Additionally, infrastructural challenges, such as limited availability of suitable locations for charging stations and inconsistent grid capacity, can impede progress. The initial investment required for establishing extensive networks also poses a financial barrier, particularly for smaller entities. Finally, regulatory considerations regarding site approvals and safety standards continue to challenge market players as they seek to expand operations.
Qatar Electric Vehicle Charging Infrastructure Market Trends
Emerging trends are significantly influencing the Qatar Electric Vehicle Charging Infrastructure Market. The shift towards fast-charging stations is gaining traction, as consumers demand more efficient charging solutions that minimize downtime. Furthermore, the integration of smart technologies is on the rise; data-driven solutions are being deployed to optimize station operations and enhance user experience. An increasing focus on renewable energy sources, such as solar power for charging stations, is indicative of a broader commitment to sustainability and reducing reliance on fossil fuels. Such trends are likely to shape the competitive landscape and enhance service offerings.
Qatar Electric Vehicle Charging Infrastructure Market Opportunities
The Qatar Electric Vehicle Charging Infrastructure Market presents numerous opportunities for growth and investment. With government initiatives promoting electric vehicle adoption, stakeholders can capitalize on the demand for an expanded charging network. There is also a growing market for innovative solutions, such as mobile apps that locate charging stations and facilitate user-friendly experiences. Collaborations between technology providers and real estate developers can lead to strategic placements of charging stations in residential and commercial spaces. Furthermore, as businesses transition towards sustainable practices, the potential for workplace charging solutions is expanding, indicating a ripe area for investment.
Government Initiatives in the Qatar Electric Vehicle Charging Infrastructure Market
The Qatari government is actively promoting the development of electric vehicle charging infrastructure through a variety of initiatives. Policies aimed at incentivizing the use of electric vehicles, including tax breaks and subsidies, are paving the way for broader adoption. Furthermore, regulatory frameworks are being established to ensure safety standards for charging installations. The government is also fostering collaboration between different stakeholders, including automotive manufacturers and energy providers, to create a seamless and sustainable charging ecosystem across the nation. Such initiatives indicate a strategic commitment to integrating electric vehicles into the broader national transportation agenda.
Future Insights of the Qatar Electric Vehicle Charging Infrastructure Market
Looking ahead to the period from 2026 to 2032, the Qatar Electric Vehicle Charging Infrastructure Market is poised for significant evolution. As electric vehicle ownership rises, so will the demand for convenient and efficient charging solutions. The market is expected to witness technological advancements, particularly in charging speeds and the integration of renewable energy sources. Furthermore, public awareness and consumer education on the benefits of electric vehicles will likely play a pivotal role in shaping future market dynamics. Overall, the outlook remains positive as the country continues its commitment to sustainability and innovation in transportation.
Qatar Electric Vehicle Charging Infrastructure Market Latest Developments (May 2025 - June 2026)
In recent months, the Qatar Electric Vehicle Charging Infrastructure Market has seen various developments reflecting its dynamic nature. Stakeholders are increasingly focusing on the establishment of fast-charging networks across major urban centers, responding to the growing demand for quicker turnaround times. Collaborative efforts between municipal authorities and private enterprises have resulted in the rollout of new charging stations in strategic locations, enhancing accessibility for electric vehicle owners. Additionally, pilot projects integrating renewable energy sources into charging infrastructure are underway, signaling a shift towards more sustainable solutions in the market.
Qatar Electric Vehicle Charging Infrastructure Market - Key Attractiveness of the Report
- 10 Years of Market Numbers
- Historical Data Starting from 2022 to 2025
- Base Year: 2025
- Forecast Data until 2032
- Key Performance Indicators Impacting the Market
- Major Upcoming Developments and Projects
Key Highlights of the Report:
- Algeria Digital Biomarkers Market Outlook
- Market Size of Algeria Digital Biomarkers Market, 2025
- Forecast of Algeria Digital Biomarkers Market, 2032
- Historical Data and Forecast of Algeria Digital Biomarkers Revenues & Volume for the Period 2022-2032F
- Algeria Digital Biomarkers Market Trend Evolution
- Algeria Digital Biomarkers Market Drivers and Challenges
- Algeria Digital Biomarkers Price Trends
- Algeria Digital Biomarkers Porter's Five Forces
- Algeria Digital Biomarkers Industry Life Cycle
- Historical Data and Forecast of Algeria Digital Biomarkers Market Revenues & Volume By Type for the Period 2022-2032F
- Historical Data and Forecast of Algeria Digital Biomarkers Market Revenues & Volume By Wellness for the Period 2022-2032F
- Historical Data and Forecast of Algeria Digital Biomarkers Market Revenues & Volume By Disease for the Period 2022-2032F
- Historical Data and Forecast of Algeria Digital Biomarkers Market Revenues & Volume By Drugs for the Period 2022-2032F
- Historical Data and Forecast of Algeria Digital Biomarkers Market Revenues & Volume By Collection System Type for the Period 2022-2032F
- Historical Data and Forecast of Algeria Digital Biomarkers Market Revenues & Volume By Wearables for the Period 2022-2032F
- Historical Data and Forecast of Algeria Digital Biomarkers Market Revenues & Volume By Biosensors for the Period 2022-2032F
- Historical Data and Forecast of Algeria Digital Biomarkers Market Revenues & Volume By Mobile Apps for the Period 2022-2032F
- Historical Data and Forecast of Algeria Digital Biomarkers Market Revenues & Volume By Devices and Platforms for the Period 2022-2032F
- Historical Data and Forecast of Algeria Digital Biomarkers Market Revenues & Volume By Desktop Based Software for the Period 2022-2032F
- Historical Data and Forecast of Algeria Digital Biomarkers Market Revenues & Volume By End-users for the Period 2022-2032F
- Historical Data and Forecast of Algeria Digital Biomarkers Market Revenues & Volume By Pharmaceutical for the Period 2022-2032F
- Historical Data and Forecast of Algeria Digital Biomarkers Market Revenues & Volume By Life Sciences for the Period 2022-2032F
- Historical Data and Forecast of Algeria Digital Biomarkers Market Revenues & Volume By Medical Devices for the Period 2022-2032F
- Historical Data and Forecast of Algeria Digital Biomarkers Market Revenues & Volume By App Vendors for the Period 2022-2032F
- Historical Data and Forecast of Algeria Digital Biomarkers Market Revenues & Volume By Clinical Research Organizations for the Period 2022-2032F
- Historical Data and Forecast of Algeria Digital Biomarkers Market Revenues & Volume By Technology for the Period 2022-2032F
- Historical Data and Forecast of Algeria Digital Biomarkers Market Revenues & Volume By Cloud Computing for the Period 2022-2032F
- Historical Data and Forecast of Algeria Digital Biomarkers Market Revenues & Volume By Artificial Intelligence and Machine Learning for the Period 2022-2032F
- Historical Data and Forecast of Algeria Digital Biomarkers Market Revenues & Volume By Augmented Reality for the Period 2022-2032F
- Historical Data and Forecast of Algeria Digital Biomarkers Market Revenues & Volume By Blockchain for the Period 2022-2032F
- Algeria Digital Biomarkers Import Export Trade Statistics
- Market Opportunity Assessment By Type
- Market Opportunity Assessment By Collection System Type
- Market Opportunity Assessment By End-users
- Market Opportunity Assessment By Technology
- Algeria Digital Biomarkers Top Companies Market Share
- Algeria Digital Biomarkers Competitive Benchmarking By Technical and Operational Parameters
- Algeria Digital Biomarkers Company Profiles
- Algeria Digital Biomarkers Key Strategic Recommendations
Frequently Asked Questions About the Market Study (FAQs):
The market is estimated to be USD 772 Million in 2025 and is projected to reach USD 1100 Million by 2032, reflecting a CAGR of 5.2% from 2026 to 2032.
An increasing awareness of environmental sustainability among consumers is driving the adoption of electric vehicles. As consumers seek convenient and accessible charging solutions, there is a growing demand for robust infrastructure to support their transition from conventional vehicles.
The Qatari government's policies are crucial in fostering electric vehicle adoption. By offering incentives and establishing safety standards, they create a conducive environment for infrastructure development and consumer acceptance.
Future advancements are expected to include faster charging solutions and the integration of smart technologies to improve user experience. These developments will likely enhance the efficiency of charging stations and make them more appealing to consumers.
Investment opportunities are prominent in public-private partnerships focused on expanding charging networks and the development of innovative mobile applications that facilitate user interaction with charging stations.
6Wresearch actively monitors the Algeria Digital Biomarkers Market and publishes its comprehensive annual report, highlighting emerging trends, growth drivers, revenue analysis, and forecast outlook. Our insights help businesses to make data-backed strategic decisions with ongoing market dynamics. Our analysts track relevent industries related to the Algeria Digital Biomarkers Market, allowing our clients with actionable intelligence and reliable forecasts tailored to emerging regional needs.
Yes, we provide customisation as per your requirements. To learn more, feel free to contact us on sales@6wresearch.com
1 Executive Summary |
2 Introduction |
2.1 Key Highlights of the Report |
2.2 Report Description |
2.3 Market Scope & Segmentation |
2.4 Research Methodology |
2.5 Assumptions |
3 Algeria Digital Biomarkers Market Overview |
3.1 Algeria Country Macro Economic Indicators |
3.2 Algeria Digital Biomarkers Market Revenues & Volume, 2022 & 2032F |
3.3 Algeria Digital Biomarkers Market - Industry Life Cycle |
3.4 Algeria Digital Biomarkers Market - Porter's Five Forces |
3.5 Algeria Digital Biomarkers Market Revenues & Volume Share, By Type, 2022 & 2032F |
3.6 Algeria Digital Biomarkers Market Revenues & Volume Share, By Collection System Type, 2022 & 2032F |
3.7 Algeria Digital Biomarkers Market Revenues & Volume Share, By End-users, 2022 & 2032F |
3.8 Algeria Digital Biomarkers Market Revenues & Volume Share, By Technology, 2022 & 2032F |
4 Algeria Digital Biomarkers Market Dynamics |
4.1 Impact Analysis |
4.2 Market Drivers |
4.2.1 Government initiatives promoting electric vehicles |
4.2.2 Growing awareness about environmental sustainability |
4.2.3 Expansion of electric vehicle models available in the market |
4.3 Market Restraints |
4.3.1 High initial setup costs for charging infrastructure |
4.3.2 Limited public charging stations availability |
4.3.3 Technological limitations in charging speeds and battery capacity |
5 Algeria Digital Biomarkers Market Trends |
6 Algeria Digital Biomarkers Market, By Types |
6.1 Algeria Digital Biomarkers Market, By Type |
6.1.1 Overview and Analysis |
6.1.2 Algeria Digital Biomarkers Market Revenues & Volume, By Type, 2022-2032F |
6.1.3 Algeria Digital Biomarkers Market Revenues & Volume, By Wellness, 2022-2032F |
6.1.4 Algeria Digital Biomarkers Market Revenues & Volume, By Disease, 2022-2032F |
6.1.5 Algeria Digital Biomarkers Market Revenues & Volume, By Drugs, 2022-2032F |
6.2 Algeria Digital Biomarkers Market, By Collection System Type |
6.2.1 Overview and Analysis |
6.2.2 Algeria Digital Biomarkers Market Revenues & Volume, By Wearables, 2022-2032F |
6.2.3 Algeria Digital Biomarkers Market Revenues & Volume, By Biosensors, 2022-2032F |
6.2.4 Algeria Digital Biomarkers Market Revenues & Volume, By Mobile Apps, 2022-2032F |
6.2.5 Algeria Digital Biomarkers Market Revenues & Volume, By Devices and Platforms, 2022-2032F |
6.2.6 Algeria Digital Biomarkers Market Revenues & Volume, By Desktop Based Software, 2022-2032F |
6.3 Algeria Digital Biomarkers Market, By End-users |
6.3.1 Overview and Analysis |
6.3.2 Algeria Digital Biomarkers Market Revenues & Volume, By Pharmaceutical, 2022-2032F |
6.3.3 Algeria Digital Biomarkers Market Revenues & Volume, By Life Sciences, 2022-2032F |
6.3.4 Algeria Digital Biomarkers Market Revenues & Volume, By Medical Devices, 2022-2032F |
6.3.5 Algeria Digital Biomarkers Market Revenues & Volume, By App Vendors, 2022-2032F |
6.3.6 Algeria Digital Biomarkers Market Revenues & Volume, By Clinical Research Organizations, 2022-2032F |
6.4 Algeria Digital Biomarkers Market, By Technology |
6.4.1 Overview and Analysis |
6.4.2 Algeria Digital Biomarkers Market Revenues & Volume, By Cloud Computing, 2022-2032F |
6.4.3 Algeria Digital Biomarkers Market Revenues & Volume, By Artificial Intelligence and Machine Learning, 2022-2032F |
6.4.4 Algeria Digital Biomarkers Market Revenues & Volume, By Augmented Reality, 2022-2032F |
6.4.5 Algeria Digital Biomarkers Market Revenues & Volume, By Blockchain, 2022-2032F |
7 Algeria Digital Biomarkers Market Import-Export Trade Statistics |
7.1 Algeria Digital Biomarkers Market Export to Major Countries |
7.2 Algeria Digital Biomarkers Market Imports from Major Countries |
8 Algeria Digital Biomarkers Market Key Performance Indicators |
8.1 Average utilization rate of charging stations |
8.2 Percentage increase in the number of electric vehicles on the road |
8.3 Average time taken for a full charge |
8.4 Number of new charging stations installed |
8.5 Customer satisfaction ratings for charging infrastructure services |
9 Algeria Digital Biomarkers Market - Opportunity Assessment |
9.1 Algeria Digital Biomarkers Market Opportunity Assessment, By Type, 2022 & 2032F |
9.2 Algeria Digital Biomarkers Market Opportunity Assessment, By Collection System Type, 2022 & 2032F |
9.3 Algeria Digital Biomarkers Market Opportunity Assessment, By End-users, 2022 & 2032F |
9.4 Algeria Digital Biomarkers Market Opportunity Assessment, By Technology, 2022 & 2032F |
10 Algeria Digital Biomarkers Market - Competitive Landscape |
10.1 Algeria Digital Biomarkers Market Revenue Share, By Companies, 2025 |
10.2 Algeria Digital Biomarkers Market Competitive Benchmarking, By Operating and Technical Parameters |
11 Company Profiles |
12 Recommendations |
13 Disclaimer |
Global Go To Market Strategy - 2030
Export potential enables firms to identify high-growth global markets with greater confidence by combining advanced trade intelligence with a structured quantitative methodology. The framework analyzes emerging demand trends and country-level import patterns while integrating macroeconomic and trade datasets such as GDP and population forecasts, bilateral import–export flows, tariff structures, elasticity differentials between developed and developing economies, geographic distance, and import demand projections. Using weighted trade values from 2020–2024 as the base period to project country-to-country export potential for 2030, these inputs are operationalized through calculated drivers such as gravity model parameters, tariff impact factors, and projected GDP per-capita growth. Through an analysis of hidden potentials, demand hotspots, and market conditions that are most favorable to success, this method enables firms to focus on target countries, maximize returns, and global expansion with data, backed by accuracy.
By factoring in the projected importer demand gap that is currently unmet and could be potential opportunity, it identifies the potential for the Exporter (Country) among 190 countries, against the general trade analysis, which identifies the biggest importer or exporter.
To discover high-growth global markets and optimize your business strategy:
Click Here
Pricing
- Single User License$ 1,995
- Department License$ 2,400
- Site License$ 3,120
- Global License$ 3,795

Leadership Perspectives from Industry Events
Search
Thought Leadership and Analyst Meet


Our Clients
6WResearch In News
- India Air Conditioner Market Set for Strong Rebound in 2026 After Weather-Led Correction and GST-Driven Recovery: 6Wresearch
- ADAS in India: How Automatic Emergency Braking, Blind Spot Detection & Driver Monitoring are Transforming Road Safety
- Doha a strategic location for EV manufacturing hub: IPA Qatar
- Demand for luxury TVs surging in the GCC, says Samsung
- Empowering Growth: The Thriving Journey of Bangladesh’s Cable Industry
- Demand for luxury TVs surging in the GCC, says Samsung
Latest Reports
- Nicaragua RPG Gaming Market (2026-2032)
- New Zealand RPG Gaming Market (2026-2032)
- Netherlands RPG Gaming Market (2026-2032)
- Nauru RPG Gaming Market (2026-2032)
- Namibia RPG Gaming Market (2026-2032)
- Mozambique RPG Gaming Market (2026-2032)
- Montenegro RPG Gaming Market (2026-2032)
- Mongolia RPG Gaming Market (2026-2032)
- Monaco RPG Gaming Market (2026-2032)
- Micronesia RPG Gaming Market (2026-2032)
Industry Events and Analyst Meet

HIMTEX 2026

India Refining Summit 2026

India EV Show 2026

EV tech India Expo 2026

Auto Tech Asia 2026
Whitepaper
- Middle East & Africa Commercial Security Market Click here to view more.
- Middle East & Africa Fire Safety Systems & Equipment Market Click here to view more.
- GCC Drone Market Click here to view more.
- Middle East Lighting Fixture Market Click here to view more.
- GCC Physical & Perimeter Security Market Click here to view more.