Antigua and Barbuda Microspheres Market (2025-2031) | Industry, Revenue, Value, Forecast, Outlook, Analysis, Segmentation, Growth, Size, Trends, Share & Companies
Market Forecast By Type (Hollow, Solid), By Raw Material (Glass, Ceramic, Fly Ash, Polymer, Metallic), By Application (Construction Composites, Medical Technology, Cosmetics & Personal Care, Automotive, Oil & Gas) And Competitive Landscape
| Product Code: ETC5706077 | Publication Date: Nov 2023 | Updated Date: Oct 2025 | Product Type: Market Research Report | |
| Publisher: 6Wresearch | Author: Sumit Sagar | No. of Pages: 60 | No. of Figures: 30 | No. of Tables: 5 |
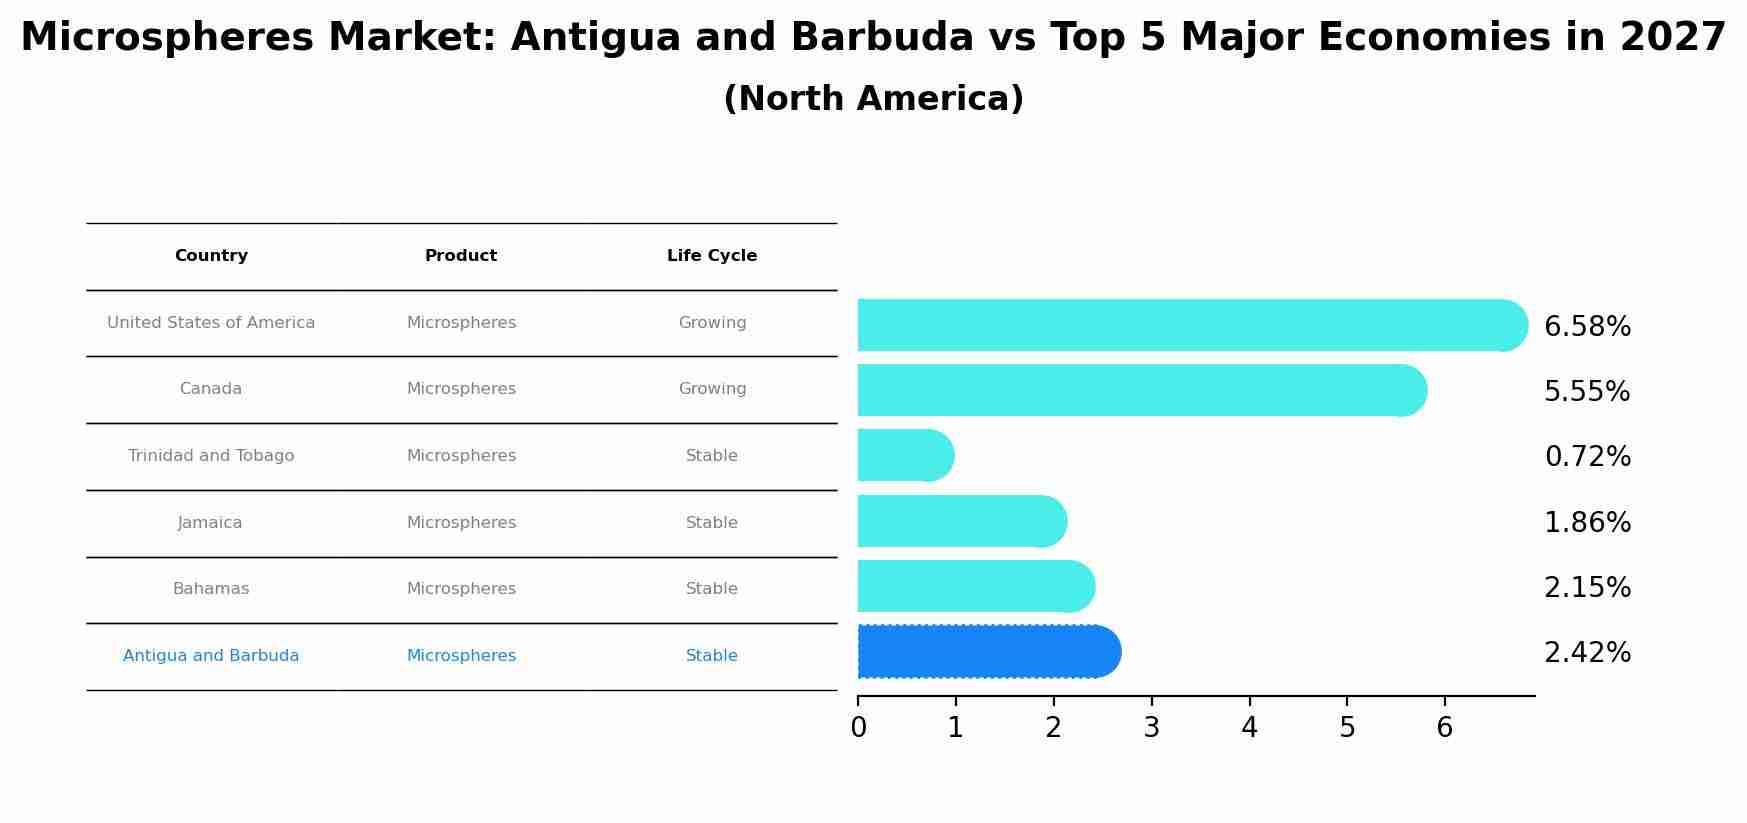
Microspheres Market: Antigua and Barbuda vs Top 5 Major Economies in 2027 (North America)
By 2027, Antigua and Barbuda's Microspheres market is forecasted to achieve a stable growth rate of 2.42%, with United States of America leading the North America region, followed by Canada, Trinidad and Tobago, Jamaica and Bahamas.
Antigua and Barbuda Microspheres Market Oveview
Microspheres in Antigua and Barbuda are used in various applications, including drug delivery, cosmetics, and materials science. This market leverages the unique properties of microspheres, such as their uniform size and controlled release capabilities.
Drivers of the market
The Microspheres Market is expanding with applications in healthcare, cosmetics, and construction industries, driven by their unique properties like lightweight and high strength.
Challenges of the market
Challenges in the microspheres market include product standardization, regulatory compliance, and variability in material properties, impacting market acceptance and application versatility in Antigua and Barbuda.
Government Policy of the market
Government policies for the microspheres market in Antigua and Barbuda aim to promote innovation in materials science and biomedical applications. They support research and development initiatives in biocompatible microsphere technologies for drug delivery and tissue engineering. These policies include funding for local startups and partnerships with international pharmaceutical companies to accelerate product development and market access.
Key Highlights of the Report:
- Antigua and Barbuda Microspheres Market Outlook
- Market Size of Antigua and Barbuda Microspheres Market, 2024
- Forecast of Antigua and Barbuda Microspheres Market, 2031
- Historical Data and Forecast of Antigua and Barbuda Microspheres Revenues & Volume for the Period 2021-2031
- Antigua and Barbuda Microspheres Market Trend Evolution
- Antigua and Barbuda Microspheres Market Drivers and Challenges
- Antigua and Barbuda Microspheres Price Trends
- Antigua and Barbuda Microspheres Porter`s Five Forces
- Antigua and Barbuda Microspheres Industry Life Cycle
- Historical Data and Forecast of Antigua and Barbuda Microspheres Market Revenues & Volume By Type for the Period 2021-2031
- Historical Data and Forecast of Antigua and Barbuda Microspheres Market Revenues & Volume By Hollow for the Period 2021-2031
- Historical Data and Forecast of Antigua and Barbuda Microspheres Market Revenues & Volume By Solid for the Period 2021-2031
- Historical Data and Forecast of Antigua and Barbuda Microspheres Market Revenues & Volume By Raw Material for the Period 2021-2031
- Historical Data and Forecast of Antigua and Barbuda Microspheres Market Revenues & Volume By Glass for the Period 2021-2031
- Historical Data and Forecast of Antigua and Barbuda Microspheres Market Revenues & Volume By Ceramic for the Period 2021-2031
- Historical Data and Forecast of Antigua and Barbuda Microspheres Market Revenues & Volume By Fly Ash for the Period 2021-2031
- Historical Data and Forecast of Antigua and Barbuda Microspheres Market Revenues & Volume By Polymer for the Period 2021-2031
- Historical Data and Forecast of Antigua and Barbuda Microspheres Market Revenues & Volume By Metallic for the Period 2021-2031
- Historical Data and Forecast of Antigua and Barbuda Microspheres Market Revenues & Volume By Application for the Period 2021-2031
- Historical Data and Forecast of Antigua and Barbuda Microspheres Market Revenues & Volume By Construction Composites for the Period 2021-2031
- Historical Data and Forecast of Antigua and Barbuda Microspheres Market Revenues & Volume By Medical Technology for the Period 2021-2031
- Historical Data and Forecast of Antigua and Barbuda Microspheres Market Revenues & Volume By Cosmetics & Personal Care for the Period 2021-2031
- Historical Data and Forecast of Antigua and Barbuda Microspheres Market Revenues & Volume By Automotive for the Period 2021-2031
- Historical Data and Forecast of Antigua and Barbuda Microspheres Market Revenues & Volume By Oil & Gas for the Period 2021-2031
- Antigua and Barbuda Microspheres Import Export Trade Statistics
- Market Opportunity Assessment By Type
- Market Opportunity Assessment By Raw Material
- Market Opportunity Assessment By Application
- Antigua and Barbuda Microspheres Top Companies Market Share
- Antigua and Barbuda Microspheres Competitive Benchmarking By Technical and Operational Parameters
- Antigua and Barbuda Microspheres Company Profiles
- Antigua and Barbuda Microspheres Key Strategic Recommendations
Frequently Asked Questions About the Market Study (FAQs):
6Wresearch actively monitors the Antigua and Barbuda Microspheres Market and publishes its comprehensive annual report, highlighting emerging trends, growth drivers, revenue analysis, and forecast outlook. Our insights help businesses to make data-backed strategic decisions with ongoing market dynamics. Our analysts track relevent industries related to the Antigua and Barbuda Microspheres Market, allowing our clients with actionable intelligence and reliable forecasts tailored to emerging regional needs.
Yes, we provide customisation as per your requirements. To learn more, feel free to contact us on sales@6wresearch.com
1 Executive Summary |
2 Introduction |
2.1 Key Highlights of the Report |
2.2 Report Description |
2.3 Market Scope & Segmentation |
2.4 Research Methodology |
2.5 Assumptions |
3 Antigua and Barbuda Microspheres Market Overview |
3.1 Antigua and Barbuda Country Macro Economic Indicators |
3.2 Antigua and Barbuda Microspheres Market Revenues & Volume, 2021 & 2031F |
3.3 Antigua and Barbuda Microspheres Market - Industry Life Cycle |
3.4 Antigua and Barbuda Microspheres Market - Porter's Five Forces |
3.5 Antigua and Barbuda Microspheres Market Revenues & Volume Share, By Type, 2021 & 2031F |
3.6 Antigua and Barbuda Microspheres Market Revenues & Volume Share, By Raw Material, 2021 & 2031F |
3.7 Antigua and Barbuda Microspheres Market Revenues & Volume Share, By Application, 2021 & 2031F |
4 Antigua and Barbuda Microspheres Market Dynamics |
4.1 Impact Analysis |
4.2 Market Drivers |
4.2.1 Increasing demand for lightweight materials in various industries |
4.2.2 Growing focus on sustainable and eco-friendly products |
4.2.3 Rise in research and development activities for advanced materials |
4.3 Market Restraints |
4.3.1 High production costs associated with microspheres manufacturing |
4.3.2 Limited awareness and adoption of microspheres in Antigua and Barbuda |
4.3.3 Lack of skilled labor for manufacturing and handling microspheres |
5 Antigua and Barbuda Microspheres Market Trends |
6 Antigua and Barbuda Microspheres Market Segmentations |
6.1 Antigua and Barbuda Microspheres Market, By Type |
6.1.1 Overview and Analysis |
6.1.2 Antigua and Barbuda Microspheres Market Revenues & Volume, By Hollow, 2021-2031F |
6.1.3 Antigua and Barbuda Microspheres Market Revenues & Volume, By Solid, 2021-2031F |
6.2 Antigua and Barbuda Microspheres Market, By Raw Material |
6.2.1 Overview and Analysis |
6.2.2 Antigua and Barbuda Microspheres Market Revenues & Volume, By Glass, 2021-2031F |
6.2.3 Antigua and Barbuda Microspheres Market Revenues & Volume, By Ceramic, 2021-2031F |
6.2.4 Antigua and Barbuda Microspheres Market Revenues & Volume, By Fly Ash, 2021-2031F |
6.2.5 Antigua and Barbuda Microspheres Market Revenues & Volume, By Polymer, 2021-2031F |
6.2.6 Antigua and Barbuda Microspheres Market Revenues & Volume, By Metallic, 2021-2031F |
6.3 Antigua and Barbuda Microspheres Market, By Application |
6.3.1 Overview and Analysis |
6.3.2 Antigua and Barbuda Microspheres Market Revenues & Volume, By Construction Composites, 2021-2031F |
6.3.3 Antigua and Barbuda Microspheres Market Revenues & Volume, By Medical Technology, 2021-2031F |
6.3.4 Antigua and Barbuda Microspheres Market Revenues & Volume, By Cosmetics & Personal Care, 2021-2031F |
6.3.5 Antigua and Barbuda Microspheres Market Revenues & Volume, By Automotive, 2021-2031F |
6.3.6 Antigua and Barbuda Microspheres Market Revenues & Volume, By Oil & Gas, 2021-2031F |
7 Antigua and Barbuda Microspheres Market Import-Export Trade Statistics |
7.1 Antigua and Barbuda Microspheres Market Export to Major Countries |
7.2 Antigua and Barbuda Microspheres Market Imports from Major Countries |
8 Antigua and Barbuda Microspheres Market Key Performance Indicators |
8.1 Research and development investment in microspheres technology |
8.2 Number of patents filed for microspheres innovations |
8.3 Percentage increase in the use of microspheres in new applications |
9 Antigua and Barbuda Microspheres Market - Opportunity Assessment |
9.1 Antigua and Barbuda Microspheres Market Opportunity Assessment, By Type, 2021 & 2031F |
9.2 Antigua and Barbuda Microspheres Market Opportunity Assessment, By Raw Material, 2021 & 2031F |
9.3 Antigua and Barbuda Microspheres Market Opportunity Assessment, By Application, 2021 & 2031F |
10 Antigua and Barbuda Microspheres Market - Competitive Landscape |
10.1 Antigua and Barbuda Microspheres Market Revenue Share, By Companies, 2024 |
10.2 Antigua and Barbuda Microspheres Market Competitive Benchmarking, By Operating and Technical Parameters |
11 Company Profiles |
12 Recommendations | 13 Disclaimer |
Export potential assessment - trade Analytics for 2030
Export potential enables firms to identify high-growth global markets with greater confidence by combining advanced trade intelligence with a structured quantitative methodology. The framework analyzes emerging demand trends and country-level import patterns while integrating macroeconomic and trade datasets such as GDP and population forecasts, bilateral import–export flows, tariff structures, elasticity differentials between developed and developing economies, geographic distance, and import demand projections. Using weighted trade values from 2020–2024 as the base period to project country-to-country export potential for 2030, these inputs are operationalized through calculated drivers such as gravity model parameters, tariff impact factors, and projected GDP per-capita growth. Through an analysis of hidden potentials, demand hotspots, and market conditions that are most favorable to success, this method enables firms to focus on target countries, maximize returns, and global expansion with data, backed by accuracy.
By factoring in the projected importer demand gap that is currently unmet and could be potential opportunity, it identifies the potential for the Exporter (Country) among 190 countries, against the general trade analysis, which identifies the biggest importer or exporter.
To discover high-growth global markets and optimize your business strategy:
Click Here
Pricing
- Single User License$ 1,995
- Department License$ 2,400
- Site License$ 3,120
- Global License$ 3,795

Search
Thought Leadership and Analyst Meet


Our Clients
Latest Reports
- Philippines Polyhydroxybutyrate-co-Hydroxyvalerate Market (2026-2032) | Trends, Insights, Challenges, Restraints, Competition, Size, Value, Forecast, Pricing, Share, Outlook, Revenue, Investment Opportunities, Strategy, Drivers, Demand, Growth, segmentation, Analysis, Companies
- Peru Polyhydroxybutyrate-co-Hydroxyvalerate Market (2026-2032) | Growth, Demand, Challenges, Share, Trends, Analysis, Pricing, Investment Opportunities, Drivers, Value, Forecast, Competition, Size, Companies, Insights, Outlook, Restraints, segmentation, Revenue, Strategy
- Pakistan Polyhydroxybutyrate-co-Hydroxyvalerate Market (2026-2032) | Restraints, segmentation, Pricing, Forecast, Share, Strategy, Competition, Trends, Insights, Drivers, Challenges, Growth, Revenue, Outlook, Value, Investment Opportunities, Companies, Size, Analysis, Demand
- Oman Polyhydroxybutyrate-co-Hydroxyvalerate Market (2026-2032) | Drivers, segmentation, Insights, Competition, Pricing, Outlook, Size, Revenue, Challenges, Forecast, Analysis, Growth, Value, Share, Trends, Investment Opportunities, Strategy, Restraints, Companies, Demand
- Nigeria Polyhydroxybutyrate-co-Hydroxyvalerate Market (2026-2032) | Value, Investment Opportunities, Analysis, Revenue, Restraints, Pricing, Outlook, Competition, Demand, Growth, Forecast, Companies, Trends, Challenges, segmentation, Drivers, Insights, Share, Size, Strategy
- Nepal Polyhydroxybutyrate-co-Hydroxyvalerate Market (2026-2032) | Insights, Analysis, Drivers, Share, Revenue, Demand, segmentation, Investment Opportunities, Competition, Forecast, Growth, Pricing, Companies, Strategy, Trends, Restraints, Challenges, Outlook, Size, Value
- Myanmar Polyhydroxybutyrate-co-Hydroxyvalerate Market (2026-2032) | Outlook, Revenue, Strategy, Restraints, Drivers, segmentation, Share, Forecast, Competition, Insights, Growth, Pricing, Size, Demand, Value, Companies, Trends, Challenges, Investment Opportunities, Analysis
- Morocco Polyhydroxybutyrate-co-Hydroxyvalerate Market (2026-2032) | Outlook, Investment Opportunities, Restraints, Strategy, Forecast, Challenges, Drivers, Growth, Companies, segmentation, Trends, Size, Competition, Revenue, Demand, Insights, Share, Analysis, Value, Pricing
- Mexico Polyhydroxybutyrate-co-Hydroxyvalerate Market (2026-2032) | Size, Drivers, Outlook, Share, Strategy, Growth, Pricing, Challenges, Companies, Demand, Value, Investment Opportunities, Restraints, Trends, Forecast, segmentation, Analysis, Insights, Competition, Revenue
- Malaysia Polyhydroxybutyrate-co-Hydroxyvalerate Market (2026-2032) | Share, segmentation, Size, Companies, Analysis, Insights, Forecast, Value, Revenue, Drivers, Restraints, Challenges, Investment Opportunities, Trends, Competition, Strategy, Demand, Growth, Outlook, Pricing
Industry Events and Analyst Meet

HIMTEX 2026

India Refining Summit 2026

India EV Show 2026

EV tech India Expo 2026

Auto Tech Asia 2026
Whitepaper
- Middle East & Africa Commercial Security Market Click here to view more.
- Middle East & Africa Fire Safety Systems & Equipment Market Click here to view more.
- GCC Drone Market Click here to view more.
- Middle East Lighting Fixture Market Click here to view more.
- GCC Physical & Perimeter Security Market Click here to view more.
6WResearch In News
- Doha a strategic location for EV manufacturing hub: IPA Qatar
- Demand for luxury TVs surging in the GCC, says Samsung
- Empowering Growth: The Thriving Journey of Bangladesh’s Cable Industry
- Demand for luxury TVs surging in the GCC, says Samsung
- Video call with a traditional healer? Once unthinkable, it’s now common in South Africa
- Intelligent Buildings To Smooth GCC’s Path To Net Zero