Asia Pacific Microspheres Market (2026-2032) | Companies, Analysis, Industry, Revenue, Trends, Value, Size, Growth, Forecast & Share
Market Forecast by Countries (China, India, Japan, Australia, Indonesia, Philippines, Thailand, Malaysia, Rest of Asia), By Type (Hollow, Solid), By Raw Material (Glass, Ceramic, Fly Ash, Polymer, Metallic), By Application (Construction Composites, Medical Technology, Cosmetics & Personal Care, Automotive, Oil & Gas) And Competitive Landscape
| Product Code: ETC4607609 | Publication Date: Jul 2023 | Updated Date: Jul 2026 | Product Type: Report | |
| Publisher: 6Wresearch | Author: Ravi Bhandari | No. of Pages: 200 | No. of Figures: 90 | No. of Tables: 30 |
Asia Pacific Microspheres Market Size & Growth Rate
According to 6Wresearch internal database and industry insights, the Asia Pacific Microspheres Market was valued at USD 1.4 billion in 2025 and is projected to reach nearly USD 2.7 billion by 2032, exhibiting a compound annual growth rate (CAGR) of 9.7% during the forecast period (2026-2032).
Asia Pacific Microspheres Market Year-wise Growth Rate and Key Drivers
This graph illustrates the annual growth rates of the Asia Pacific Microspheres Market from 2022 to 2032, highlighting stable industrial expansion, infrastructure-driven demand, and increasing adoption of precision finishing solutions.
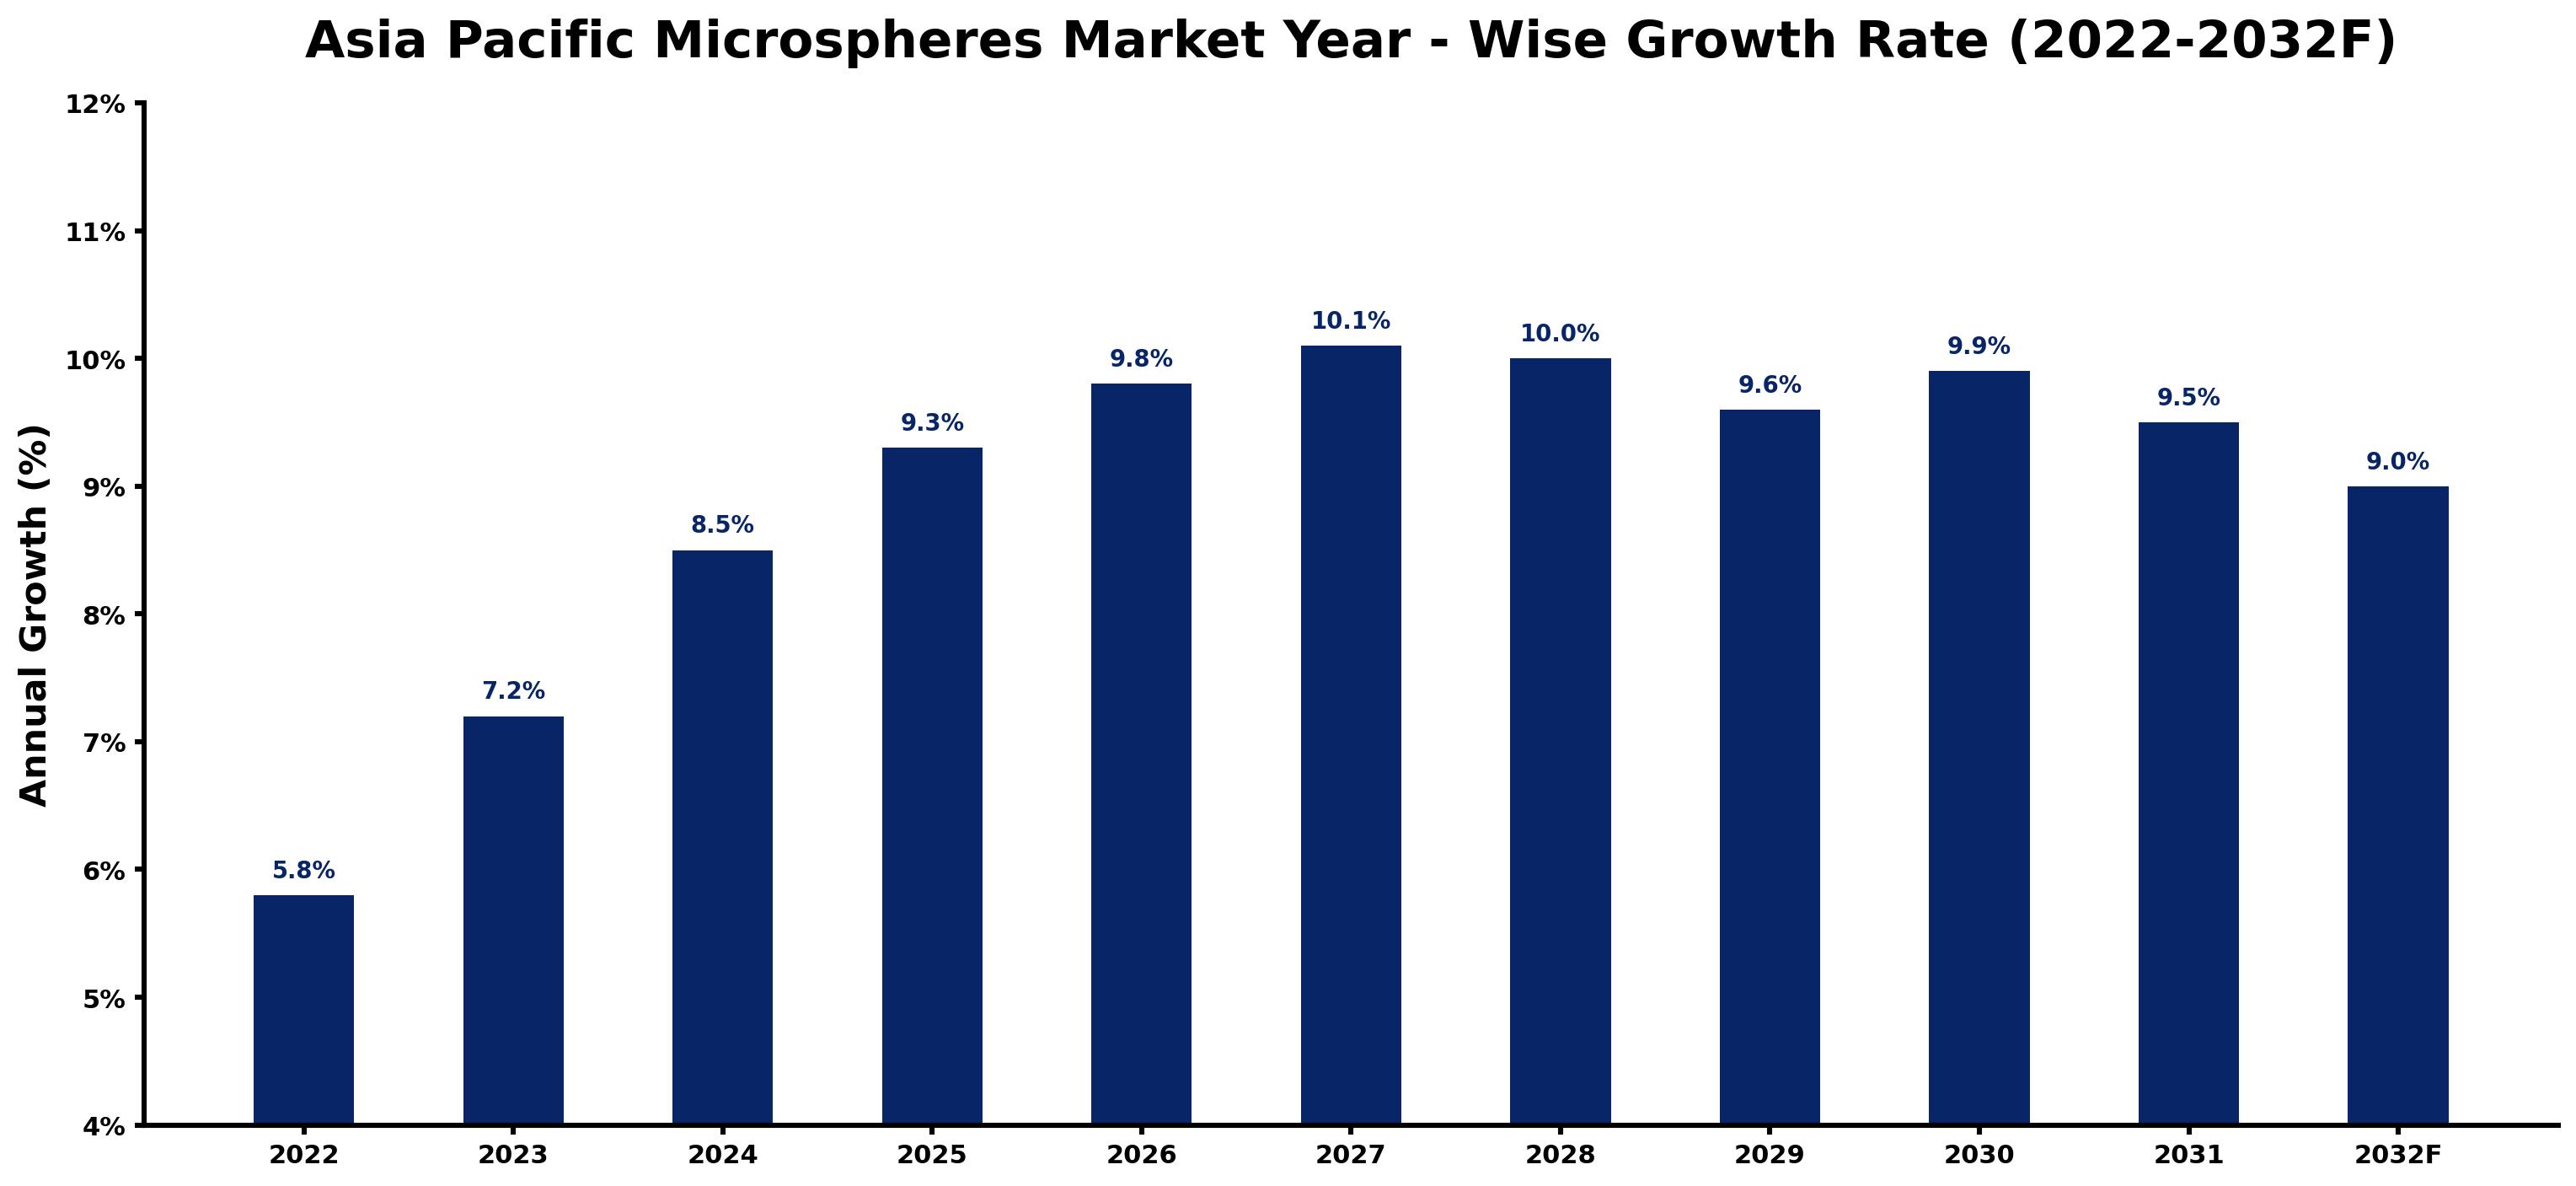
The following table summarizes the historical and forecasted growth rates of the Asia Pacific Microspheres Market, along with the rationale behind each year’s performance.
| Year | Estimated Growth (%) | Market Rationale |
| 2022 | 5.8% | Recovery in manufacturing, construction, and automotive sectors following pandemic disruptions supported modest demand for microspheres. |
| 2023 | 7.2% | Rising utilization of lightweight fillers in paints, coatings, plastics, and composites, along with increasing industrial production across Asia Pacific, accelerated market growth. |
| 2024 | 8.5% | Expanding healthcare, cosmetics, and specialty chemical industries, coupled with greater adoption of polymer and glass microspheres, strengthened market expansion. |
| 2025 | 9.3% | Increasing investments in infrastructure, electronics, and advanced materials, along with growing demand for lightweight and high-performance products, boosted market growth. |
| 2026 | 9.8% | Strong adoption of microspheres in automotive lightweighting, oil & gas drilling, and medical technologies supported growth in line with the forecast period. |
| 2027 | 10.1% | Rising demand for engineered materials, increasing R&D activities, and expanding applications in aerospace and construction drove above-average market expansion. |
| 2028 | 10.0% | Continued industrialization and wider penetration of expandable polymer microspheres in packaging, coatings, and consumer goods sustained robust demand. |
| 2029 | 9.6% | Market growth moderated slightly due to raw material price volatility and gradual maturity in some end-use industries while maintaining healthy expansion. |
| 2030 | 9.9% | Growth was supported by increasing demand for sustainable lightweight materials, advanced composites, and medical diagnostic applications across the region. |
| 2031 | 9.5% | Stable expansion continued as innovation in functional microspheres offset slower growth in mature industrial segments. |
| 2032 | 9.0% | The market experienced slight moderation as penetration levels increased, though ongoing technological advancements and expanding high-value applications continued to support long-term growth. |
Topics Covered in the Asia Pacific Microspheres Market Report
The Asia Pacific Microspheres Market report thoroughly covers the market by countries, types, raw materials, and applications. The market report provides an unbiased and detailed analysis of ongoing market trends, opportunities/high growth areas, and market drivers, which would help stakeholders devise and align their market strategies according to the current and future market dynamics.
Asia Pacific Microspheres Market Highlights
| Report Name | Asia Pacific Microspheres Market |
| Forecast Period | 2026-2032 |
| Market Size | USD 2.7 billion by 2032 |
| CAGR | 9.7% |
| Growing Sector | Construction Composites |
Asia Pacific Microspheres Market Synopsis
The Asia Pacific Microspheres Market is expected to have robust growth. The market is driven by increasing demand for lightweight, durable materials in various industries, including construction, medical technology, automotive, and oil & gas. Growing urbanization, increasing infrastructure development, and rising awareness about environmental sustainability are propelling the demand for microspheres in applications that require superior performance. Also, the adoption of microspheres in innovative composite materials is boosting market growth. Government policies promoting sustainable development and eco-friendly materials are further contributing to the expansion of the market.
Evaluation of Growth Drivers in the Asia Pacific Microspheres Market
Below mentioned are some growth drivers and their impact on market dynamics:
| Drivers | Primary Segments Affected | Why It Matters |
| Sustainable Construction & Lightweight Materials | Application (Construction Composites) | Reduces weight and enhances the strength of building materials. |
| Technological Advancements in Medical Devices | Application (Medical Technology) | Enhances precision in medical applications, improving safety and performance. |
| Increasing Automotive Production | Application (Automotive) | Boosts demand for lightweight and durable materials for vehicles. |
| Rising Demand in Oil & Gas Sector | Application (Oil & Gas) | Microspheres enhance the performance and safety of drilling fluids. |
| Government Support for Green Materials | All Segments | Promotes the use of eco-friendly, energy-efficient materials. |
The Asia Pacific Microspheres Market is expected to grow significantly, registering a CAGR of 9.7% during the forecast period of 2026-2032. Key factors that drive the Asia Pacific microspheres market include increasing demand from the automotive, construction, and medical technology sectors. High-strength and lightweight microspheres lower energy usage, improve material performance, enhance thermal insulation, accelerating market adoption. Market development is propelled by the rising applications in personal care and cosmetics for better coverage benefits and texture. Market expansion is further increased by government-backed programs encouraging innovative materials in infrastructure ventures. The growing consciousness of efficient and sustainable manufacturing solutions also plays a important role in expansion.
Evaluation of Restraints in the Asia Pacific Microspheres Market
Below mentioned are some major restraints and their influence on market dynamics:
| Restraints | Primary Segments Affected | What This Means |
| High Production Costs | All Segments | Increases the overall cost of microsphere-based products. |
| Supply Chain Issues | All Segments | Affects the timely availability of raw materials and finished products. |
| Regulatory Compliance | Raw Material (Glass, Ceramic, etc.) | Raises costs for certification and limits material variation. |
| Competition from Low-Cost Imports | All Segments | Places pressure on local manufacturers to reduce prices, affecting profitability. |
Asia Pacific Microspheres Market Challenges
The Asia Pacific Microspheres Market comes across various challenges, such as strict environmental standards associated with disposal and production. Some other major obstacles include uncertainty in prices of raw materials and high production costs. In addition, market entry gets obstructed in developing markets due to limited skilled operators for specialized microsphere uses. Another reason for restrained market penetration is lack of awareness of innovative applications. Local producers trying to develop distribution networks face hurdles like logistics costs and supply chain difficulties for global trade.
Asia Pacific Microspheres Market Trends
Some major trends contributing to the development of the Asia Pacific Microspheres Market Growth are:
- Growing Use in Lightweight Composites: With increasing demand for lightweight, high-strength materials in construction, automotive, and aerospace industries.
- Medical Advancements: The use of microspheres in drug delivery systems, diagnostics, and minimally invasive surgeries is expanding.
- Sustainability and Eco-friendly Applications: Rising awareness around sustainability is leading to the increased use of glass and ceramic microspheres in eco-friendly products.
Investment Opportunities in the Asia Pacific Microspheres Market
Here are some investment opportunities in the Asia Pacific Microspheres Industry:
- Sustainable and Eco-friendly Products: Invest in developing microspheres using recycled or renewable raw materials to meet the growing demand for green building materials.
- Medical Technology Applications: Target investments in microspheres for drug delivery and diagnostic systems, which are gaining traction in the healthcare industry.
- Automotive Lightweight Solutions: Invest in R&D to develop advanced microsphere-based materials for use in automotive and aerospace applications.
- Expansion into Emerging Markets: Focus on penetrating emerging markets like India, Indonesia, and the Philippines, where infrastructure development is on the rise.
Top 5 Leading Players in the Asia Pacific Microspheres Market
Here are some top companies contributing to the Asia Pacific Microspheres Market Share:
1. 3M Company
| Company Name | 3M Company |
|---|---|
| Headquarters | St. Paul, Minnesota, USA |
| Established Year | 1902 |
| Official Website | Click Here |
3M offers a wide range of microspheres used in automotive, construction, medical, and aerospace applications. The company focuses on developing high-performance microsphere products tailored to specific industry needs.
2. AkzoNobel N.V.
| Company Name | AkzoNobel N.V. |
|---|---|
| Headquarters | Amsterdam, Netherlands |
| Established Year | 1994 |
| Official Website | Click Here |
AkzoNobel is a global leader in performance materials, including microspheres, for use in automotive coatings, construction, and industrial applications. The company emphasizes sustainable solutions and energy-efficient products.
3. Cospheric LLC
| Company Name | Cospheric LLC |
|---|---|
| Headquarters | Santa Barbara, California, USA |
| Established Year | 2002 |
| Official Website | Click Here |
Cospheric specializes in the manufacturing of hollow microspheres for use in industrial, medical, and defense applications. They are known for their innovation and production capabilities in lightweight materials.
4. Momentive Performance Materials Inc.
| Company Name | Momentive Performance Materials Inc. |
|---|---|
| Headquarters | Waterford, New York, USA |
| Established Year | 2006 |
| Official Website | Click Here |
Momentive offers a range of microsphere products that cater to industries such as oil & gas, construction, automotive, and medical technologies, with a strong focus on high-performance solutions.
5. Sigmund Lindner GmbH
| Company Name | Sigmund Lindner GmbH |
|---|---|
| Headquarters | Warmensteinach, Germany |
| Established Year | 1854 |
| Official Website | Click Here |
Sigmund Lindner specializes in the production of glass microspheres for various industries, including construction, automotive, and cosmetics. The company is known for its technical expertise and commitment to quality.
Government Regulations Introduced in the Asia Pacific Microspheres Market
Governments in the Asia Pacific region are implementing regulations to improve the safety of industrial materials and chemicals. China’s Ministry of Industry and Information Technology supports advanced material development initiatives, including microspheres for construction and automotive applications. India’s Department of Science and Technology allocates funds for research on high-performance composites. Environmental and safety regulations in Japan and Australia ensure proper manufacturing, handling, and disposal of microspheres, fostering consumer and industrial confidence.
Future Insights of the Asia Pacific Microspheres Market
The Asia Pacific microspheres market is expected to grow steadily, driven by technological advancements and rising industrial adoption. Growth will be fueled by demand for polymer microspheres in cosmetics and hollow microspheres in lightweight composites. Increasing demand for bio-compatible variants in medical technologies will also support expansion. Additionally, the adoption of smart microsphere technologies in oil & gas and automotive industries is projected to generate long-term revenue. Government incentives for advanced material R&D are expected to further strengthen local market shares.
Market Segmentation Analysis
The report offers a comprehensive study of the subsequent market segments and their leading categories.
China to Dominate the Market – By Country
According to Guneet Kaur, Senior Research Analyst, 6Wresearch, China leads the Asia Pacific Microspheres Market due to strong industrial growth, an expanding manufacturing base, and increasing demand for microspheres across construction, automotive, and oil & gas sectors.
Hollow Microspheres to Dominate the Market – By Type
Hollow microspheres are expected to dominate the market because of their lightweight nature and excellent insulating properties. They are widely used in construction composites and oil & gas applications, offering cost-effective thermal insulation and reducing product weight.
Glass Microspheres to Dominate the Market – By Raw Material
Glass microspheres are experiencing rising demand due to their strength, durability, and resistance to temperature extremes. They are used extensively in construction composites, automotive applications, and the oil & gas sector, providing high performance and sustainability.
Construction Composites to Dominate the Market – By Application
The construction composites segment is projected to dominate as demand grows for lightweight, durable, and high-strength materials. Microspheres enhance composite performance, offering energy efficiency, cost savings, and improved durability in construction applications.
Key Attractiveness of the Report
- 10 Years Market Numbers
- Historical Data Starting from 2022 to 2025
- Base Year: 2025
- Forecast Data until 2032
- Key Performance Indicators Impacting the Market
- Major Upcoming Developments and Projects
Key Highlights of the Report:
- Asia Pacific Microspheres Market Outlook
- Market Size of Asia Pacific Microspheres Market, 2025
- Forecast of Asia Pacific Microspheres Market, 2032
- Historical Data and Forecast of Asia Pacific Microspheres Revenues & Volume for the Period 2022 - 2032
- Asia Pacific Microspheres Market Trend Evolution
- Asia Pacific Microspheres Market Drivers and Challenges
- Asia Pacific Microspheres Price Trends
- Asia Pacific Microspheres Porter's Five Forces
- Asia Pacific Microspheres Industry Life Cycle
- Historical Data and Forecast of Asia Pacific Microspheres Market Revenues & Volume By Type for the Period 2022 - 2032
- Historical Data and Forecast of Asia Pacific Microspheres Market Revenues & Volume By Hollow for the Period 2022 - 2032
- Historical Data and Forecast of Asia Pacific Microspheres Market Revenues & Volume By Solid for the Period 2022 - 2032
- Historical Data and Forecast of China Microspheres Market Revenues & Volume By Type for the Period 2022 - 2032
- Historical Data and Forecast of China Microspheres Market Revenues & Volume By Hollow for the Period 2022 - 2032
- Historical Data and Forecast of China Microspheres Market Revenues & Volume By Solid for the Period 2022 - 2032
- Historical Data and Forecast of India Microspheres Market Revenues & Volume By Type for the Period 2022 - 2032
- Historical Data and Forecast of India Microspheres Market Revenues & Volume By Hollow for the Period 2022 - 2032
- Historical Data and Forecast of India Microspheres Market Revenues & Volume By Solid for the Period 2022 - 2032
- Historical Data and Forecast of Japan Microspheres Market Revenues & Volume By Type for the Period 2022 - 2032
- Historical Data and Forecast of Japan Microspheres Market Revenues & Volume By Hollow for the Period 2022 - 2032
- Historical Data and Forecast of Japan Microspheres Market Revenues & Volume By Solid for the Period 2022 - 2032
- Historical Data and Forecast of Australia Microspheres Market Revenues & Volume By Type for the Period 2022 - 2032
- Historical Data and Forecast of Australia Microspheres Market Revenues & Volume By Hollow for the Period 2022 - 2032
- Historical Data and Forecast of Australia Microspheres Market Revenues & Volume By Solid for the Period 2022 - 2032
- Historical Data and Forecast of Indonesia Microspheres Market Revenues & Volume By Type for the Period 2022 - 2032
- Historical Data and Forecast of Indonesia Microspheres Market Revenues & Volume By Hollow for the Period 2022 - 2032
- Historical Data and Forecast of Indonesia Microspheres Market Revenues & Volume By Solid for the Period 2022 - 2032
- Historical Data and Forecast of Philippines Microspheres Market Revenues & Volume By Type for the Period 2022 - 2032
- Historical Data and Forecast of Philippines Microspheres Market Revenues & Volume By Hollow for the Period 2022 - 2032
- Historical Data and Forecast of Philippines Microspheres Market Revenues & Volume By Solid for the Period 2022 - 2032
- Historical Data and Forecast of Malaysia Microspheres Market Revenues & Volume By Type for the Period 2022 - 2032
- Historical Data and Forecast of Malaysia Microspheres Market Revenues & Volume By Hollow for the Period 2022 - 2032
- Historical Data and Forecast of Malaysia Microspheres Market Revenues & Volume By Solid for the Period 2022 - 2032
- Historical Data and Forecast of Rest of Asia Microspheres Market Revenues & Volume By Type for the Period 2022 - 2032
- Historical Data and Forecast of Rest of Asia Microspheres Market Revenues & Volume By Hollow for the Period 2022 - 2032
- Historical Data and Forecast of Rest of Asia Microspheres Market Revenues & Volume By Solid for the Period 2022 - 2032
- Historical Data and Forecast of Asia Pacific Microspheres Market Revenues & Volume By Raw Material for the Period 2022 - 2032
- Historical Data and Forecast of Asia Pacific Microspheres Market Revenues & Volume By Glass for the Period 2022 - 2032
- Historical Data and Forecast of Asia Pacific Microspheres Market Revenues & Volume By Ceramic for the Period 2022 - 2032
- Historical Data and Forecast of Asia Pacific Microspheres Market Revenues & Volume By Fly Ash for the Period 2022 - 2032
- Historical Data and Forecast of Asia Pacific Microspheres Market Revenues & Volume By Polymer for the Period 2022 - 2032
- Historical Data and Forecast of Asia Pacific Microspheres Market Revenues & Volume By Metallic for the Period 2022 - 2032
- Historical Data and Forecast of China Microspheres Market Revenues & Volume By Raw Material for the Period 2022 - 2032
- Historical Data and Forecast of China Microspheres Market Revenues & Volume By Glass for the Period 2022 - 2032
- Historical Data and Forecast of China Microspheres Market Revenues & Volume By Ceramic for the Period 2022 - 2032
- Historical Data and Forecast of China Microspheres Market Revenues & Volume By Fly Ash for the Period 2022 - 2032
- Historical Data and Forecast of China Microspheres Market Revenues & Volume By Polymer for the Period 2022 - 2032
- Historical Data and Forecast of China Microspheres Market Revenues & Volume By Metallic for the Period 2022 - 2032
- Historical Data and Forecast of India Microspheres Market Revenues & Volume By Raw Material for the Period 2022 - 2032
- Historical Data and Forecast of India Microspheres Market Revenues & Volume By Glass for the Period 2022 - 2032
- Historical Data and Forecast of India Microspheres Market Revenues & Volume By Ceramic for the Period 2022 - 2032
- Historical Data and Forecast of India Microspheres Market Revenues & Volume By Fly Ash for the Period 2022 - 2032
- Historical Data and Forecast of India Microspheres Market Revenues & Volume By Polymer for the Period 2022 - 2032
- Historical Data and Forecast of India Microspheres Market Revenues & Volume By Metallic for the Period 2022 - 2032
- Historical Data and Forecast of Japan Microspheres Market Revenues & Volume By Raw Material for the Period 2022 - 2032
- Historical Data and Forecast of Japan Microspheres Market Revenues & Volume By Glass for the Period 2022 - 2032
- Historical Data and Forecast of Japan Microspheres Market Revenues & Volume By Ceramic for the Period 2022 - 2032
- Historical Data and Forecast of Japan Microspheres Market Revenues & Volume By Fly Ash for the Period 2022 - 2032
- Historical Data and Forecast of Japan Microspheres Market Revenues & Volume By Polymer for the Period 2022 - 2032
- Historical Data and Forecast of Japan Microspheres Market Revenues & Volume By Metallic for the Period 2022 - 2032
- Historical Data and Forecast of Australia Microspheres Market Revenues & Volume By Raw Material for the Period 2022 - 2032
- Historical Data and Forecast of Australia Microspheres Market Revenues & Volume By Glass for the Period 2022 - 2032
- Historical Data and Forecast of Australia Microspheres Market Revenues & Volume By Ceramic for the Period 2022 - 2032
- Historical Data and Forecast of Australia Microspheres Market Revenues & Volume By Fly Ash for the Period 2022 - 2032
- Historical Data and Forecast of Australia Microspheres Market Revenues & Volume By Polymer for the Period 2022 - 2032
- Historical Data and Forecast of Australia Microspheres Market Revenues & Volume By Metallic for the Period 2022 - 2032
- Historical Data and Forecast of Indonesia Microspheres Market Revenues & Volume By Raw Material for the Period 2022 - 2032
- Historical Data and Forecast of Indonesia Microspheres Market Revenues & Volume By Glass for the Period 2022 - 2032
- Historical Data and Forecast of Indonesia Microspheres Market Revenues & Volume By Ceramic for the Period 2022 - 2032
- Historical Data and Forecast of Indonesia Microspheres Market Revenues & Volume By Fly Ash for the Period 2022 - 2032
- Historical Data and Forecast of Indonesia Microspheres Market Revenues & Volume By Polymer for the Period 2022 - 2032
- Historical Data and Forecast of Indonesia Microspheres Market Revenues & Volume By Metallic for the Period 2022 - 2032
- Historical Data and Forecast of Philippines Microspheres Market Revenues & Volume By Raw Material for the Period 2022 - 2032
- Historical Data and Forecast of Philippines Microspheres Market Revenues & Volume By Glass for the Period 2022 - 2032
- Historical Data and Forecast of Philippines Microspheres Market Revenues & Volume By Ceramic for the Period 2022 - 2032
- Historical Data and Forecast of Philippines Microspheres Market Revenues & Volume By Fly Ash for the Period 2022 - 2032
- Historical Data and Forecast of Philippines Microspheres Market Revenues & Volume By Polymer for the Period 2022 - 2032
- Historical Data and Forecast of Philippines Microspheres Market Revenues & Volume By Metallic for the Period 2022 - 2032
- Historical Data and Forecast of Malaysia Microspheres Market Revenues & Volume By Raw Material for the Period 2022 - 2032
- Historical Data and Forecast of Malaysia Microspheres Market Revenues & Volume By Glass for the Period 2022 - 2032
- Historical Data and Forecast of Malaysia Microspheres Market Revenues & Volume By Ceramic for the Period 2022 - 2032
- Historical Data and Forecast of Malaysia Microspheres Market Revenues & Volume By Fly Ash for the Period 2022 - 2032
- Historical Data and Forecast of Malaysia Microspheres Market Revenues & Volume By Polymer for the Period 2022 - 2032
- Historical Data and Forecast of Malaysia Microspheres Market Revenues & Volume By Metallic for the Period 2022 - 2032
- Historical Data and Forecast of Rest of Asia Microspheres Market Revenues & Volume By Raw Material for the Period 2022 - 2032
- Historical Data and Forecast of Rest of Asia Microspheres Market Revenues & Volume By Glass for the Period 2022 - 2032
- Historical Data and Forecast of Rest of Asia Microspheres Market Revenues & Volume By Ceramic for the Period 2022 - 2032
- Historical Data and Forecast of Rest of Asia Microspheres Market Revenues & Volume By Fly Ash for the Period 2022 - 2032
- Historical Data and Forecast of Rest of Asia Microspheres Market Revenues & Volume By Polymer for the Period 2022 - 2032
- Historical Data and Forecast of Rest of Asia Microspheres Market Revenues & Volume By Metallic for the Period 2022 - 2032
- Historical Data and Forecast of Asia Pacific Microspheres Market Revenues & Volume By Application for the Period 2022 - 2032
- Historical Data and Forecast of Asia Pacific Microspheres Market Revenues & Volume By Construction Composites for the Period 2022 - 2032
- Historical Data and Forecast of Asia Pacific Microspheres Market Revenues & Volume By Medical Technology for the Period 2022 - 2032
- Historical Data and Forecast of Asia Pacific Microspheres Market Revenues & Volume By Cosmetics & Personal Care for the Period 2022 - 2032
- Historical Data and Forecast of Asia Pacific Microspheres Market Revenues & Volume By Automotive for the Period 2022 - 2032
- Historical Data and Forecast of Asia Pacific Microspheres Market Revenues & Volume By Oil & Gas for the Period 2022 - 2032
- Historical Data and Forecast of China Microspheres Market Revenues & Volume By Application for the Period 2022 - 2032
- Historical Data and Forecast of China Microspheres Market Revenues & Volume By Construction Composites for the Period 2022 - 2032
- Historical Data and Forecast of China Microspheres Market Revenues & Volume By Medical Technology for the Period 2022 - 2032
- Historical Data and Forecast of China Microspheres Market Revenues & Volume By Cosmetics & Personal Care for the Period 2022 - 2032
- Historical Data and Forecast of China Microspheres Market Revenues & Volume By Automotive for the Period 2022 - 2032
- Historical Data and Forecast of China Microspheres Market Revenues & Volume By Oil & Gas for the Period 2022 - 2032
- Historical Data and Forecast of India Microspheres Market Revenues & Volume By Application for the Period 2022 - 2032
- Historical Data and Forecast of India Microspheres Market Revenues & Volume By Construction Composites for the Period 2022 - 2032
- Historical Data and Forecast of India Microspheres Market Revenues & Volume By Medical Technology for the Period 2022 - 2032
- Historical Data and Forecast of India Microspheres Market Revenues & Volume By Cosmetics & Personal Care for the Period 2022 - 2032
- Historical Data and Forecast of India Microspheres Market Revenues & Volume By Automotive for the Period 2022 - 2032
- Historical Data and Forecast of India Microspheres Market Revenues & Volume By Oil & Gas for the Period 2022 - 2032
- Historical Data and Forecast of Japan Microspheres Market Revenues & Volume By Application for the Period 2022 - 2032
- Historical Data and Forecast of Japan Microspheres Market Revenues & Volume By Construction Composites for the Period 2022 - 2032
- Historical Data and Forecast of Japan Microspheres Market Revenues & Volume By Medical Technology for the Period 2022 - 2032
- Historical Data and Forecast of Japan Microspheres Market Revenues & Volume By Cosmetics & Personal Care for the Period 2022 - 2032
- Historical Data and Forecast of Japan Microspheres Market Revenues & Volume By Automotive for the Period 2022 - 2032
- Historical Data and Forecast of Japan Microspheres Market Revenues & Volume By Oil & Gas for the Period 2022 - 2032
- Historical Data and Forecast of Australia Microspheres Market Revenues & Volume By Application for the Period 2022 - 2032
- Historical Data and Forecast of Australia Microspheres Market Revenues & Volume By Construction Composites for the Period 2022 - 2032
- Historical Data and Forecast of Australia Microspheres Market Revenues & Volume By Medical Technology for the Period 2022 - 2032
- Historical Data and Forecast of Australia Microspheres Market Revenues & Volume By Cosmetics & Personal Care for the Period 2022 - 2032
- Historical Data and Forecast of Australia Microspheres Market Revenues & Volume By Automotive for the Period 2022 - 2032
- Historical Data and Forecast of Australia Microspheres Market Revenues & Volume By Oil & Gas for the Period 2022 - 2032
- Historical Data and Forecast of Indonesia Microspheres Market Revenues & Volume By Application for the Period 2022 - 2032
- Historical Data and Forecast of Indonesia Microspheres Market Revenues & Volume By Construction Composites for the Period 2022 - 2032
- Historical Data and Forecast of Indonesia Microspheres Market Revenues & Volume By Medical Technology for the Period 2022 - 2032
- Historical Data and Forecast of Indonesia Microspheres Market Revenues & Volume By Cosmetics & Personal Care for the Period 2022 - 2032
- Historical Data and Forecast of Indonesia Microspheres Market Revenues & Volume By Automotive for the Period 2022 - 2032
- Historical Data and Forecast of Indonesia Microspheres Market Revenues & Volume By Oil & Gas for the Period 2022 - 2032
- Historical Data and Forecast of Philippines Microspheres Market Revenues & Volume By Application for the Period 2022 - 2032
- Historical Data and Forecast of Philippines Microspheres Market Revenues & Volume By Construction Composites for the Period 2022 - 2032
- Historical Data and Forecast of Philippines Microspheres Market Revenues & Volume By Medical Technology for the Period 2022 - 2032
- Historical Data and Forecast of Philippines Microspheres Market Revenues & Volume By Cosmetics & Personal Care for the Period 2022 - 2032
- Historical Data and Forecast of Philippines Microspheres Market Revenues & Volume By Automotive for the Period 2022 - 2032
- Historical Data and Forecast of Philippines Microspheres Market Revenues & Volume By Oil & Gas for the Period 2022 - 2032
- Historical Data and Forecast of Malaysia Microspheres Market Revenues & Volume By Application for the Period 2022 - 2032
- Historical Data and Forecast of Malaysia Microspheres Market Revenues & Volume By Construction Composites for the Period 2022 - 2032
- Historical Data and Forecast of Malaysia Microspheres Market Revenues & Volume By Medical Technology for the Period 2022 - 2032
- Historical Data and Forecast of Malaysia Microspheres Market Revenues & Volume By Cosmetics & Personal Care for the Period 2022 - 2032
- Historical Data and Forecast of Malaysia Microspheres Market Revenues & Volume By Automotive for the Period 2022 - 2032
- Historical Data and Forecast of Malaysia Microspheres Market Revenues & Volume By Oil & Gas for the Period 2022 - 2032
- Historical Data and Forecast of Rest of Asia Microspheres Market Revenues & Volume By Application for the Period 2022 - 2032
- Historical Data and Forecast of Rest of Asia Microspheres Market Revenues & Volume By Construction Composites for the Period 2022 - 2032
- Historical Data and Forecast of Rest of Asia Microspheres Market Revenues & Volume By Medical Technology for the Period 2022 - 2032
- Historical Data and Forecast of Rest of Asia Microspheres Market Revenues & Volume By Cosmetics & Personal Care for the Period 2022 - 2032
- Historical Data and Forecast of Rest of Asia Microspheres Market Revenues & Volume By Automotive for the Period 2022 - 2032
- Historical Data and Forecast of Rest of Asia Microspheres Market Revenues & Volume By Oil & Gas for the Period 2022 - 2032
- Asia Pacific Microspheres Market - Key Performance Indicators
- Asia Pacific Microspheres Market - Import Export Trade Statistics
- Asia Pacific Microspheres Market - Opportunity Assessment By Countries
- Asia Pacific Microspheres Market - Opportunity Assessment By Type
- Asia Pacific Microspheres Market - Opportunity Assessment By Raw Material
- Asia Pacific Microspheres Market - Opportunity Assessment By Application
- Asia Pacific Microspheres Market - Top Companies Market Share
- Asia Pacific Microspheres Market - Top Companies Profiles
- Asia Pacific Microspheres Market - Comparison of Players in Technical and Operating Parameters
- Asia Pacific Microspheres Market - Strategic Recommendations
Market Segmentations
The Market report covers a detailed analysis of the following market segments:
By Countries
- China
- India
- Japan
- Australia
- Indonesia
- Philippines
- Thailand
- Malaysia
- Rest of Asia
By Type
- Hollow
- Solid
By Raw Material
- Glass
- Ceramic
- Fly Ash
- Polymer
- Metallic
By Application
- Construction Composites
- Medical Technology
- Cosmetics & Personal Care
- Automotive
- Oil & Gas
Asia Pacific Microspheres Market (2026-2032) : FAQ's
The Asia Pacific Microspheres Market is projected to grow at a CAGR of 9.7% during the forecast period.
The size of the Asia Pacific Microspheres Market was valued at approx. USD 1.4 billion in 2025 and is projected to reach approx. USD 2.7 billion by 2032.
China, India, Japan, Australia, Indonesia, and Thailand are the leading countries in the Asia Pacific Microspheres Market.
Growth is driven by rising demand for lightweight and durable materials, technological advancements in medical technology.
6Wresearch actively monitors the Asia Pacific Microspheres Market and publishes its comprehensive annual report, highlighting emerging trends, growth drivers, revenue analysis, and forecast outlook. Our insights help businesses to make data-backed strategic decisions with ongoing market dynamics. Our analysts track relevent industries related to the Asia Pacific Microspheres Market, allowing our clients with actionable intelligence and reliable forecasts tailored to emerging regional needs.
Yes, we provide customisation as per your requirements. To learn more, feel free to contact us on sales@6wresearch.com
| 1 Executive Summary |
| 2 Introduction |
| 2.1 Key Highlights of the Report |
| 2.2 Report Description |
| 2.3 Market Scope & Segmentation |
| 2.4 Research Methodology |
| 2.5 Assumptions |
| 3 Asia Pacific Microspheres Market Overview |
| 3.1 Asia Pacific Regional Macro Economic Indicators |
| 3.2 Asia Pacific Microspheres Market Revenues & Volume, 2022 & 2032F |
| 3.3 Asia Pacific Microspheres Market - Industry Life Cycle |
| 3.4 Asia Pacific Microspheres Market - Porter's Five Forces |
| 3.5 Asia Pacific Microspheres Market Revenues & Volume Share, By Countries, 2022 & 2032F |
| 3.6 Asia Pacific Microspheres Market Revenues & Volume Share, By Type, 2022 & 2032F |
| 3.7 Asia Pacific Microspheres Market Revenues & Volume Share, By Raw Material, 2022 & 2032F |
| 3.8 Asia Pacific Microspheres Market Revenues & Volume Share, By Application, 2022 & 2032F |
| 4 Asia Pacific Microspheres Market Dynamics |
| 4.1 Impact Analysis |
| 4.2 Market Drivers |
| 4.3 Market Restraints |
| 5 Asia Pacific Microspheres Market Trends |
| 6 Asia Pacific Microspheres Market, 2022 - 2032 |
| 6.1 Asia Pacific Microspheres Market, Revenues & Volume, By Type, 2022 - 2032 |
| 6.2 Asia Pacific Microspheres Market, Revenues & Volume, By Raw Material, 2022 - 2032 |
| 6.3 Asia Pacific Microspheres Market, Revenues & Volume, By Application, 2022 - 2032 |
| 7 China Microspheres Market, 2022 - 2032 |
| 7.1 China Microspheres Market, Revenues & Volume, By Type, 2022 - 2032 |
| 7.2 China Microspheres Market, Revenues & Volume, By Raw Material, 2022 - 2032 |
| 7.3 China Microspheres Market, Revenues & Volume, By Application, 2022 - 2032 |
| 8 India Microspheres Market, 2022 - 2032 |
| 8.1 India Microspheres Market, Revenues & Volume, By Type, 2022 - 2032 |
| 8.2 India Microspheres Market, Revenues & Volume, By Raw Material, 2022 - 2032 |
| 8.3 India Microspheres Market, Revenues & Volume, By Application, 2022 - 2032 |
| 9 Japan Microspheres Market, 2022 - 2032 |
| 9.1 Japan Microspheres Market, Revenues & Volume, By Type, 2022 - 2032 |
| 9.2 Japan Microspheres Market, Revenues & Volume, By Raw Material, 2022 - 2032 |
| 9.3 Japan Microspheres Market, Revenues & Volume, By Application, 2022 - 2032 |
| 10 Australia Microspheres Market, 2022 - 2032 |
| 10.1 Australia Microspheres Market, Revenues & Volume, By Type, 2022 - 2032 |
| 10.2 Australia Microspheres Market, Revenues & Volume, By Raw Material, 2022 - 2032 |
| 10.3 Australia Microspheres Market, Revenues & Volume, By Application, 2022 - 2032 |
| 11 Indonesia Microspheres Market, 2022 - 2032 |
| 11.1 Indonesia Microspheres Market, Revenues & Volume, By Type, 2022 - 2032 |
| 11.2 Indonesia Microspheres Market, Revenues & Volume, By Raw Material, 2022 - 2032 |
| 11.3 Indonesia Microspheres Market, Revenues & Volume, By Application, 2022 - 2032 |
| 12 Philippines Microspheres Market, 2022 - 2032 |
| 12.1 Philippines Microspheres Market, Revenues & Volume, By Type, 2022 - 2032 |
| 12.2 Philippines Microspheres Market, Revenues & Volume, By Raw Material, 2022 - 2032 |
| 12.3 Philippines Microspheres Market, Revenues & Volume, By Application, 2022 - 2032 |
| 13 Malaysia Microspheres Market, 2022 - 2032 |
| 13.1 Malaysia Microspheres Market, Revenues & Volume, By Type, 2022 - 2032 |
| 13.2 Malaysia Microspheres Market, Revenues & Volume, By Raw Material, 2022 - 2032 |
| 13.3 Malaysia Microspheres Market, Revenues & Volume, By Application, 2022 - 2032 |
| 14 Rest of Asia Microspheres Market, 2022 - 2032 |
| 14.1 Rest of Asia Microspheres Market, Revenues & Volume, By Type, 2022 - 2032 |
| 14.2 Rest of Asia Microspheres Market, Revenues & Volume, By Raw Material, 2022 - 2032 |
| 14.3 Rest of Asia Microspheres Market, Revenues & Volume, By Application, 2022 - 2032 |
| 11 Asia Pacific Microspheres Market Key Performance Indicators |
| 12 Asia Pacific Microspheres Market - Opportunity Assessment |
| 12.1 Asia Pacific Microspheres Market Opportunity Assessment, By Countries, 2022 & 2032F |
| 12.2 Asia Pacific Microspheres Market Opportunity Assessment, By Type, 2022 & 2032F |
| 12.3 Asia Pacific Microspheres Market Opportunity Assessment, By Raw Material, 2022 & 2032F |
| 12.4 Asia Pacific Microspheres Market Opportunity Assessment, By Application, 2022 & 2032F |
| 13 Asia Pacific Microspheres Market - Competitive Landscape |
| 13.1 Asia Pacific Microspheres Market Revenue Share, By Companies, 2025 |
| 13.2 Asia Pacific Microspheres Market Competitive Benchmarking, By Operating and Technical Parameters |
| 14 Company Profiles |
| 15 Recommendations |
| 16 Disclaimer |
Global Go To Market Strategy - 2030
Export potential enables firms to identify high-growth global markets with greater confidence by combining advanced trade intelligence with a structured quantitative methodology. The framework analyzes emerging demand trends and country-level import patterns while integrating macroeconomic and trade datasets such as GDP and population forecasts, bilateral import–export flows, tariff structures, elasticity differentials between developed and developing economies, geographic distance, and import demand projections. Using weighted trade values from 2020–2024 as the base period to project country-to-country export potential for 2030, these inputs are operationalized through calculated drivers such as gravity model parameters, tariff impact factors, and projected GDP per-capita growth. Through an analysis of hidden potentials, demand hotspots, and market conditions that are most favorable to success, this method enables firms to focus on target countries, maximize returns, and global expansion with data, backed by accuracy.
By factoring in the projected importer demand gap that is currently unmet and could be potential opportunity, it identifies the potential for the Exporter (Country) among 190 countries, against the general trade analysis, which identifies the biggest importer or exporter.
To discover high-growth global markets and optimize your business strategy:
Click Here
Pricing
- Single User License$ 4,560
- Department License$ 5,055
- Site License$ 5,595
- Global License$ 6,000

Leadership Perspectives from Industry Events
Search
Thought Leadership and Analyst Meet


Our Clients
6WResearch In News
- India Air Conditioner Market Set for Strong Rebound in 2026 After Weather-Led Correction and GST-Driven Recovery: 6Wresearch
- ADAS in India: How Automatic Emergency Braking, Blind Spot Detection & Driver Monitoring are Transforming Road Safety
- Doha a strategic location for EV manufacturing hub: IPA Qatar
- Demand for luxury TVs surging in the GCC, says Samsung
- Empowering Growth: The Thriving Journey of Bangladesh’s Cable Industry
- Demand for luxury TVs surging in the GCC, says Samsung
Latest Reports
- Nicaragua RPG Gaming Market (2026-2032)
- New Zealand RPG Gaming Market (2026-2032)
- Netherlands RPG Gaming Market (2026-2032)
- Nauru RPG Gaming Market (2026-2032)
- Namibia RPG Gaming Market (2026-2032)
- Mozambique RPG Gaming Market (2026-2032)
- Montenegro RPG Gaming Market (2026-2032)
- Mongolia RPG Gaming Market (2026-2032)
- Monaco RPG Gaming Market (2026-2032)
- Micronesia RPG Gaming Market (2026-2032)
Industry Events and Analyst Meet

EV India Expo 2026

HIMTEX 2026

India Refining Summit 2026

India EV Show 2026

EV tech India Expo 2026
Whitepaper
- Middle East & Africa Commercial Security Market Click here to view more.
- Middle East & Africa Fire Safety Systems & Equipment Market Click here to view more.
- GCC Drone Market Click here to view more.
- Middle East Lighting Fixture Market Click here to view more.
- GCC Physical & Perimeter Security Market Click here to view more.