Australia Microspheres Market Outlook | Companies, Share, COVID-19 IMPACT, Trends, Value, Forecast, Growth, Size, Revenue, Analysis & Industry
Market Forecast By Type (Hollow, Solid), By Raw Material (Glass, Ceramic, Fly Ash, Polymer, Metallic), By Application (Construction Composites, Medical Technology, Cosmetics & Personal Care, Automotive, Oil & Gas) And Competitive Landscape
| Product Code: ETC4497816 | Publication Date: Jul 2023 | Updated Date: Jan 2026 | Product Type: Report | |
| Publisher: 6Wresearch | Author: Dhaval Chaurasia | No. of Pages: 85 | No. of Figures: 45 | No. of Tables: 25 |
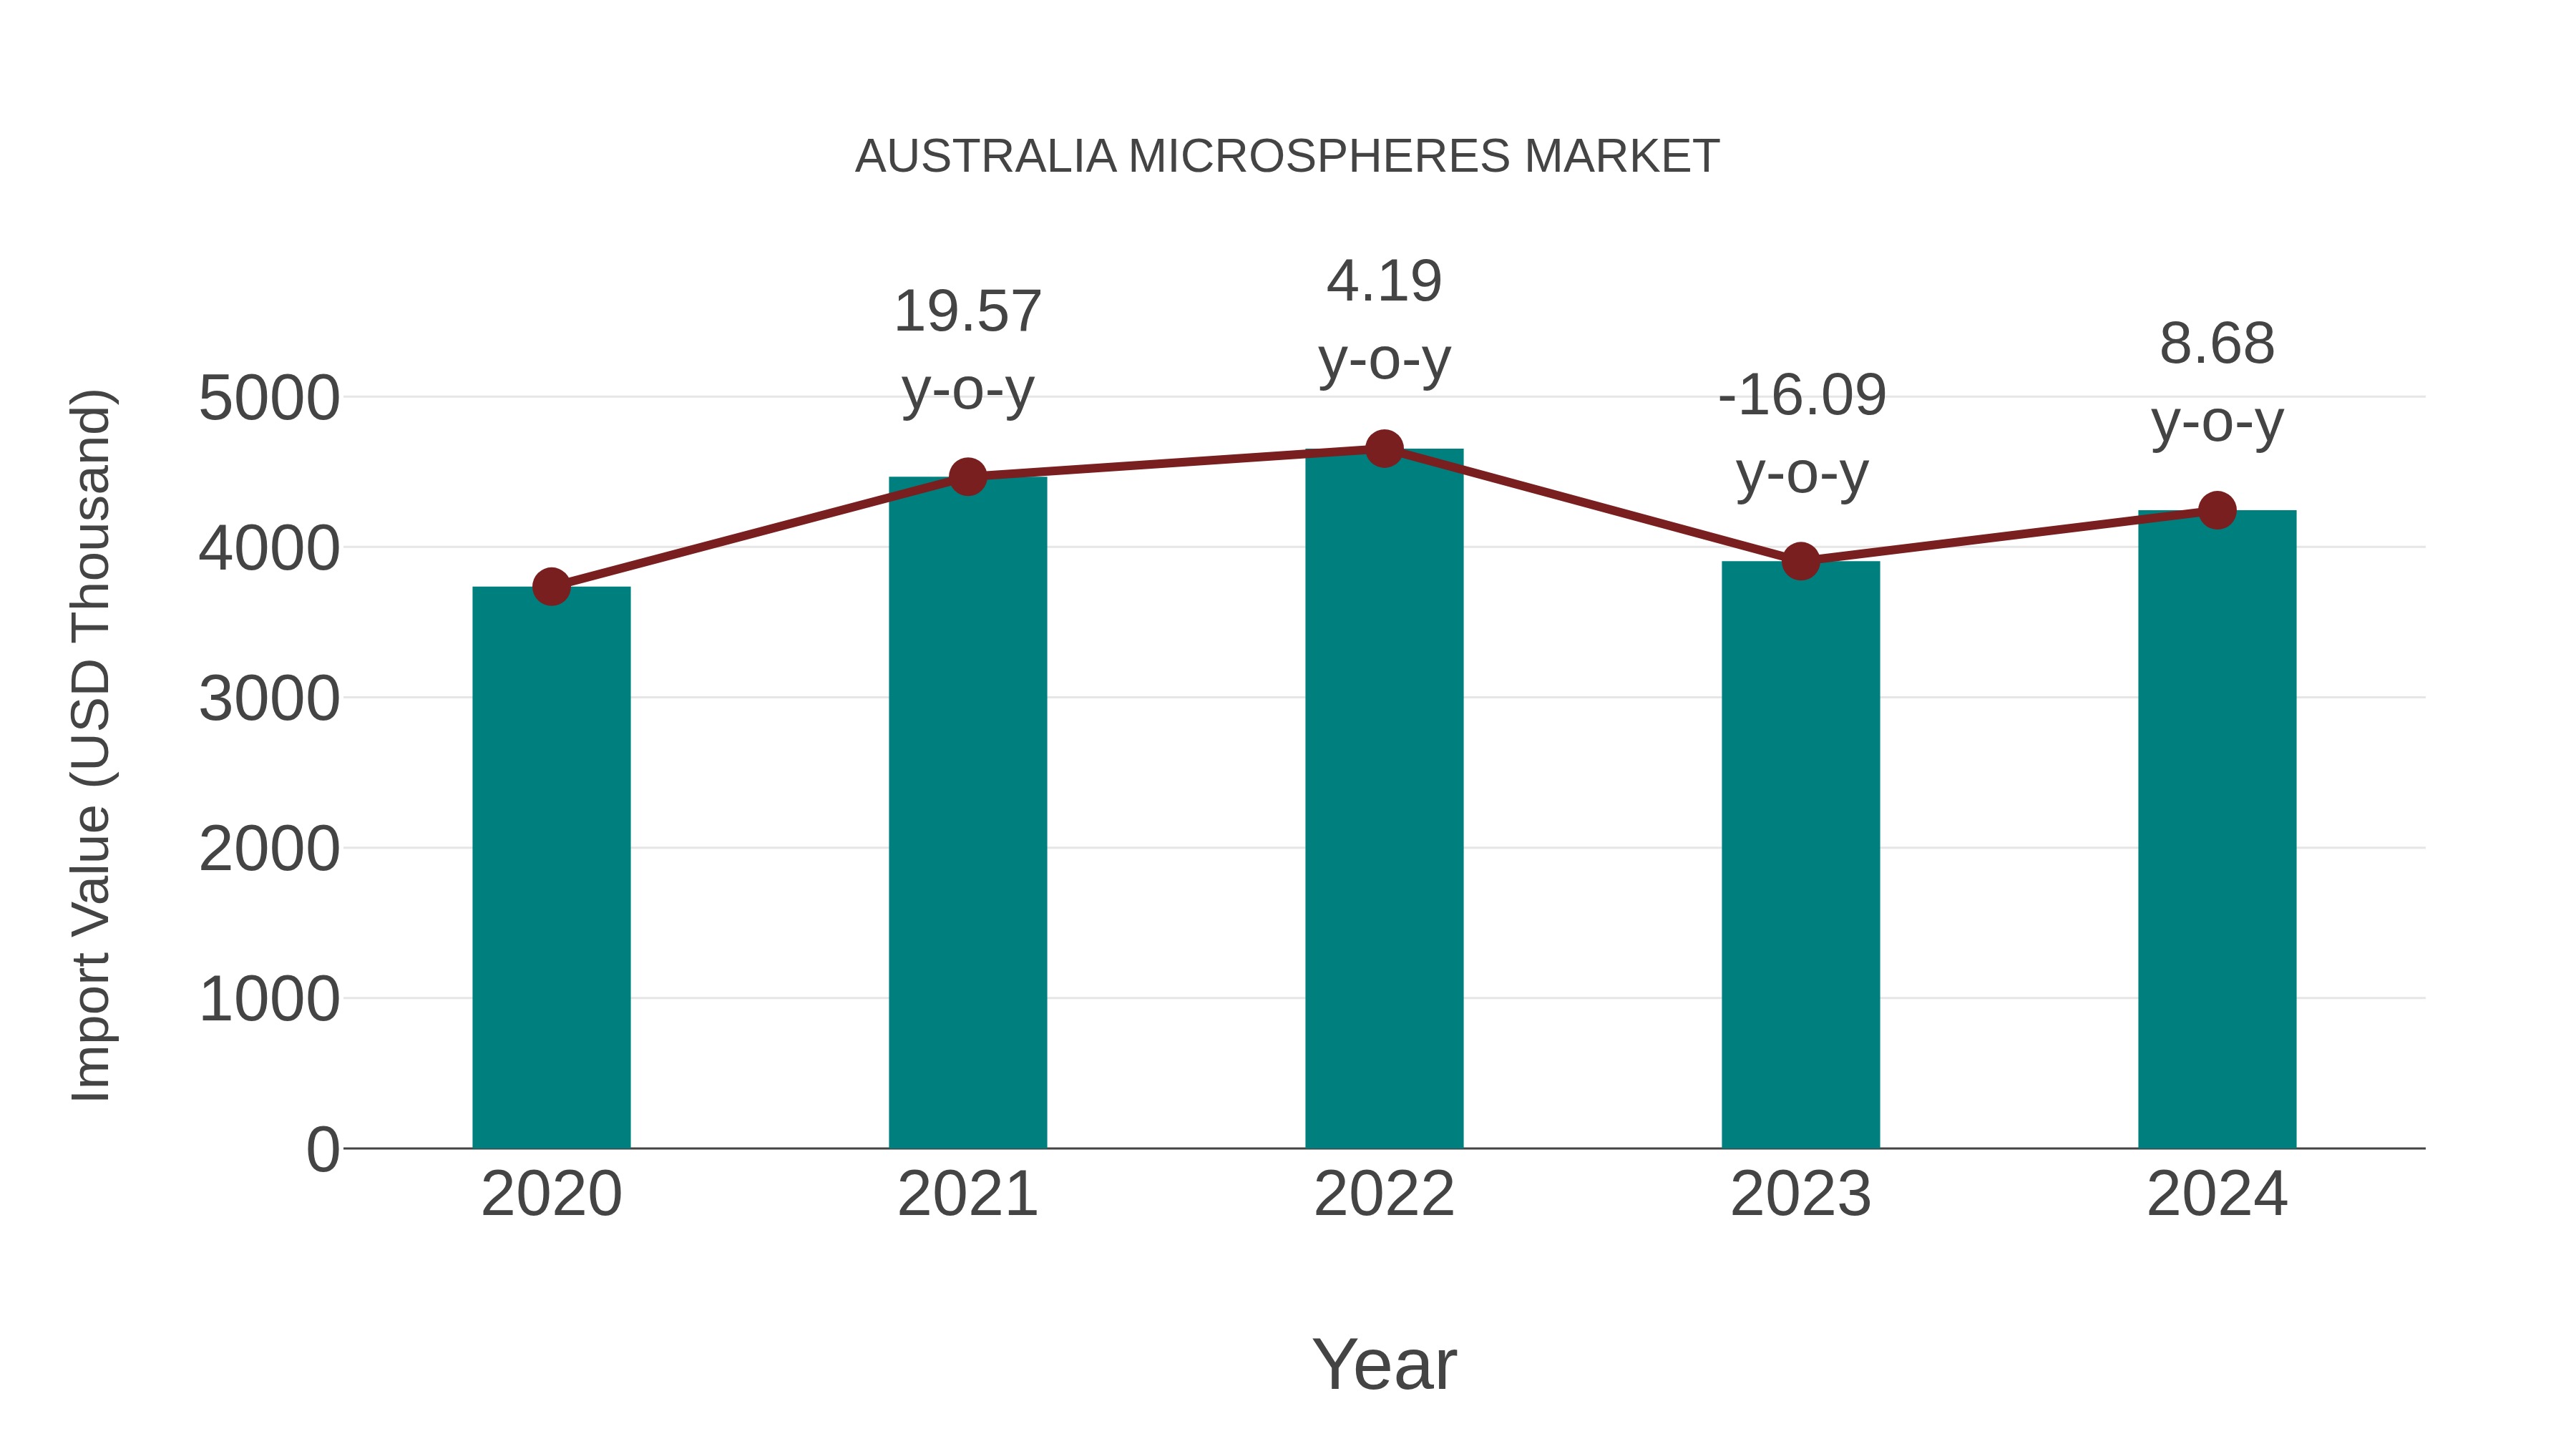
Australia Microspheres Market: Import Trend Analysis
In the Australia microspheres market, the import trend showed a growth rate of 8.68% from 2023 to 2024, with a compound annual growth rate (CAGR) of 3.24% from 2020 to 2024. This increase can be attributed to a notable demand shift towards innovative materials and technologies in various industries, driving import momentum and market stability during this period.
Australia Microspheres Market Overview
Microspheres are spherical particles with precise size and composition used in various applications such as fillers, additives, and carriers in industries such as healthcare, cosmetics, automotive, and construction. In Australia, the microspheres market is driven by factors such as demand for lightweight materials, advancements in polymer science, and applications in drug delivery, composites, and specialty coatings.
Drivers of the market
In Australia, the microspheres market is experiencing significant growth driven by several factors. Microspheres, small spherical particles with precise size and composition, find applications in various industries such as healthcare, cosmetics, and automotive. The market growth is propelled by increasing demand for microspheres in drug delivery, tissue engineering, and medical diagnostics. Additionally, advancements in microsphere manufacturing technologies, such as polymer synthesis and particle engineering techniques, are driving innovation and expanding the application scope of microspheres in Australia. Moreover, the growing trend towards minimally invasive surgeries, personalized medicine, and advanced drug formulations is further stimulating market demand for microsphere-based solutions.
Challenges of the market
The Australia microspheres market faces challenges related to material innovation, quality control, and market diversification. Microspheres, spherical particles with diameters ranging from micrometers to millimeters, find applications in various industries such as healthcare, cosmetics, construction, and automotive. However, developing new microsphere materials with tailored properties and functionalities poses challenges for manufacturers. Additionally, ensuring consistent quality and performance across different batches of microspheres requires stringent quality control measures and characterization techniques. Moreover, expanding into new application areas and market segments while maintaining competitiveness and profitability poses challenges for market players. Overcoming these challenges involves investment in research and development, collaboration with end-users and industry partners, and strategic diversification to capture emerging opportunities in the Australia microspheres market.
Government Policy of the market
The Australia microspheres market benefits from government initiatives aimed at promoting advanced materials research, innovation, and industrial competitiveness. Government policies may include funding for research and development projects focused on the synthesis, characterization, and application of microspheres in various industries, including healthcare, cosmetics, and electronics. Additionally, government support for industry-academia collaborations and technology transfer initiatives enhances the commercialization and adoption of microsphere-based products. By investing in advanced materials research and development, the government aims to stimulate economic growth, create high-value jobs, and support Australia transition to a knowledge-based economy.
Key Highlights of the Report:
- Australia Microspheres Market Outlook
- Market Size of Australia Microspheres Market, 2022
- Forecast of Australia Microspheres Market, 2031
- Historical Data and Forecast of Australia Microspheres Revenues & Volume for the Period 2021-2031
- Australia Microspheres Market Trend Evolution
- Australia Microspheres Market Drivers and Challenges
- Australia Microspheres Price Trends
- Australia Microspheres Porter's Five Forces
- Australia Microspheres Industry Life Cycle
- Historical Data and Forecast of Australia Microspheres Market Revenues & Volume By Type for the Period 2021-2031
- Historical Data and Forecast of Australia Microspheres Market Revenues & Volume By Hollow for the Period 2021-2031
- Historical Data and Forecast of Australia Microspheres Market Revenues & Volume By Solid for the Period 2021-2031
- Historical Data and Forecast of Australia Microspheres Market Revenues & Volume By Raw Material for the Period 2021-2031
- Historical Data and Forecast of Australia Microspheres Market Revenues & Volume By Glass for the Period 2021-2031
- Historical Data and Forecast of Australia Microspheres Market Revenues & Volume By Ceramic for the Period 2021-2031
- Historical Data and Forecast of Australia Microspheres Market Revenues & Volume By Fly Ash for the Period 2021-2031
- Historical Data and Forecast of Australia Microspheres Market Revenues & Volume By Polymer for the Period 2021-2031
- Historical Data and Forecast of Australia Microspheres Market Revenues & Volume By Metallic for the Period 2021-2031
- Historical Data and Forecast of Australia Microspheres Market Revenues & Volume By Application for the Period 2021-2031
- Historical Data and Forecast of Australia Microspheres Market Revenues & Volume By Construction Composites for the Period 2021-2031
- Historical Data and Forecast of Australia Microspheres Market Revenues & Volume By Medical Technology for the Period 2021-2031
- Historical Data and Forecast of Australia Microspheres Market Revenues & Volume By Cosmetics & Personal Care for the Period 2021-2031
- Historical Data and Forecast of Australia Microspheres Market Revenues & Volume By Automotive for the Period 2021-2031
- Historical Data and Forecast of Australia Microspheres Market Revenues & Volume By Oil & Gas for the Period 2021-2031
- Australia Microspheres Import Export Trade Statistics
- Market Opportunity Assessment By Type
- Market Opportunity Assessment By Raw Material
- Market Opportunity Assessment By Application
- Australia Microspheres Top Companies Market Share
- Australia Microspheres Competitive Benchmarking By Technical and Operational Parameters
- Australia Microspheres Company Profiles
- Australia Microspheres Key Strategic Recommendations
Frequently Asked Questions About the Market Study (FAQs):
6Wresearch actively monitors the Australia Microspheres Market and publishes its comprehensive annual report, highlighting emerging trends, growth drivers, revenue analysis, and forecast outlook. Our insights help businesses to make data-backed strategic decisions with ongoing market dynamics. Our analysts track relevent industries related to the Australia Microspheres Market, allowing our clients with actionable intelligence and reliable forecasts tailored to emerging regional needs.
Yes, we provide customisation as per your requirements. To learn more, feel free to contact us on sales@6wresearch.com
1 Executive Summary |
2 Introduction |
2.1 Key Highlights of the Report |
2.2 Report Description |
2.3 Market Scope & Segmentation |
2.4 Research Methodology |
2.5 Assumptions |
3 Australia Microspheres Market Overview |
3.1 Australia Country Macro Economic Indicators |
3.2 Australia Microspheres Market Revenues & Volume, 2022 & 2031F |
3.3 Australia Microspheres Market - Industry Life Cycle |
3.4 Australia Microspheres Market - Porter's Five Forces |
3.5 Australia Microspheres Market Revenues & Volume Share, By Type, 2022 & 2031F |
3.6 Australia Microspheres Market Revenues & Volume Share, By Raw Material, 2022 & 2031F |
3.7 Australia Microspheres Market Revenues & Volume Share, By Application, 2022 & 2031F |
4 Australia Microspheres Market Dynamics |
4.1 Impact Analysis |
4.2 Market Drivers |
4.2.1 Increasing demand for eco-friendly products and sustainable solutions. |
4.2.2 Growth in the pharmaceutical and healthcare industries. |
4.2.3 Rising adoption of microspheres in construction and automotive sectors. |
4.3 Market Restraints |
4.3.1 Stringent regulations related to the use of microplastics in certain applications. |
4.3.2 Volatility in raw material prices affecting production costs. |
4.3.3 Limited awareness and understanding of microspheres among end-users. |
5 Australia Microspheres Market Trends |
6 Australia Microspheres Market, By Types |
6.1 Australia Microspheres Market, By Type |
6.1.1 Overview and Analysis |
6.1.2 Australia Microspheres Market Revenues & Volume, By Type, 2021-2031F |
6.1.3 Australia Microspheres Market Revenues & Volume, By Hollow, 2021-2031F |
6.1.4 Australia Microspheres Market Revenues & Volume, By Solid, 2021-2031F |
6.2 Australia Microspheres Market, By Raw Material |
6.2.1 Overview and Analysis |
6.2.2 Australia Microspheres Market Revenues & Volume, By Glass, 2021-2031F |
6.2.3 Australia Microspheres Market Revenues & Volume, By Ceramic, 2021-2031F |
6.2.4 Australia Microspheres Market Revenues & Volume, By Fly Ash, 2021-2031F |
6.2.5 Australia Microspheres Market Revenues & Volume, By Polymer, 2021-2031F |
6.2.6 Australia Microspheres Market Revenues & Volume, By Metallic, 2021-2031F |
6.3 Australia Microspheres Market, By Application |
6.3.1 Overview and Analysis |
6.3.2 Australia Microspheres Market Revenues & Volume, By Construction Composites, 2021-2031F |
6.3.3 Australia Microspheres Market Revenues & Volume, By Medical Technology, 2021-2031F |
6.3.4 Australia Microspheres Market Revenues & Volume, By Cosmetics & Personal Care, 2021-2031F |
6.3.5 Australia Microspheres Market Revenues & Volume, By Automotive, 2021-2031F |
6.3.6 Australia Microspheres Market Revenues & Volume, By Oil & Gas, 2021-2031F |
7 Australia Microspheres Market Import-Export Trade Statistics |
7.1 Australia Microspheres Market Export to Major Countries |
7.2 Australia Microspheres Market Imports from Major Countries |
8 Australia Microspheres Market Key Performance Indicators |
8.1 Research and development investment in new microsphere technologies. |
8.2 Number of patents filed for innovative microsphere applications. |
8.3 Adoption rate of microspheres in emerging industries such as cosmetics and agriculture. |
9 Australia Microspheres Market - Opportunity Assessment |
9.1 Australia Microspheres Market Opportunity Assessment, By Type, 2022 & 2031F |
9.2 Australia Microspheres Market Opportunity Assessment, By Raw Material, 2022 & 2031F |
9.3 Australia Microspheres Market Opportunity Assessment, By Application, 2022 & 2031F |
10 Australia Microspheres Market - Competitive Landscape |
10.1 Australia Microspheres Market Revenue Share, By Companies, 2022 |
10.2 Australia Microspheres Market Competitive Benchmarking, By Operating and Technical Parameters |
11 Company Profiles |
12 Recommendations |
13 Disclaimer |
Export potential assessment - trade Analytics for 2030
Export potential enables firms to identify high-growth global markets with greater confidence by combining advanced trade intelligence with a structured quantitative methodology. The framework analyzes emerging demand trends and country-level import patterns while integrating macroeconomic and trade datasets such as GDP and population forecasts, bilateral import–export flows, tariff structures, elasticity differentials between developed and developing economies, geographic distance, and import demand projections. Using weighted trade values from 2020–2024 as the base period to project country-to-country export potential for 2030, these inputs are operationalized through calculated drivers such as gravity model parameters, tariff impact factors, and projected GDP per-capita growth. Through an analysis of hidden potentials, demand hotspots, and market conditions that are most favorable to success, this method enables firms to focus on target countries, maximize returns, and global expansion with data, backed by accuracy.
By factoring in the projected importer demand gap that is currently unmet and could be potential opportunity, it identifies the potential for the Exporter (Country) among 190 countries, against the general trade analysis, which identifies the biggest importer or exporter.
To discover high-growth global markets and optimize your business strategy:
Click Here
Pricing
- Single User License$ 1,995
- Department License$ 2,400
- Site License$ 3,120
- Global License$ 3,795

Search
Thought Leadership and Analyst Meet


Our Clients
Latest Reports
- Taiwan Food Delivery Platform Market (2026-2032) | Companies, Outlook, Analysis, Trends, Value, Revenue, Segmentation, Share, Forecast, Competitive Landscape, Growth, Size & Forecast
- United Kingdom (UK) Long-term Care Insurance Market (2026-2032) | Growth, Share, Consumer Insights, Drivers, Opportunities, Competition, Pricing Analysis, Segments, Restraints, Companies, Competitive, Value, Outlook, Size, Demand, Analysis, Challenges, Strategic Insights, Investment Trends, Revenue, Trends, Supply, Forecast
- United Kingdom (UK) Long Term Care Market (2026-2032) | Companies, Outlook, Analysis, Trends, Value, Revenue, Segmentation, Share, Forecast, Competitive Landscape, Growth, Size & Forecast
- Iraq Insulation and Waterproofing Market (2026-2032) | Outlook, Drivers, Growth, Size, Share, Industry, Revenue, Trends, Demand, Competitive, Strategic Insights, Opportunities, Segments, Companies, Challenges, Strategy, Consumer Insights, Analysis, Investment Trends, Value, Segmentation, Forecast, Restraints
- India Switchgear Market Outlook (2026-2032) | Size, Share, Trends, Growth, Revenue, Forecast, Analysis, Value, Outlook
- Pakistan Contraceptive Implants Market (2025-2031) | Demand, Growth, Size, Share, Industry, Pricing Analysis, Competitive, Strategic Insights, Strategy, Consumer Insights, Analysis, Investment Trends, Opportunities, Revenue, Segments, Value, Segmentation, Supply, Forecast, Restraints, Outlook, Competition, Drivers, Trends, Companies, Challenges
- Sri Lanka Packaging Market (2026-2032) | Outlook, Competition, Drivers, Trends, Demand, Pricing Analysis, Competitive, Strategic Insights, Companies, Challenges, Strategy, Consumer Insights, Analysis, Investment Trends, Opportunities, Growth, Size, Share, Industry, Revenue, Segments, Value, Segmentation, Supply, Forecast, Restraints
- India Kids Watches Market (2026-2032) | Strategy, Consumer Insights, Analysis, Investment Trends, Opportunities, Growth, Size, Share, Industry, Revenue, Segments, Value, Segmentation, Supply, Forecast, Restraints, Outlook, Competition, Drivers, Trends, Demand, Pricing Analysis, Competitive, Strategic Insights, Companies, Challenges
- Saudi Arabia Core Assurance Service Market (2025-2031) | Strategy, Consumer Insights, Analysis, Investment Trends, Opportunities, Growth, Size, Share, Industry, Revenue, Segments, Value, Segmentation, Supply, Forecast, Restraints, Outlook, Competition, Drivers, Trends, Demand, Pricing Analysis, Competitive, Strategic Insights, Companies, Challenges
- Romania Uninterruptible Power Supply (UPS) Market (2026-2032) | Industry, Analysis, Revenue, Size, Forecast, Outlook, Value, Trends, Share, Growth & Companies
Industry Events and Analyst Meet

India EV Show 2026

EV tech India Expo 2026

Auto Tech Asia 2026

Battery Tech India 2026

Smart Production Solutions Guangzhou 2026
Whitepaper
- Middle East & Africa Commercial Security Market Click here to view more.
- Middle East & Africa Fire Safety Systems & Equipment Market Click here to view more.
- GCC Drone Market Click here to view more.
- Middle East Lighting Fixture Market Click here to view more.
- GCC Physical & Perimeter Security Market Click here to view more.
6WResearch In News
- Doha a strategic location for EV manufacturing hub: IPA Qatar
- Demand for luxury TVs surging in the GCC, says Samsung
- Empowering Growth: The Thriving Journey of Bangladesh’s Cable Industry
- Demand for luxury TVs surging in the GCC, says Samsung
- Video call with a traditional healer? Once unthinkable, it’s now common in South Africa
- Intelligent Buildings To Smooth GCC’s Path To Net Zero