Armenia Colorants Market (2026-2032) | Trends, Segmentation, Share, Size, Revenue, Outlook, Forecast, Industry, Analysis, Value, Growth & Companies
Market Forecast By Type (Dyes, Pigments, Masterbatches, Color Concentrates), By End Use Industry (Packaging, Building & Construction, Automotive, Textiles, Paper & Printing) And Competitive Landscape
| Product Code: ETC5654740 | Publication Date: Nov 2023 | Updated Date: Mar 2026 | Product Type: Market Research Report | |
| Publisher: 6Wresearch | Author: Sumit Sagar | No. of Pages: 60 | No. of Figures: 30 | No. of Tables: 5 |
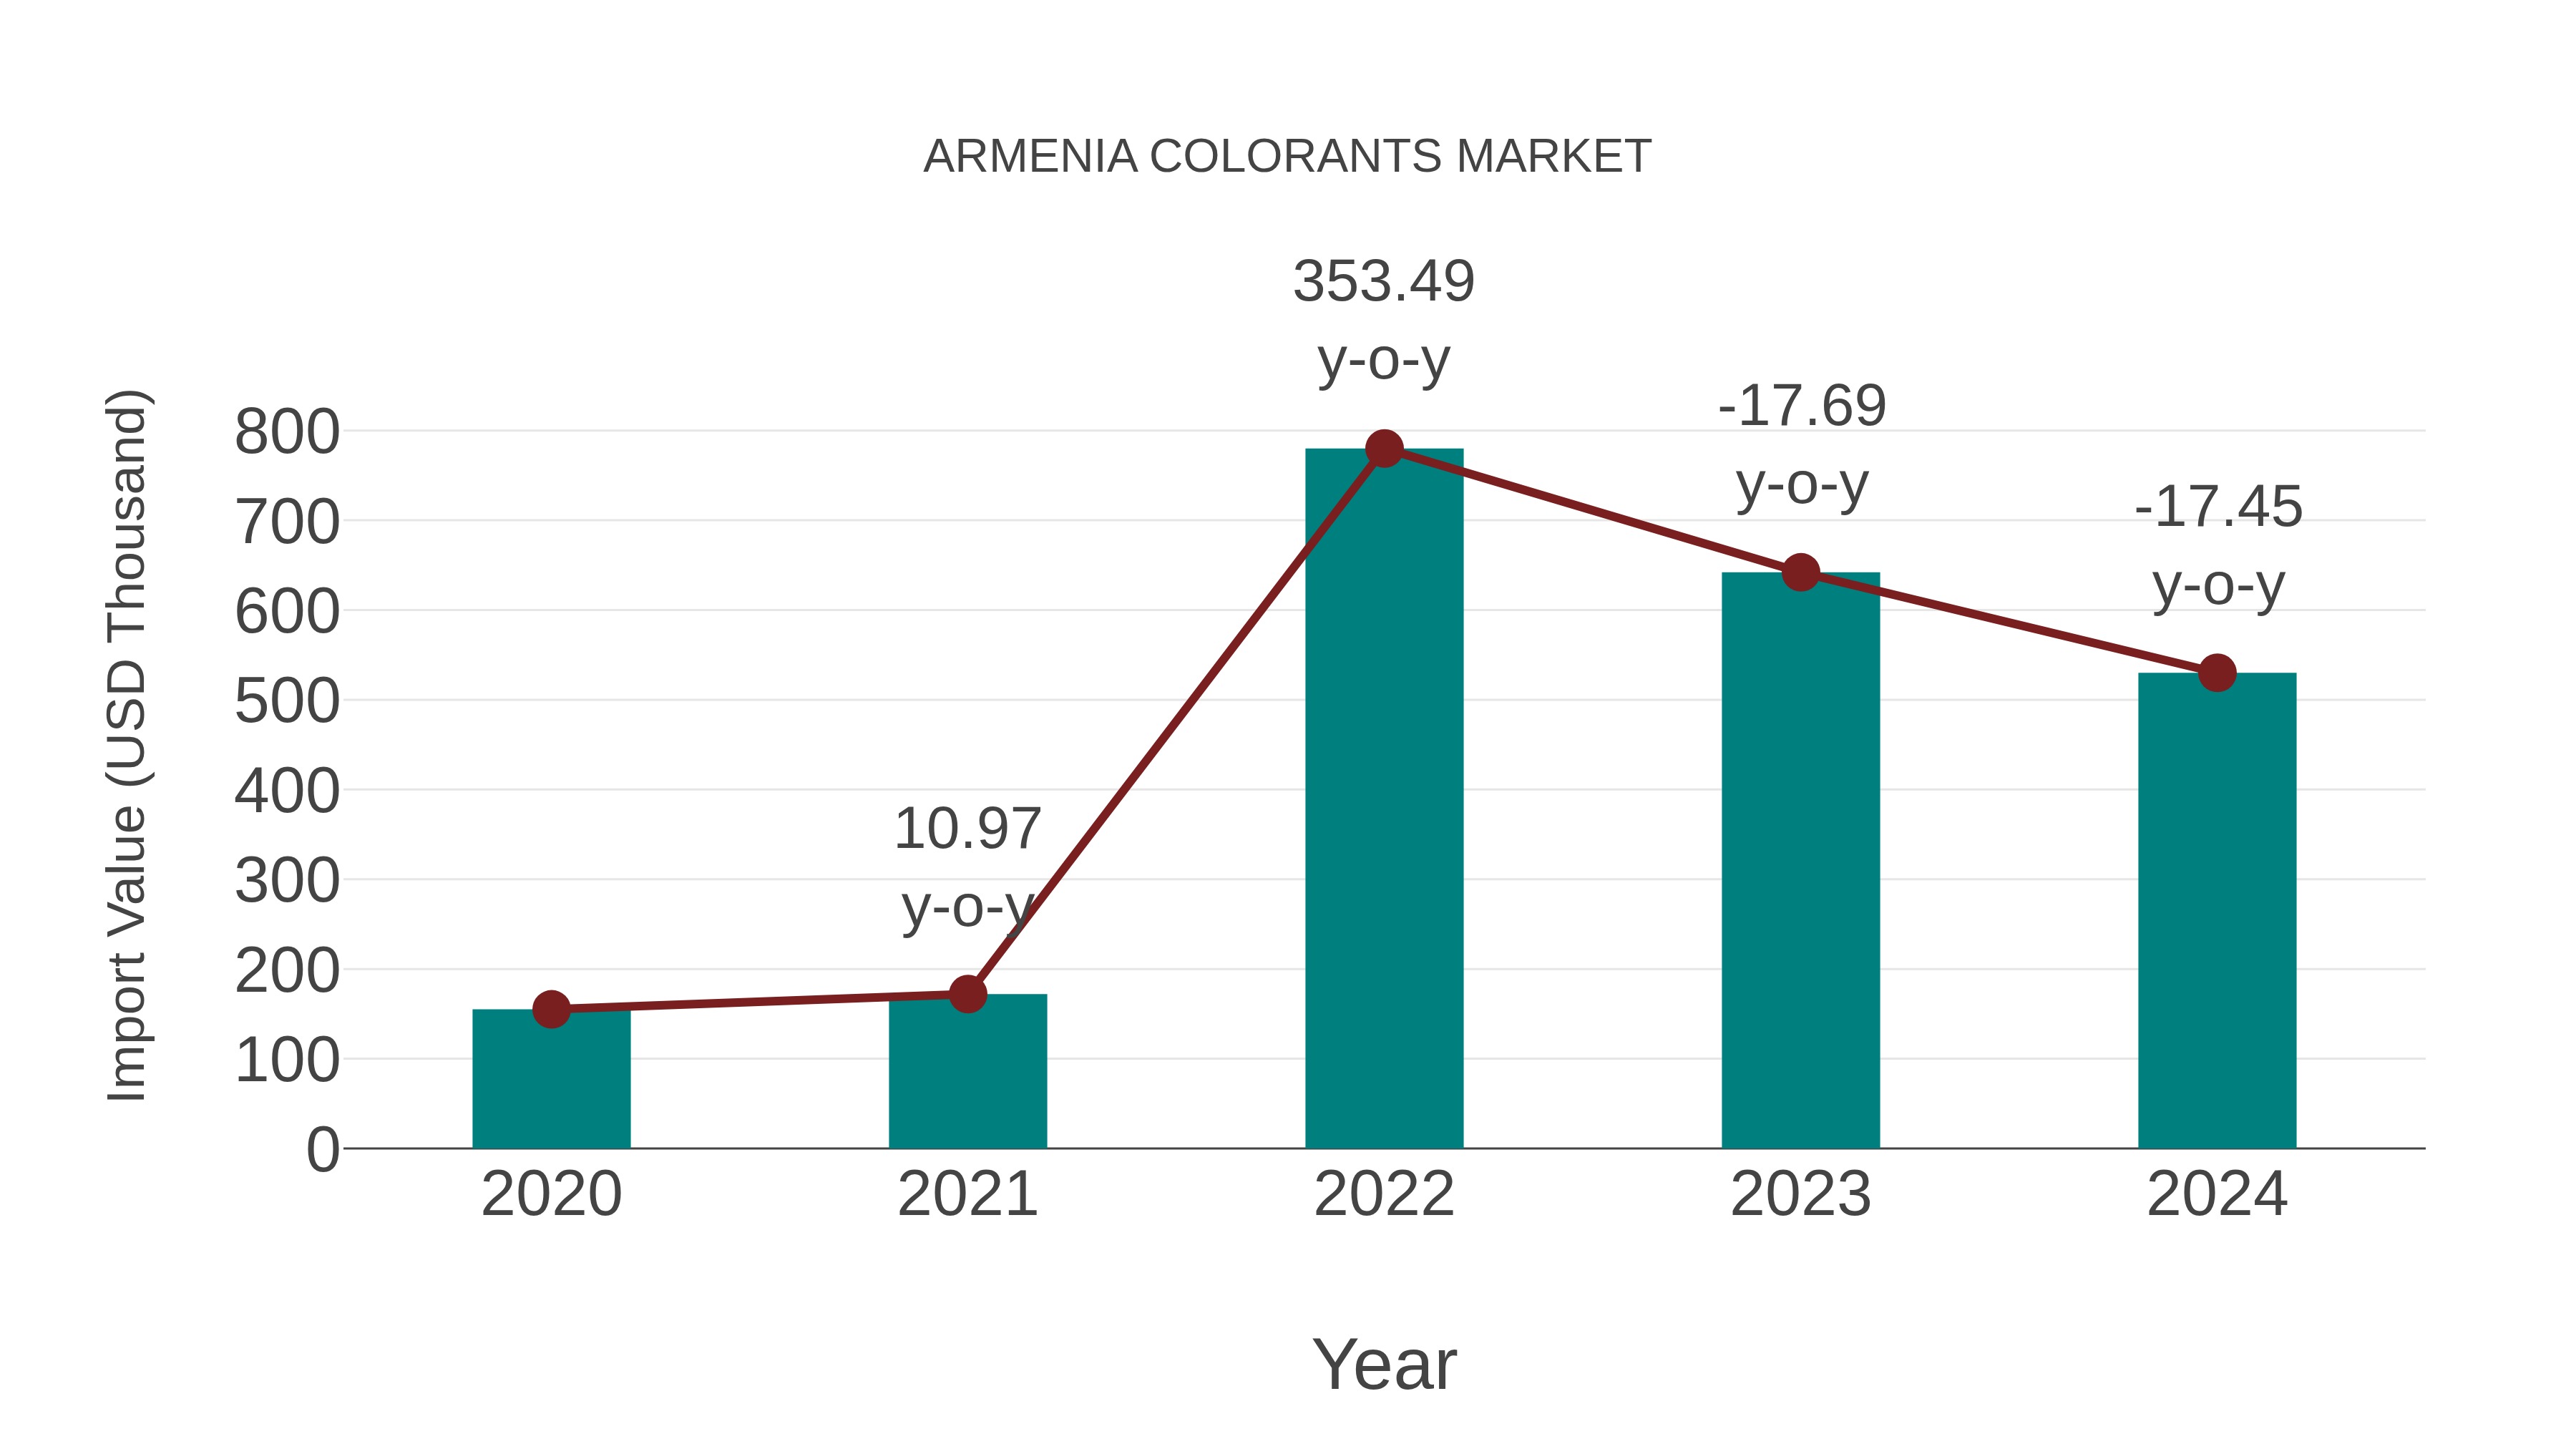
Armenia Colorants Market: Import Trend Analysis
Armenia import trend for colorants in the market experienced a notable decline from 2023 to 2024, with a growth rate of -17.45%. However, the compound annual growth rate (CAGR) for 2020-2024 stood at a robust 35.98%. This shift may be attributed to fluctuating demand dynamics or changes in trade policies influencing market stability.
Armenia Colorants Market Overview
The Armenia colorants market encompasses a wide range of products including dyes, pigments, and color additives used in industries such as textiles, plastics, and printing inks. The market is driven by the growing demand for vibrant and durable colors in consumer goods and industrial applications. Innovations in colorant formulations, offering enhanced performance and environmental sustainability, are playing a crucial role in market growth. Additionally, the increasing use of colorants in packaging to improve product appeal and brand differentiation is further propelling the market. Regulatory compliance and the shift towards natural and organic colorants are also significant trends influencing the market dynamics.
Drivers of the market
The Armenia Colorants Market is driven by the diverse applications of colorants in industries such as textiles, plastics, printing, and coatings. The growing demand for vibrant and long-lasting colors in textiles and garments is a significant driver. Additionally, the increasing use of colorants in packaging to enhance product appeal and brand recognition is boosting market growth. Technological advancements in colorant formulations, offering improved stability and performance, are also contributing to the market`s expansion.
Challenges of the market
The Armenia colorants market faces challenges such as limited access to high-quality raw materials and advanced production technologies. This limits the ability to produce diverse and high-performance colorants locally. The market also contends with stringent environmental and safety regulations, which require significant investment in compliance and adaptation. Additionally, competition from established international players with well-developed supply chains and economies of scale poses a significant threat to local manufacturers.
Government Policy of the market
Government policies could involve regulations on chemical substances, safety data sheets, labeling requirements, and adherence to international standards for colorant usage.
Key Highlights of the Report:
- Armenia Colorants Market Outlook
- Market Size of Armenia Colorants Market, 2025
- Forecast of Armenia Colorants Market, 2032
- Historical Data and Forecast of Armenia Colorants Revenues & Volume for the Period 2022-2032F
- Armenia Colorants Market Trend Evolution
- Armenia Colorants Market Drivers and Challenges
- Armenia Colorants Price Trends
- Armenia Colorants Porter`s Five Forces
- Armenia Colorants Industry Life Cycle
- Historical Data and Forecast of Armenia Colorants Market Revenues & Volume By Type for the Period 2022-2032F
- Historical Data and Forecast of Armenia Colorants Market Revenues & Volume By Dyes for the Period 2022-2032F
- Historical Data and Forecast of Armenia Colorants Market Revenues & Volume By Pigments for the Period 2022-2032F
- Historical Data and Forecast of Armenia Colorants Market Revenues & Volume By Masterbatches for the Period 2022-2032F
- Historical Data and Forecast of Armenia Colorants Market Revenues & Volume By Color Concentrates for the Period 2022-2032F
- Historical Data and Forecast of Armenia Colorants Market Revenues & Volume By End Use Industry for the Period 2022-2032F
- Historical Data and Forecast of Armenia Colorants Market Revenues & Volume By Packaging for the Period 2022-2032F
- Historical Data and Forecast of Armenia Colorants Market Revenues & Volume By Building & Construction for the Period 2022-2032F
- Historical Data and Forecast of Armenia Colorants Market Revenues & Volume By Automotive for the Period 2022-2032F
- Historical Data and Forecast of Armenia Colorants Market Revenues & Volume By Textiles for the Period 2022-2032F
- Historical Data and Forecast of Armenia Colorants Market Revenues & Volume By Paper & Printing for the Period 2022-2032F
- Armenia Colorants Import Export Trade Statistics
- Market Opportunity Assessment By Type
- Market Opportunity Assessment By End Use Industry
- Armenia Colorants Top Companies Market Share
- Armenia Colorants Competitive Benchmarking By Technical and Operational Parameters
- Armenia Colorants Company Profiles
- Armenia Colorants Key Strategic Recommendations
Armenia Colorants Market (2026-2032): FAQs
6Wresearch actively monitors the Armenia Colorants Market and publishes its comprehensive annual report, highlighting emerging trends, growth drivers, revenue analysis, and forecast outlook. Our insights help businesses to make data-backed strategic decisions with ongoing market dynamics. Our analysts track relevent industries related to the Armenia Colorants Market, allowing our clients with actionable intelligence and reliable forecasts tailored to emerging regional needs.
Yes, we provide customisation as per your requirements. To learn more, feel free to contact us on sales@6wresearch.com
1 Executive Summary |
2 Introduction |
2.1 Key Highlights of the Report |
2.2 Report Description |
2.3 Market Scope & Segmentation |
2.4 Research Methodology |
2.5 Assumptions |
3 Armenia Colorants Market Overview |
3.1 Armenia Country Macro Economic Indicators |
3.2 Armenia Colorants Market Revenues & Volume, 2022 & 2032F |
3.3 Armenia Colorants Market - Industry Life Cycle |
3.4 Armenia Colorants Market - Porter's Five Forces |
3.5 Armenia Colorants Market Revenues & Volume Share, By Type, 2022 & 2032F |
3.6 Armenia Colorants Market Revenues & Volume Share, By End Use Industry, 2022 & 2032F |
4 Armenia Colorants Market Dynamics |
4.1 Impact Analysis |
4.2 Market Drivers |
4.2.1 Growing demand for eco-friendly and natural colorants in various industries such as food and cosmetics |
4.2.2 Increasing adoption of colorants in the textile industry for dyeing and printing applications |
4.2.3 Government initiatives to promote the use of locally sourced colorants to boost domestic production |
4.3 Market Restraints |
4.3.1 Fluctuating prices of raw materials used in colorant production impacting profit margins |
4.3.2 Stringent regulations and compliance requirements related to the use of colorants in different industries |
4.3.3 Limited availability of skilled labor for producing high-quality colorants |
5 Armenia Colorants Market Trends |
6 Armenia Colorants Market Segmentations |
6.1 Armenia Colorants Market, By Type |
6.1.1 Overview and Analysis |
6.1.2 Armenia Colorants Market Revenues & Volume, By Dyes, 2022-2032F |
6.1.3 Armenia Colorants Market Revenues & Volume, By Pigments, 2022-2032F |
6.1.4 Armenia Colorants Market Revenues & Volume, By Masterbatches, 2022-2032F |
6.1.5 Armenia Colorants Market Revenues & Volume, By Color Concentrates, 2022-2032F |
6.2 Armenia Colorants Market, By End Use Industry |
6.2.1 Overview and Analysis |
6.2.2 Armenia Colorants Market Revenues & Volume, By Packaging, 2022-2032F |
6.2.3 Armenia Colorants Market Revenues & Volume, By Building & Construction, 2022-2032F |
6.2.4 Armenia Colorants Market Revenues & Volume, By Automotive, 2022-2032F |
6.2.5 Armenia Colorants Market Revenues & Volume, By Textiles, 2022-2032F |
6.2.6 Armenia Colorants Market Revenues & Volume, By Paper & Printing, 2022-2032F |
7 Armenia Colorants Market Import-Export Trade Statistics |
7.1 Armenia Colorants Market Export to Major Countries |
7.2 Armenia Colorants Market Imports from Major Countries |
8 Armenia Colorants Market Key Performance Indicators |
8.1 Percentage increase in demand for eco-friendly and natural colorants |
8.2 Adoption rate of colorants in new applications and industries |
8.3 Research and development investment in sustainable colorant technologies |
9 Armenia Colorants Market - Opportunity Assessment |
9.1 Armenia Colorants Market Opportunity Assessment, By Type, 2022 & 2032F |
9.2 Armenia Colorants Market Opportunity Assessment, By End Use Industry, 2022 & 2032F |
10 Armenia Colorants Market - Competitive Landscape |
10.1 Armenia Colorants Market Revenue Share, By Companies, 2025 |
10.2 Armenia Colorants Market Competitive Benchmarking, By Operating and Technical Parameters |
11 Company Profiles |
12 Recommendations | 13 Disclaimer |
Global Go To Market Strategy - 2030
Export potential enables firms to identify high-growth global markets with greater confidence by combining advanced trade intelligence with a structured quantitative methodology. The framework analyzes emerging demand trends and country-level import patterns while integrating macroeconomic and trade datasets such as GDP and population forecasts, bilateral import–export flows, tariff structures, elasticity differentials between developed and developing economies, geographic distance, and import demand projections. Using weighted trade values from 2020–2024 as the base period to project country-to-country export potential for 2030, these inputs are operationalized through calculated drivers such as gravity model parameters, tariff impact factors, and projected GDP per-capita growth. Through an analysis of hidden potentials, demand hotspots, and market conditions that are most favorable to success, this method enables firms to focus on target countries, maximize returns, and global expansion with data, backed by accuracy.
By factoring in the projected importer demand gap that is currently unmet and could be potential opportunity, it identifies the potential for the Exporter (Country) among 190 countries, against the general trade analysis, which identifies the biggest importer or exporter.
To discover high-growth global markets and optimize your business strategy:
Click Here
Pricing
- Single User License$ 1,995
- Department License$ 2,400
- Site License$ 3,120
- Global License$ 3,795

Leadership Perspectives from Industry Events
Search
Thought Leadership and Analyst Meet


Our Clients
6WResearch In News
- India Export Attractiveness Tracker 2026
- India Air Conditioner Market Set for Strong Rebound in 2026 After Weather-Led Correction and GST-Driven Recovery: 6Wresearch
- ADAS in India: How Automatic Emergency Braking, Blind Spot Detection & Driver Monitoring are Transforming Road Safety
- Doha a strategic location for EV manufacturing hub: IPA Qatar
- Demand for luxury TVs surging in the GCC, says Samsung
- Empowering Growth: The Thriving Journey of Bangladesh’s Cable Industry
Latest Reports
- Nicaragua RPG Gaming Market (2026-2032)
- New Zealand RPG Gaming Market (2026-2032)
- Netherlands RPG Gaming Market (2026-2032)
- Nauru RPG Gaming Market (2026-2032)
- Namibia RPG Gaming Market (2026-2032)
- Mozambique RPG Gaming Market (2026-2032)
- Montenegro RPG Gaming Market (2026-2032)
- Mongolia RPG Gaming Market (2026-2032)
- Monaco RPG Gaming Market (2026-2032)
- Micronesia RPG Gaming Market (2026-2032)
Industry Events and Analyst Meet

EV India Expo 2026

HIMTEX 2026

India Refining Summit 2026

India EV Show 2026

EV tech India Expo 2026
Whitepaper
- Middle East & Africa Commercial Security Market Click here to view more.
- Middle East & Africa Fire Safety Systems & Equipment Market Click here to view more.
- GCC Drone Market Click here to view more.
- Middle East Lighting Fixture Market Click here to view more.
- GCC Physical & Perimeter Security Market Click here to view more.