Armenia Flavored Syrups Market (2026-2032) | Industry, Outlook, Segmentation, Companies, Analysis, Forecast, Share, Size, Value, Revenue, Trends & Growth
Market Forecast By Flavor (Fruit, Chocolate, Vanilla, Coffee, Herbs & Seasonings), By Application (Beverages, Diary & Frozen Desserts, Confectionery, Bakery), By Flavor Type (Sweet, Salty, Sour, Savory, Mint), By Product type (Natural, Synthetic) And Competitive Landscape
| Product Code: ETC5001197 | Publication Date: Nov 2023 | Updated Date: Mar 2026 | Product Type: Market Research Report | |
| Publisher: 6Wresearch | Author: Sachin Kumar Rai | No. of Pages: 60 | No. of Figures: 30 | No. of Tables: 5 |
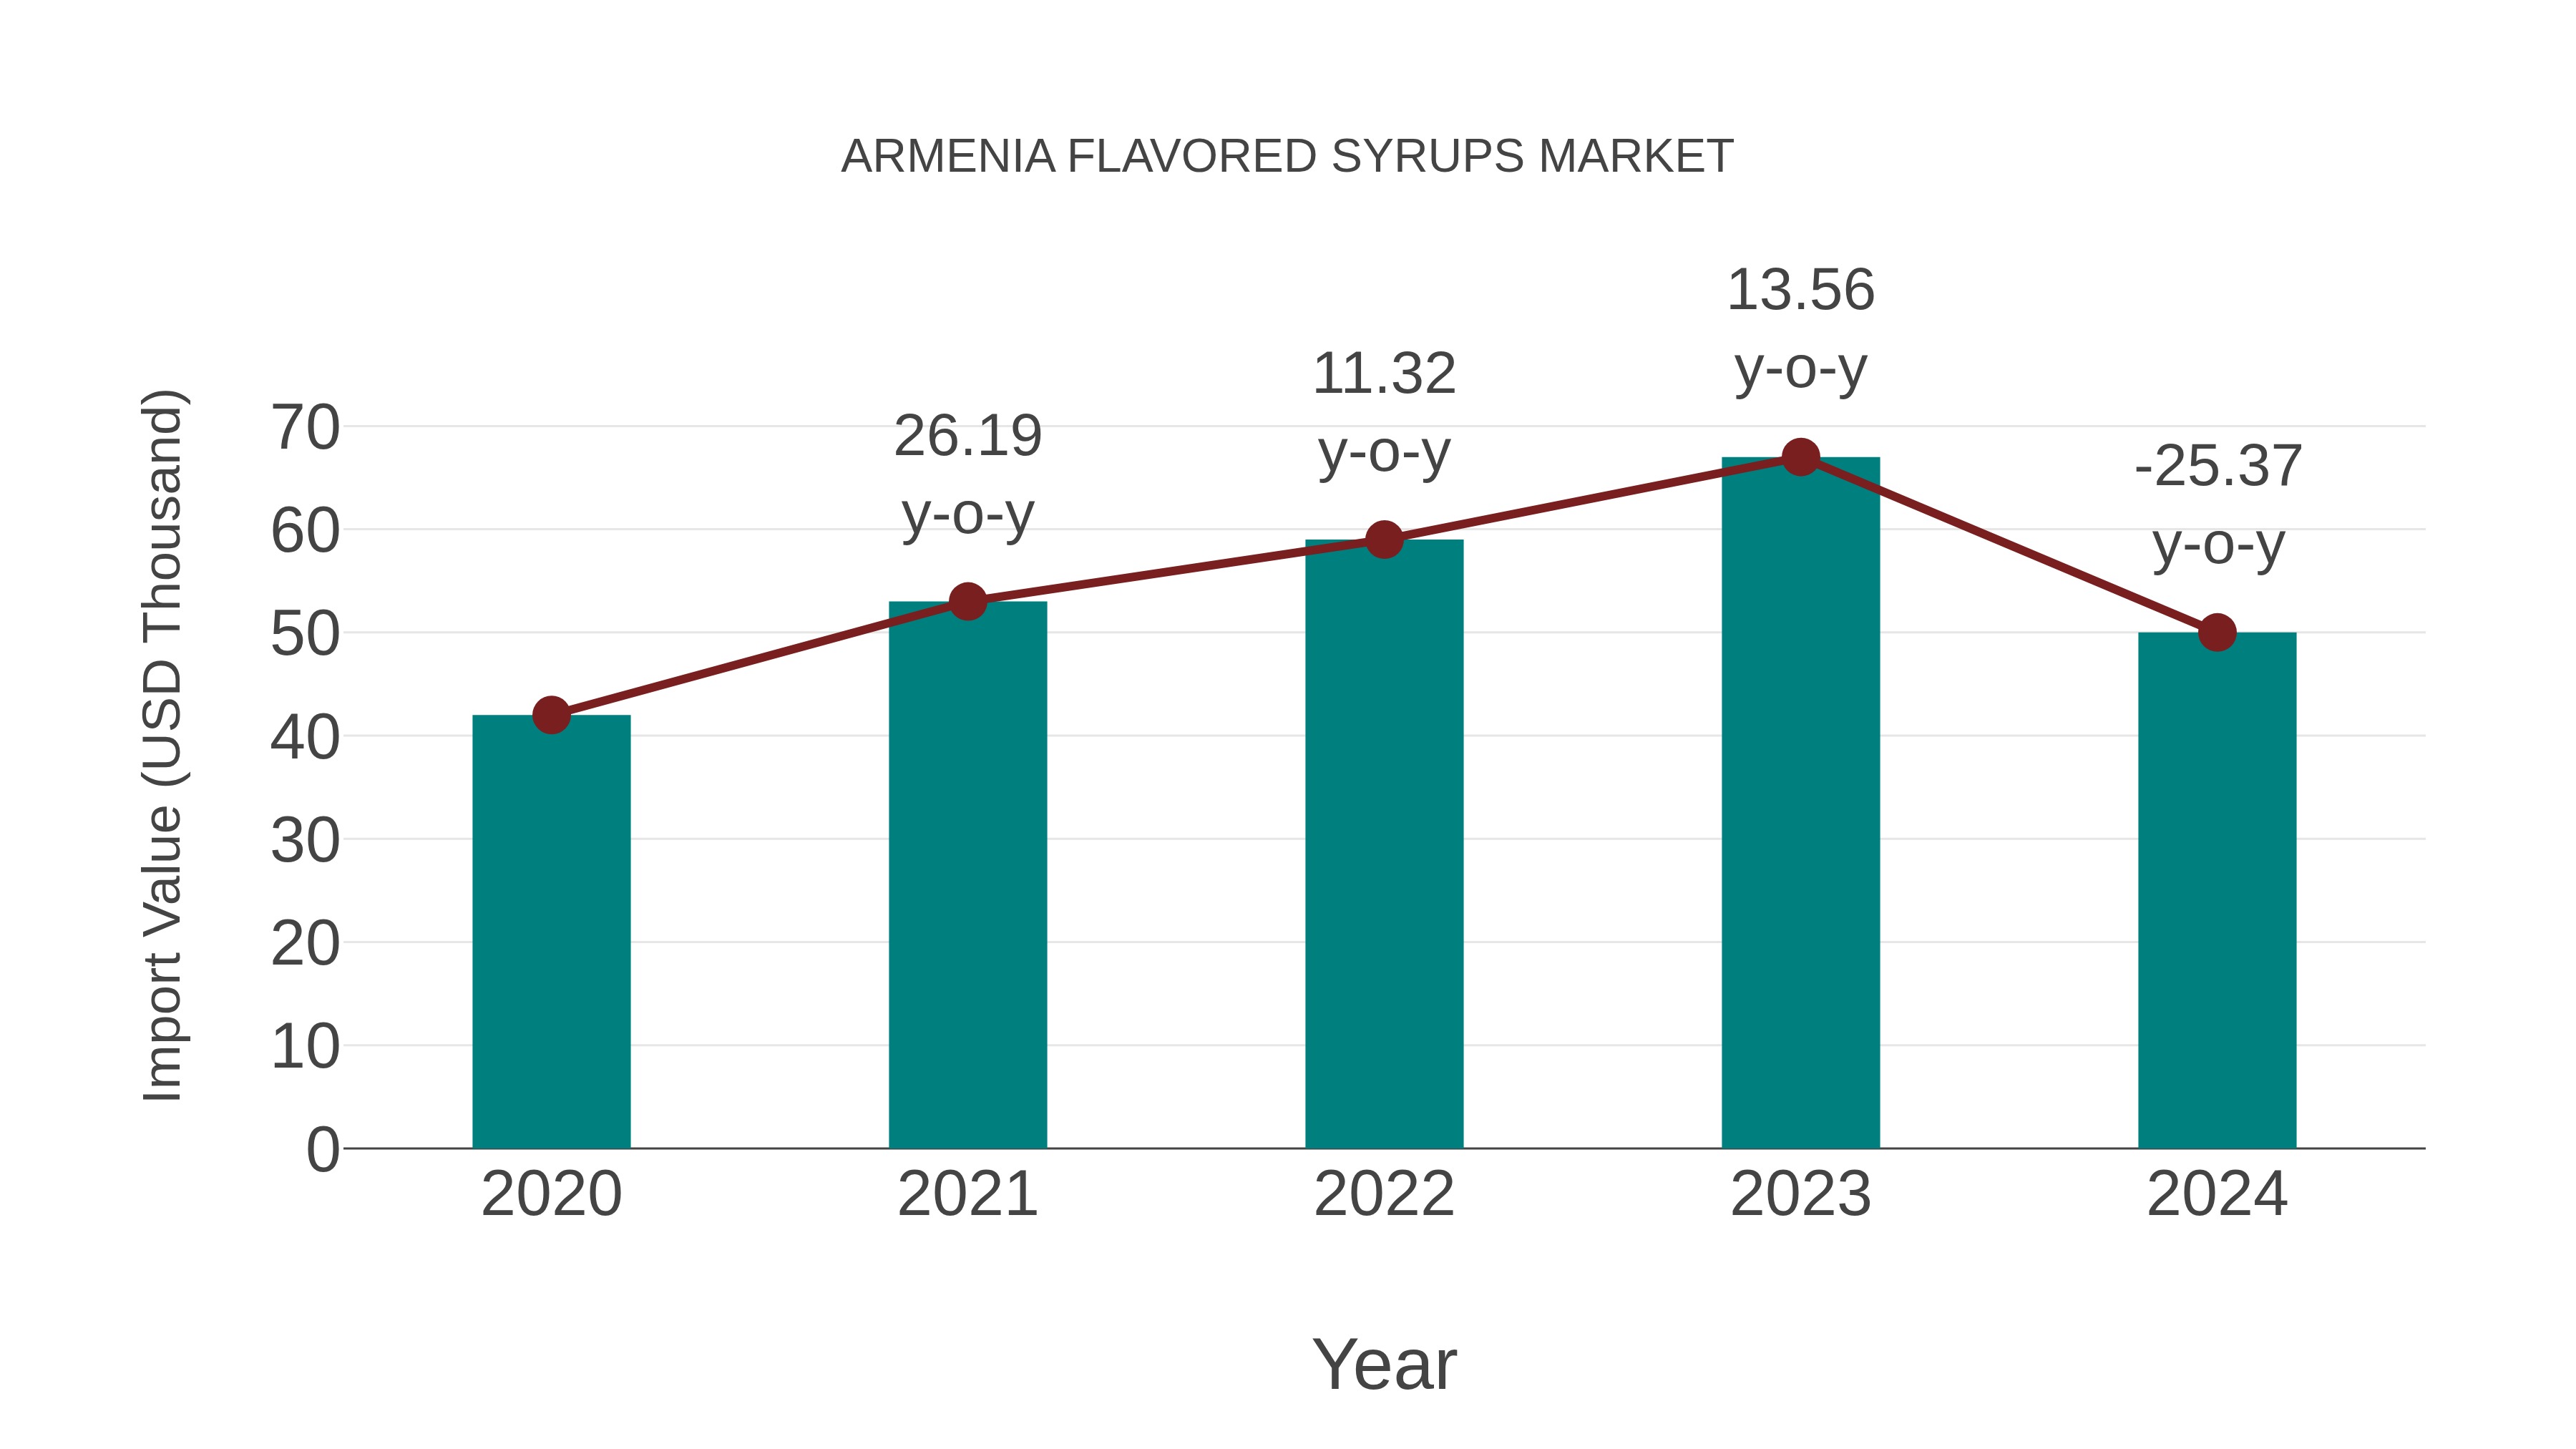
Armenia Flavored Syrups Market: Import Trend Analysis
Armenia import trend for Armenia flavored syrups experienced a notable decline from 2023 to 2024, with a negative growth rate of -25.37%. Despite this, the compound annual growth rate (CAGR) for the period 2020-2024 stood at 4.46%. This decline in import momentum could be attributed to shifting consumer preferences or changes in market demand dynamics.
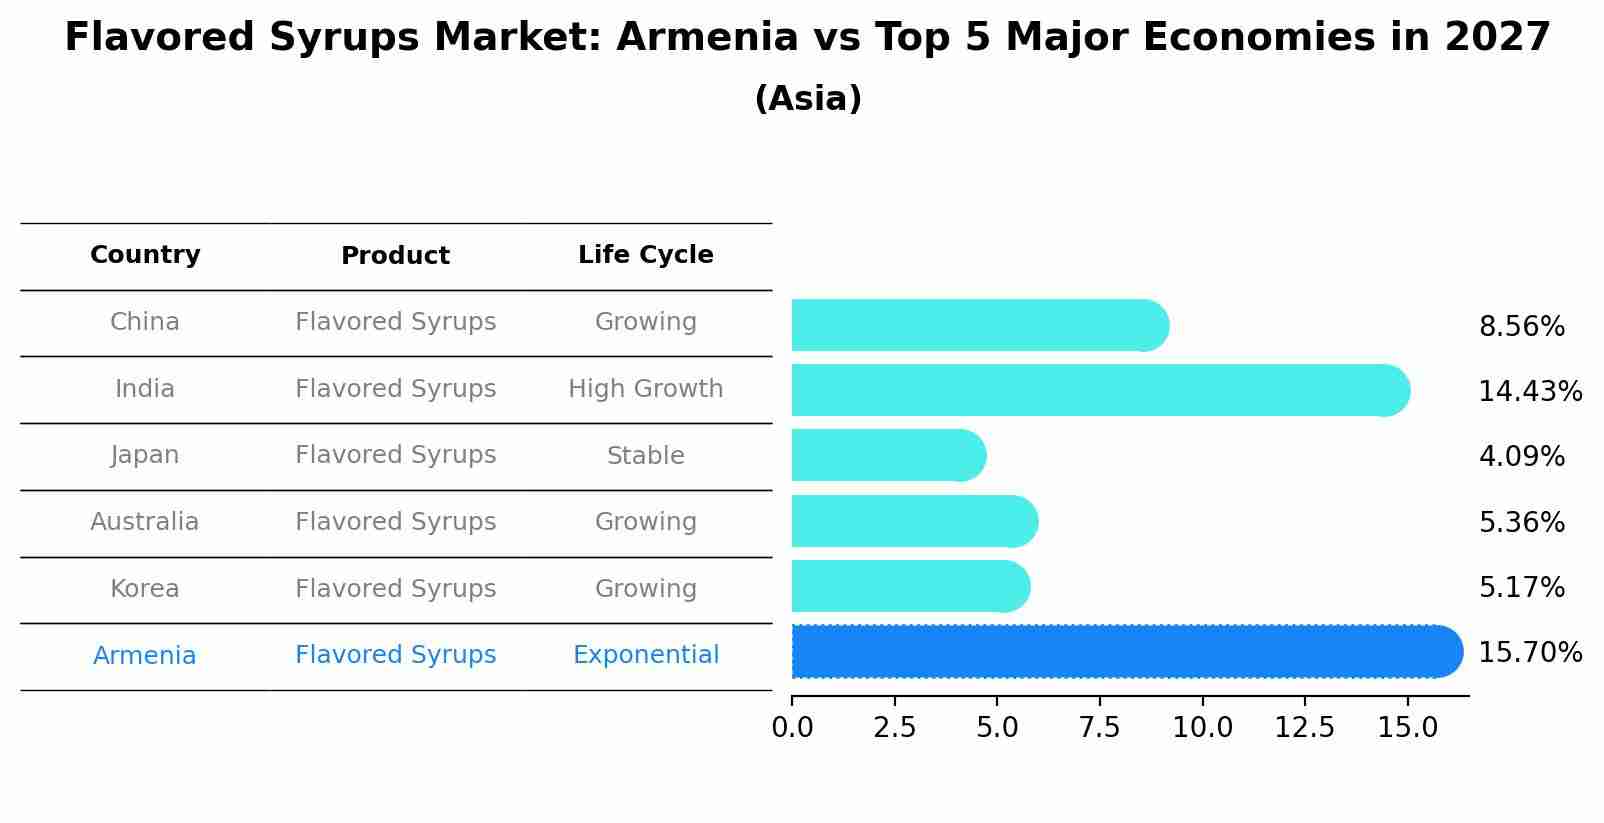
Flavored Syrups Market: Armenia vs Top 5 Major Economies in 2027 (Asia)
The Flavored Syrups market in Armenia is projected to grow at a exponential growth rate of 15.70% by 2027, within the Asia region led by China, along with other countries like India, Japan, Australia and South Korea, collectively shaping a dynamic and evolving market environment driven by innovation and increasing adoption of emerging technologies.
Armenia Flavored Syrups Market Overview
The Armenia Flavored Syrups Market focuses on syrups used to enhance the taste of beverages and food products. Market drivers include the growing consumer preference for flavored beverages and desserts, as well as the expanding food service industry.
Drivers of the market
In Armenia, the flavored syrups market is driven by food and beverage industries using syrups for flavor enhancement, beverage customization, and culinary applications in cafes, restaurants, and household consumption. Flavored syrups offer variety, convenience, and taste consistency in coffee, cocktails, desserts, and culinary recipes, catering to consumer preferences for unique flavors and beverage personalization. Key drivers include hospitality sector growth, café culture trends, and culinary innovation that drive demand for flavored syrups in Armenia`s foodservice and beverage industries.
Challenges of the market
Flavored syrups market challenges in Armenia involve managing flavor consistency, optimizing syrup formulation for diverse beverage applications, and addressing sugar content concerns. Adapting to beverage industry trends and integrating natural and organic syrup alternatives are critical challenges.
Government Policy of the market
Regulations in Armenia`s flavored syrups market prioritize food safety, ingredient labeling, and manufacturing standards to ensure product quality, consumer health protection, and compliance with food regulations for diverse culinary and beverage applications.
Key Highlights of the Report:
- Armenia Flavored Syrups Market Outlook
- Market Size of Armenia Flavored Syrups Market, 2025
- Forecast of Armenia Flavored Syrups Market, 2032
- Historical Data and Forecast of Armenia Flavored Syrups Revenues & Volume for the Period 2022-2032F
- Armenia Flavored Syrups Market Trend Evolution
- Armenia Flavored Syrups Market Drivers and Challenges
- Armenia Flavored Syrups Price Trends
- Armenia Flavored Syrups Porter`s Five Forces
- Armenia Flavored Syrups Industry Life Cycle
- Historical Data and Forecast of Armenia Flavored Syrups Market Revenues & Volume By Flavor for the Period 2022-2032F
- Historical Data and Forecast of Armenia Flavored Syrups Market Revenues & Volume By Fruit for the Period 2022-2032F
- Historical Data and Forecast of Armenia Flavored Syrups Market Revenues & Volume By Chocolate for the Period 2022-2032F
- Historical Data and Forecast of Armenia Flavored Syrups Market Revenues & Volume By Vanilla for the Period 2022-2032F
- Historical Data and Forecast of Armenia Flavored Syrups Market Revenues & Volume By Coffee for the Period 2022-2032F
- Historical Data and Forecast of Armenia Flavored Syrups Market Revenues & Volume By Herbs & Seasonings for the Period 2022-2032F
- Historical Data and Forecast of Armenia Flavored Syrups Market Revenues & Volume By Application for the Period 2022-2032F
- Historical Data and Forecast of Armenia Flavored Syrups Market Revenues & Volume By Beverages for the Period 2022-2032F
- Historical Data and Forecast of Armenia Flavored Syrups Market Revenues & Volume By Diary & Frozen Desserts for the Period 2022-2032F
- Historical Data and Forecast of Armenia Flavored Syrups Market Revenues & Volume By Confectionery for the Period 2022-2032F
- Historical Data and Forecast of Armenia Flavored Syrups Market Revenues & Volume By Bakery for the Period 2022-2032F
- Historical Data and Forecast of Armenia Flavored Syrups Market Revenues & Volume By Flavor Type for the Period 2022-2032F
- Historical Data and Forecast of Armenia Flavored Syrups Market Revenues & Volume By Sweet for the Period 2022-2032F
- Historical Data and Forecast of Armenia Flavored Syrups Market Revenues & Volume By Salty for the Period 2022-2032F
- Historical Data and Forecast of Armenia Flavored Syrups Market Revenues & Volume By Sour for the Period 2022-2032F
- Historical Data and Forecast of Armenia Flavored Syrups Market Revenues & Volume By Savory for the Period 2022-2032F
- Historical Data and Forecast of Armenia Flavored Syrups Market Revenues & Volume By Mint for the Period 2022-2032F
- Historical Data and Forecast of Armenia Flavored Syrups Market Revenues & Volume By Product type for the Period 2022-2032F
- Historical Data and Forecast of Armenia Flavored Syrups Market Revenues & Volume By Natural for the Period 2022-2032F
- Historical Data and Forecast of Armenia Flavored Syrups Market Revenues & Volume By Synthetic for the Period 2022-2032F
- Armenia Flavored Syrups Import Export Trade Statistics
- Market Opportunity Assessment By Flavor
- Market Opportunity Assessment By Application
- Market Opportunity Assessment By Flavor Type
- Market Opportunity Assessment By Product type
- Armenia Flavored Syrups Top Companies Market Share
- Armenia Flavored Syrups Competitive Benchmarking By Technical and Operational Parameters
- Armenia Flavored Syrups Company Profiles
- Armenia Flavored Syrups Key Strategic Recommendations
Armenia Flavored Syrups Market (2026-2032): FAQs
6Wresearch actively monitors the Armenia Flavored Syrups Market and publishes its comprehensive annual report, highlighting emerging trends, growth drivers, revenue analysis, and forecast outlook. Our insights help businesses to make data-backed strategic decisions with ongoing market dynamics. Our analysts track relevent industries related to the Armenia Flavored Syrups Market, allowing our clients with actionable intelligence and reliable forecasts tailored to emerging regional needs.
Yes, we provide customisation as per your requirements. To learn more, feel free to contact us on sales@6wresearch.com
1 Executive Summary |
2 Introduction |
2.1 Key Highlights of the Report |
2.2 Report Description |
2.3 Market Scope & Segmentation |
2.4 Research Methodology |
2.5 Assumptions |
3 Armenia Flavored Syrups Market Overview |
3.1 Armenia Country Macro Economic Indicators |
3.2 Armenia Flavored Syrups Market Revenues & Volume, 2022 & 2032F |
3.3 Armenia Flavored Syrups Market - Industry Life Cycle |
3.4 Armenia Flavored Syrups Market - Porter's Five Forces |
3.5 Armenia Flavored Syrups Market Revenues & Volume Share, By Flavor, 2022 & 2032F |
3.6 Armenia Flavored Syrups Market Revenues & Volume Share, By Application, 2022 & 2032F |
3.7 Armenia Flavored Syrups Market Revenues & Volume Share, By Flavor Type, 2022 & 2032F |
3.8 Armenia Flavored Syrups Market Revenues & Volume Share, By Product type, 2022 & 2032F |
4 Armenia Flavored Syrups Market Dynamics |
4.1 Impact Analysis |
4.2 Market Drivers |
4.3 Market Restraints |
5 Armenia Flavored Syrups Market Trends |
6 Armenia Flavored Syrups Market Segmentations |
6.1 Armenia Flavored Syrups Market, By Flavor |
6.1.1 Overview and Analysis |
6.1.2 Armenia Flavored Syrups Market Revenues & Volume, By Fruit, 2022-2032F |
6.1.3 Armenia Flavored Syrups Market Revenues & Volume, By Chocolate, 2022-2032F |
6.1.4 Armenia Flavored Syrups Market Revenues & Volume, By Vanilla, 2022-2032F |
6.1.5 Armenia Flavored Syrups Market Revenues & Volume, By Coffee, 2022-2032F |
6.1.6 Armenia Flavored Syrups Market Revenues & Volume, By Herbs & Seasonings, 2022-2032F |
6.2 Armenia Flavored Syrups Market, By Application |
6.2.1 Overview and Analysis |
6.2.2 Armenia Flavored Syrups Market Revenues & Volume, By Beverages, 2022-2032F |
6.2.3 Armenia Flavored Syrups Market Revenues & Volume, By Diary & Frozen Desserts, 2022-2032F |
6.2.4 Armenia Flavored Syrups Market Revenues & Volume, By Confectionery, 2022-2032F |
6.2.5 Armenia Flavored Syrups Market Revenues & Volume, By Bakery, 2022-2032F |
6.3 Armenia Flavored Syrups Market, By Flavor Type |
6.3.1 Overview and Analysis |
6.3.2 Armenia Flavored Syrups Market Revenues & Volume, By Sweet, 2022-2032F |
6.3.3 Armenia Flavored Syrups Market Revenues & Volume, By Salty, 2022-2032F |
6.3.4 Armenia Flavored Syrups Market Revenues & Volume, By Sour, 2022-2032F |
6.3.5 Armenia Flavored Syrups Market Revenues & Volume, By Savory, 2022-2032F |
6.3.6 Armenia Flavored Syrups Market Revenues & Volume, By Mint, 2022-2032F |
6.4 Armenia Flavored Syrups Market, By Product type |
6.4.1 Overview and Analysis |
6.4.2 Armenia Flavored Syrups Market Revenues & Volume, By Natural, 2022-2032F |
6.4.3 Armenia Flavored Syrups Market Revenues & Volume, By Synthetic, 2022-2032F |
7 Armenia Flavored Syrups Market Import-Export Trade Statistics |
7.1 Armenia Flavored Syrups Market Export to Major Countries |
7.2 Armenia Flavored Syrups Market Imports from Major Countries |
8 Armenia Flavored Syrups Market Key Performance Indicators |
9 Armenia Flavored Syrups Market - Opportunity Assessment |
9.1 Armenia Flavored Syrups Market Opportunity Assessment, By Flavor, 2022 & 2032F |
9.2 Armenia Flavored Syrups Market Opportunity Assessment, By Application, 2022 & 2032F |
9.3 Armenia Flavored Syrups Market Opportunity Assessment, By Flavor Type, 2022 & 2032F |
9.4 Armenia Flavored Syrups Market Opportunity Assessment, By Product type, 2022 & 2032F |
10 Armenia Flavored Syrups Market - Competitive Landscape |
10.1 Armenia Flavored Syrups Market Revenue Share, By Companies, 2025 |
10.2 Armenia Flavored Syrups Market Competitive Benchmarking, By Operating and Technical Parameters |
11 Company Profiles |
12 Recommendations | 13 Disclaimer |
Global Go To Market Strategy - 2030
Export potential enables firms to identify high-growth global markets with greater confidence by combining advanced trade intelligence with a structured quantitative methodology. The framework analyzes emerging demand trends and country-level import patterns while integrating macroeconomic and trade datasets such as GDP and population forecasts, bilateral import–export flows, tariff structures, elasticity differentials between developed and developing economies, geographic distance, and import demand projections. Using weighted trade values from 2020–2024 as the base period to project country-to-country export potential for 2030, these inputs are operationalized through calculated drivers such as gravity model parameters, tariff impact factors, and projected GDP per-capita growth. Through an analysis of hidden potentials, demand hotspots, and market conditions that are most favorable to success, this method enables firms to focus on target countries, maximize returns, and global expansion with data, backed by accuracy.
By factoring in the projected importer demand gap that is currently unmet and could be potential opportunity, it identifies the potential for the Exporter (Country) among 190 countries, against the general trade analysis, which identifies the biggest importer or exporter.
To discover high-growth global markets and optimize your business strategy:
Click Here
Pricing
- Single User License$ 1,995
- Department License$ 2,400
- Site License$ 3,120
- Global License$ 3,795

Leadership Perspectives from Industry Events
Search
Thought Leadership and Analyst Meet


Our Clients
6WResearch In News
- Doha a strategic location for EV manufacturing hub: IPA Qatar
- Demand for luxury TVs surging in the GCC, says Samsung
- Empowering Growth: The Thriving Journey of Bangladesh’s Cable Industry
- Demand for luxury TVs surging in the GCC, says Samsung
- Video call with a traditional healer? Once unthinkable, it’s now common in South Africa
- Intelligent Buildings To Smooth GCC’s Path To Net Zero
Latest Reports
- Taiwan Airport Wireless Infrastructure Market (2026-2032)
- Vietnam Airport Wireless Infrastructure Market (2026-2032)
- Thailand Airport Wireless Infrastructure Market (2026-2032)
- South Korea Airport Wireless Infrastructure Market (2026-2032)
- Romania Airport Wireless Infrastructure Market (2026-2032)
- Qatar Airport Wireless Infrastructure Market (2026-2032)
- Philippines Airport Wireless Infrastructure Market (2026-2032)
- Japan Airport Wireless Infrastructure Market (2026-2032)
- Taiwan Airport Winter Services Market (2026-2032)
- Vietnam Airport Winter Services Market (2026-2032)
Industry Events and Analyst Meet

HIMTEX 2026

India Refining Summit 2026

India EV Show 2026

EV tech India Expo 2026

Auto Tech Asia 2026
Whitepaper
- Middle East & Africa Commercial Security Market Click here to view more.
- Middle East & Africa Fire Safety Systems & Equipment Market Click here to view more.
- GCC Drone Market Click here to view more.
- Middle East Lighting Fixture Market Click here to view more.
- GCC Physical & Perimeter Security Market Click here to view more.