Armenia Inks Market (2026-2032) | Revenue, Analysis, Forecast, Value, Trends, Industry, Segmentation, Share, Companies, Size, Growth & Outlook
Market Forecast By Type (Non-printing, Printing), By Formulating Technology (Oil-based, Solvent-based, Water-based, UV-cured, Others), By Applications (Packaging, Publication & Commercial, Security, Ceramic Tiles, Tags & Labels, Textiles, Consumer) And Competitive Landscape
| Product Code: ETC5523469 | Publication Date: Nov 2023 | Updated Date: Mar 2026 | Product Type: Market Research Report | |
| Publisher: 6Wresearch | Author: Vasudha | No. of Pages: 60 | No. of Figures: 30 | No. of Tables: 5 |
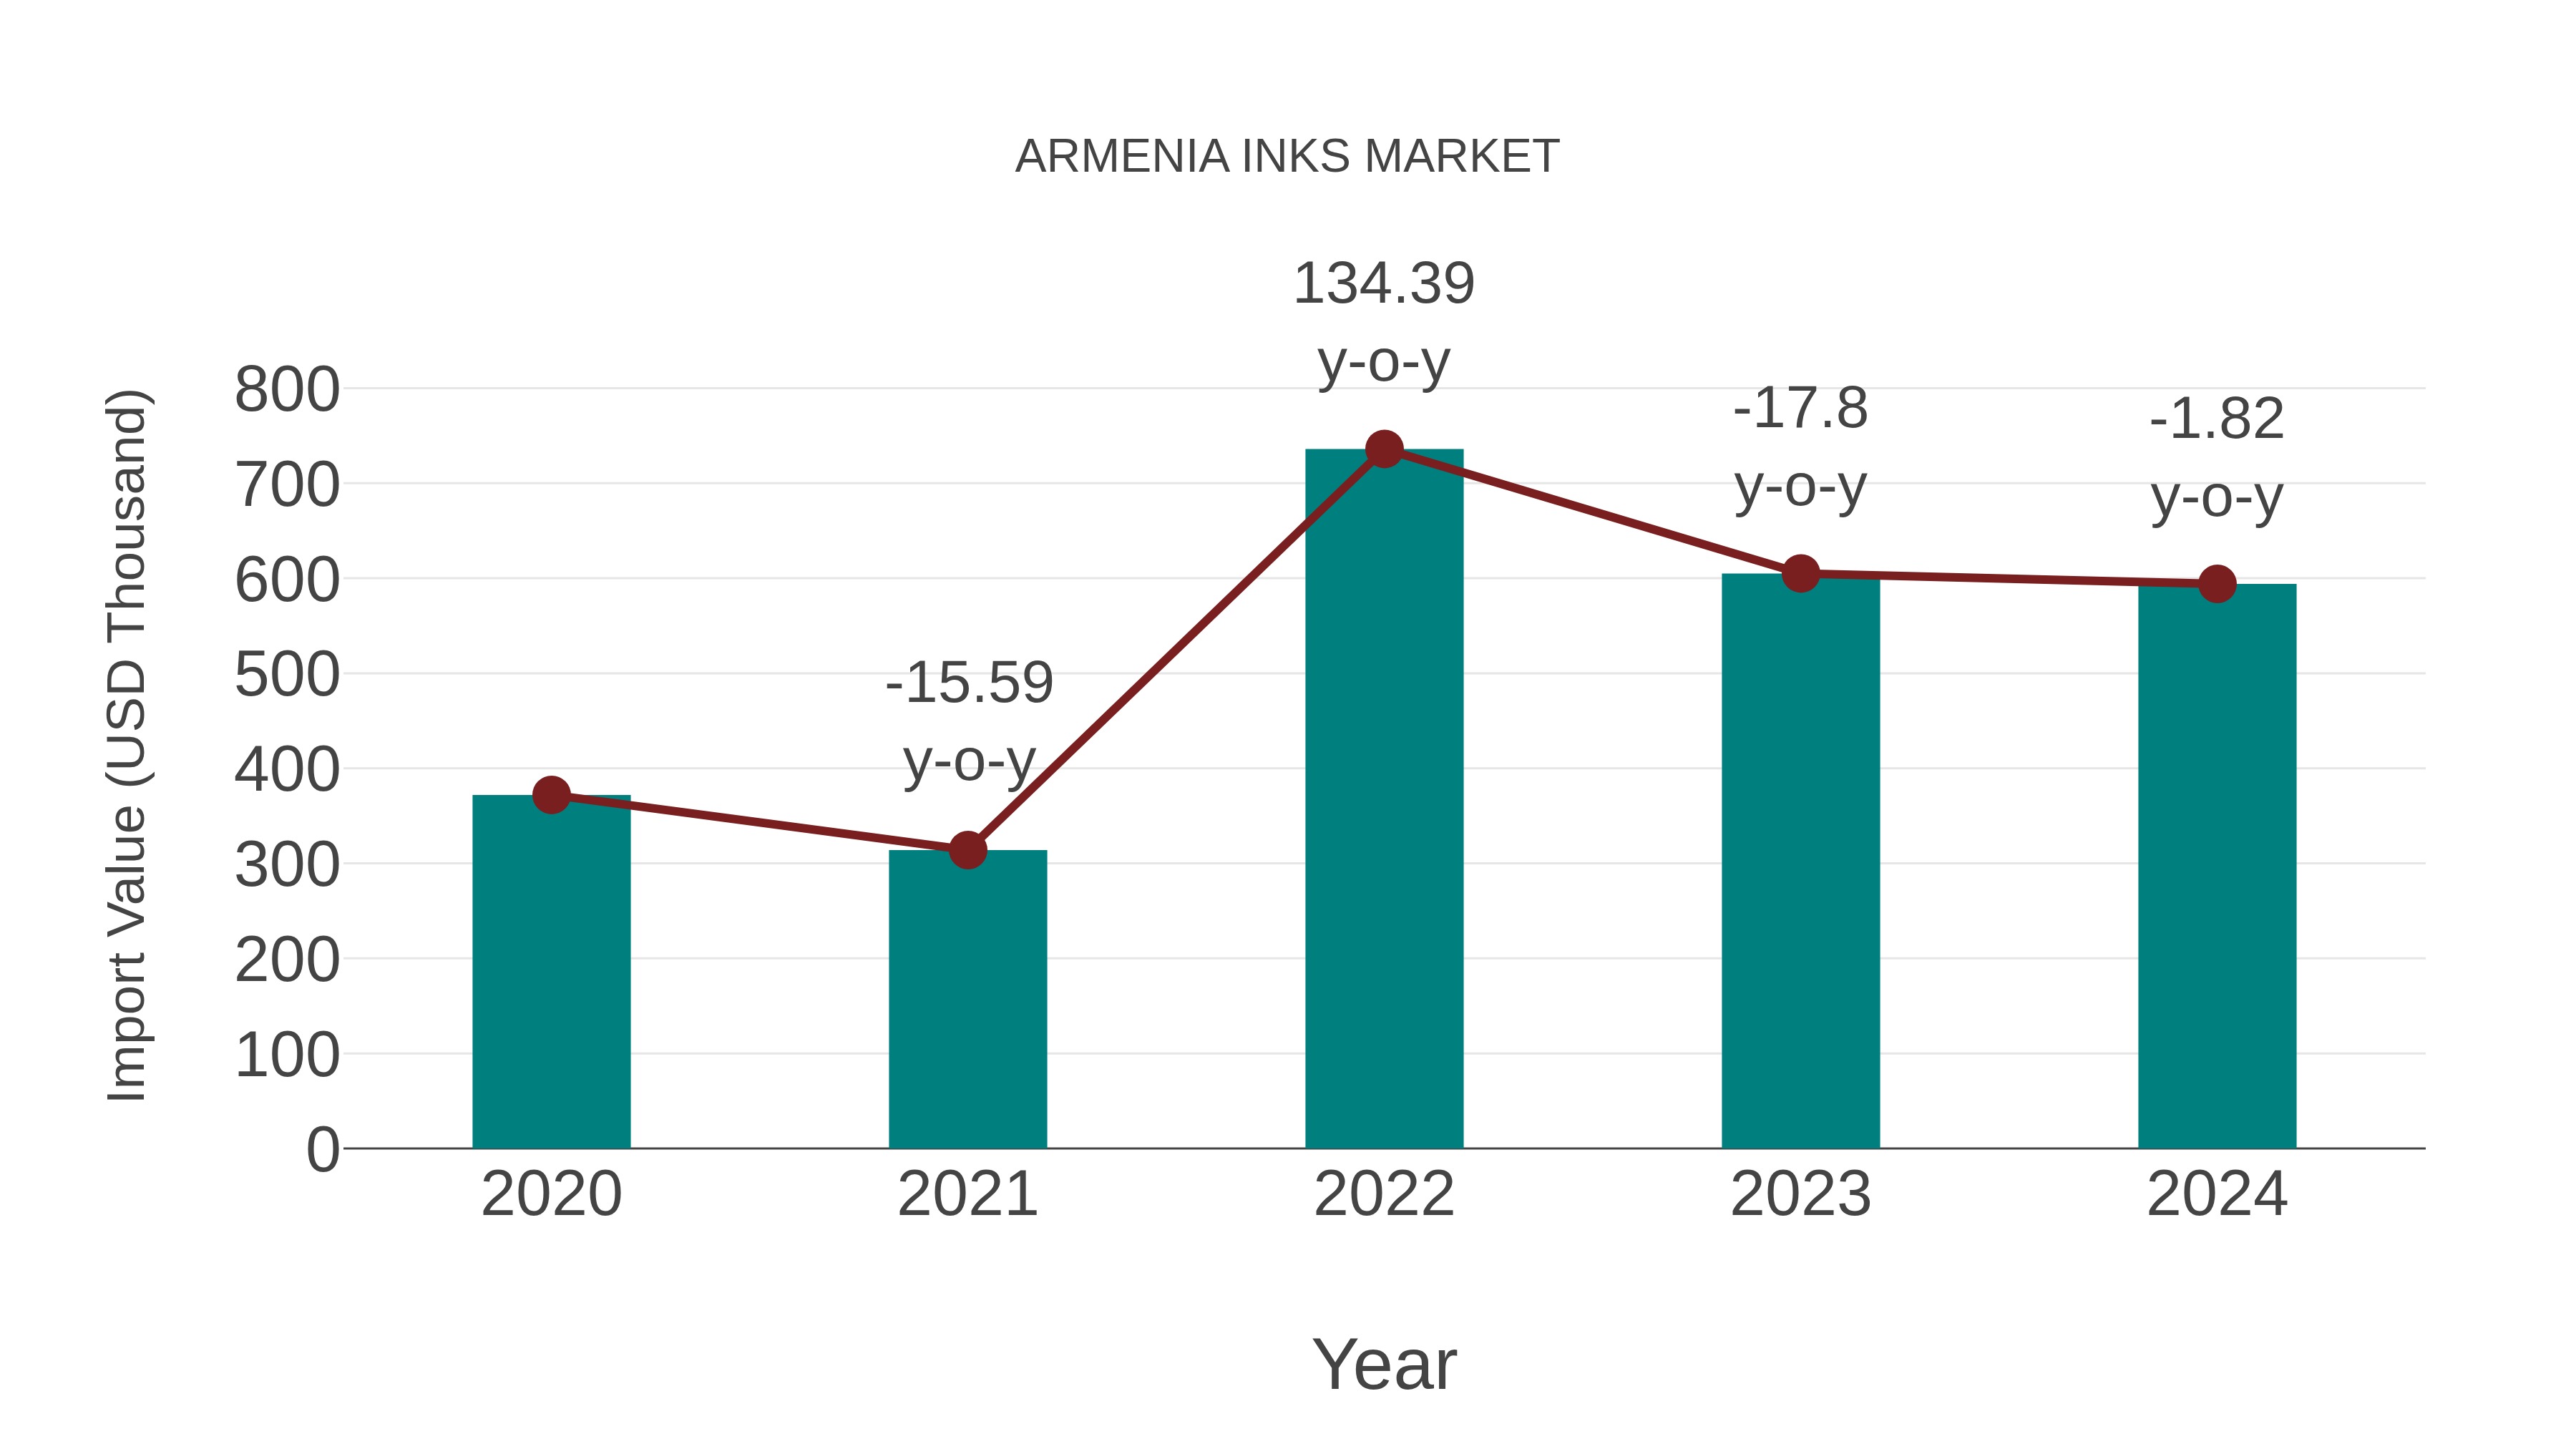
Armenia Inks Market: Import Trend Analysis
Armenia inks market saw a -1.82% growth in imports from 2023 to 2024, with a compound annual growth rate (CAGR) of 12.41% from 2020 to 2024. This decline in import momentum could be attributed to shifts in demand patterns or changes in trade policies impacting market stability.
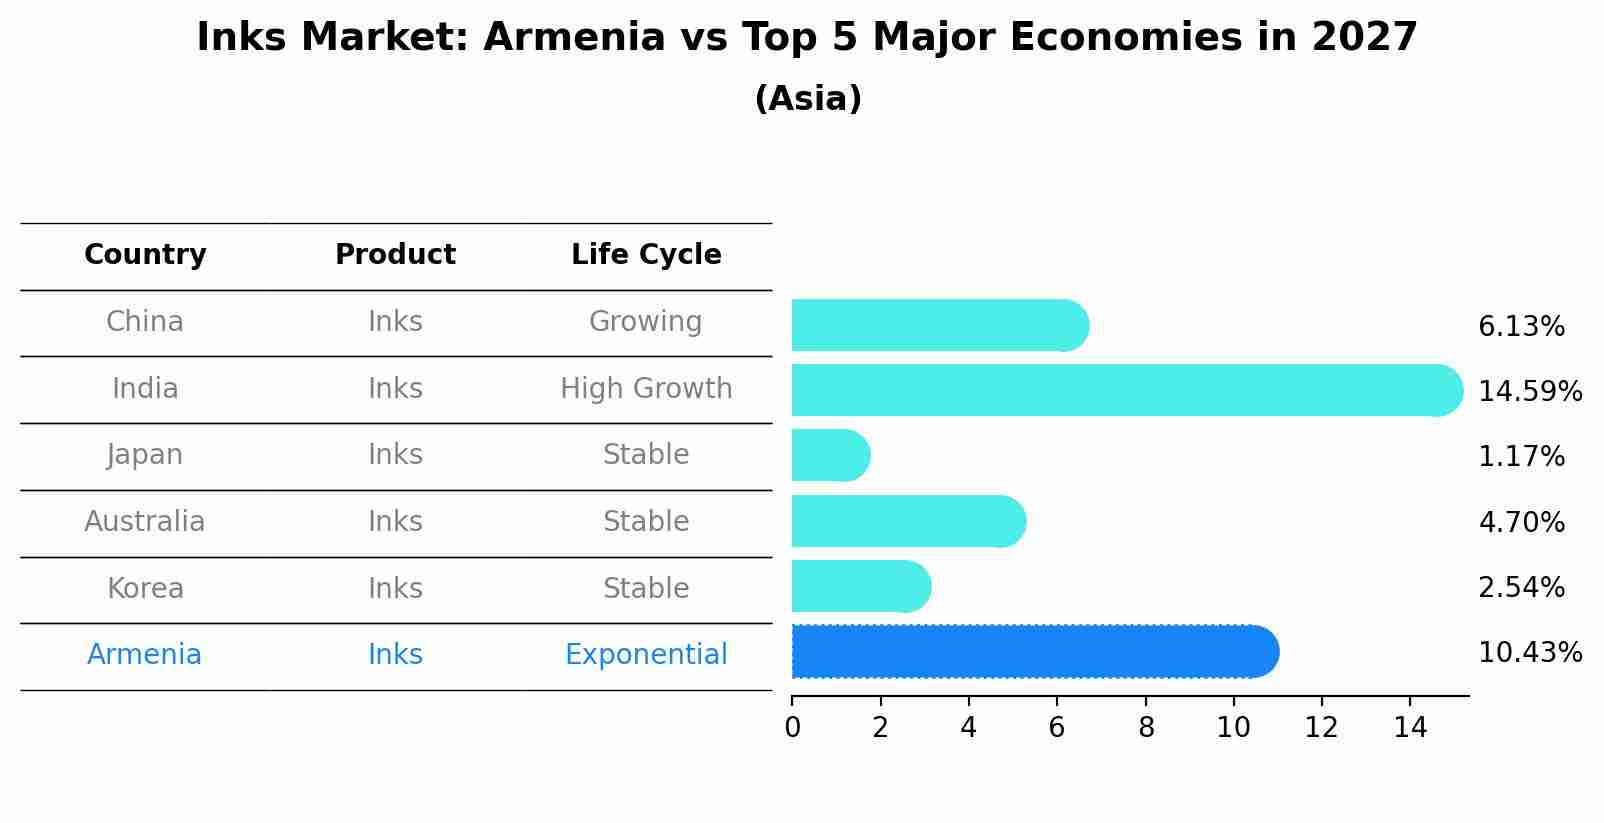
Inks Market: Armenia vs Top 5 Major Economies in 2027 (Asia)
The Inks market in Armenia is projected to grow at a high growth rate of 10.43% by 2027, highlighting the country's increasing focus on advanced technologies within the Asia region, where China holds the dominant position, followed closely by India, Japan, Australia and South Korea, shaping overall regional demand.
Armenia Inks Market Overview
Similar to the ink market, the inks market encompasses the range of ink products used in various applications. It includes advancements in ink formulations and technologies to meet the evolving needs of printing and packaging industries.
Drivers of the market
Expansion in digital printing, textiles, and packaging drives demand for specialized inks in Armenia. Technological advancements in inkjet technology, UV-curable inks, and eco-friendly formulations are key drivers. Economic factors influencing consumer preferences for customized products and regulatory standards for product safety also impact market dynamics.
Challenges of the market
Armenia`s inks market faces challenges such as developing eco-friendly inks with reduced VOC emissions and environmental impact, ensuring inkjet and offset printing compatibility, and addressing price volatility in raw materials affecting ink production costs.
Government Policy of the market
Armenias government is fostering innovation and competitiveness in printing technologies through policies that support the inks market. This includes investments in digital printing solutions, tax incentives for ink manufacturers, and regulatory frameworks to ensure ink safety and performance standards in commercial printing applications.
Key Highlights of the Report:
- Armenia Inks Market Outlook
- Market Size of Armenia Inks Market, 2025
- Forecast of Armenia Inks Market, 2032
- Historical Data and Forecast of Armenia Inks Revenues & Volume for the Period 2022-2032F
- Armenia Inks Market Trend Evolution
- Armenia Inks Market Drivers and Challenges
- Armenia Inks Price Trends
- Armenia Inks Porter`s Five Forces
- Armenia Inks Industry Life Cycle
- Historical Data and Forecast of Armenia Inks Market Revenues & Volume By Type for the Period 2022-2032F
- Historical Data and Forecast of Armenia Inks Market Revenues & Volume By Non-printing for the Period 2022-2032F
- Historical Data and Forecast of Armenia Inks Market Revenues & Volume By Printing for the Period 2022-2032F
- Historical Data and Forecast of Armenia Inks Market Revenues & Volume By Formulating Technology for the Period 2022-2032F
- Historical Data and Forecast of Armenia Inks Market Revenues & Volume By Oil-based for the Period 2022-2032F
- Historical Data and Forecast of Armenia Inks Market Revenues & Volume By Solvent-based for the Period 2022-2032F
- Historical Data and Forecast of Armenia Inks Market Revenues & Volume By Water-based for the Period 2022-2032F
- Historical Data and Forecast of Armenia Inks Market Revenues & Volume By UV-cured for the Period 2022-2032F
- Historical Data and Forecast of Armenia Inks Market Revenues & Volume By Others for the Period 2022-2032F
- Historical Data and Forecast of Armenia Inks Market Revenues & Volume By Applications for the Period 2022-2032F
- Historical Data and Forecast of Armenia Inks Market Revenues & Volume By Packaging for the Period 2022-2032F
- Historical Data and Forecast of Armenia Inks Market Revenues & Volume By Publication & Commercial for the Period 2022-2032F
- Historical Data and Forecast of Armenia Inks Market Revenues & Volume By Security for the Period 2022-2032F
- Historical Data and Forecast of Armenia Inks Market Revenues & Volume By Ceramic Tiles for the Period 2022-2032F
- Historical Data and Forecast of Armenia Inks Market Revenues & Volume By Tags & Labels for the Period 2022-2032F
- Historical Data and Forecast of Armenia Inks Market Revenues & Volume By Textiles for the Period 2022-2032F
- Historical Data and Forecast of Armenia Inks Market Revenues & Volume By Consumer for the Period 2022-2032F
- Armenia Inks Import Export Trade Statistics
- Market Opportunity Assessment By Type
- Market Opportunity Assessment By Formulating Technology
- Market Opportunity Assessment By Applications
- Armenia Inks Top Companies Market Share
- Armenia Inks Competitive Benchmarking By Technical and Operational Parameters
- Armenia Inks Company Profiles
- Armenia Inks Key Strategic Recommendations
Armenia Inks Market (2026-2032): FAQs
6Wresearch actively monitors the Armenia Inks Market and publishes its comprehensive annual report, highlighting emerging trends, growth drivers, revenue analysis, and forecast outlook. Our insights help businesses to make data-backed strategic decisions with ongoing market dynamics. Our analysts track relevent industries related to the Armenia Inks Market, allowing our clients with actionable intelligence and reliable forecasts tailored to emerging regional needs.
Yes, we provide customisation as per your requirements. To learn more, feel free to contact us on sales@6wresearch.com
1 Executive Summary |
2 Introduction |
2.1 Key Highlights of the Report |
2.2 Report Description |
2.3 Market Scope & Segmentation |
2.4 Research Methodology |
2.5 Assumptions |
3 Armenia Inks Market Overview |
3.1 Armenia Country Macro Economic Indicators |
3.2 Armenia Inks Market Revenues & Volume, 2022 & 2032F |
3.3 Armenia Inks Market - Industry Life Cycle |
3.4 Armenia Inks Market - Porter's Five Forces |
3.5 Armenia Inks Market Revenues & Volume Share, By Type, 2022 & 2032F |
3.6 Armenia Inks Market Revenues & Volume Share, By Formulating Technology, 2022 & 2032F |
3.7 Armenia Inks Market Revenues & Volume Share, By Applications, 2022 & 2032F |
4 Armenia Inks Market Dynamics |
4.1 Impact Analysis |
4.2 Market Drivers |
4.2.1 Growing demand for packaged goods in Armenia, leading to increased use of inks for packaging and labeling. |
4.2.2 Technological advancements in ink formulations, such as eco-friendly and sustainable options, driving market growth. |
4.2.3 Increasing investments in the printing and packaging industry in Armenia, boosting the demand for inks. |
4.3 Market Restraints |
4.3.1 Fluctuating raw material prices impacting the production cost of inks. |
4.3.2 Stringent environmental regulations regarding the use of certain chemicals in inks, limiting product innovation and market expansion. |
5 Armenia Inks Market Trends |
6 Armenia Inks Market Segmentations |
6.1 Armenia Inks Market, By Type |
6.1.1 Overview and Analysis |
6.1.2 Armenia Inks Market Revenues & Volume, By Non-printing, 2022-2032F |
6.1.3 Armenia Inks Market Revenues & Volume, By Printing, 2022-2032F |
6.2 Armenia Inks Market, By Formulating Technology |
6.2.1 Overview and Analysis |
6.2.2 Armenia Inks Market Revenues & Volume, By Oil-based, 2022-2032F |
6.2.3 Armenia Inks Market Revenues & Volume, By Solvent-based, 2022-2032F |
6.2.4 Armenia Inks Market Revenues & Volume, By Water-based, 2022-2032F |
6.2.5 Armenia Inks Market Revenues & Volume, By UV-cured, 2022-2032F |
6.2.6 Armenia Inks Market Revenues & Volume, By Others, 2022-2032F |
6.3 Armenia Inks Market, By Applications |
6.3.1 Overview and Analysis |
6.3.2 Armenia Inks Market Revenues & Volume, By Packaging, 2022-2032F |
6.3.3 Armenia Inks Market Revenues & Volume, By Publication & Commercial, 2022-2032F |
6.3.4 Armenia Inks Market Revenues & Volume, By Security, 2022-2032F |
6.3.5 Armenia Inks Market Revenues & Volume, By Ceramic Tiles, 2022-2032F |
6.3.6 Armenia Inks Market Revenues & Volume, By Tags & Labels, 2022-2032F |
6.3.7 Armenia Inks Market Revenues & Volume, By Textiles, 2022-2032F |
7 Armenia Inks Market Import-Export Trade Statistics |
7.1 Armenia Inks Market Export to Major Countries |
7.2 Armenia Inks Market Imports from Major Countries |
8 Armenia Inks Market Key Performance Indicators |
8.1 Percentage of revenue generated from eco-friendly ink products. |
8.2 Adoption rate of digital printing technologies in the Armenian packaging industry. |
8.3 Number of new product launches in the eco-friendly ink segment. |
8.4 Recycling rate of ink cartridges in Armenia. |
8.5 Percentage of ink manufacturers in Armenia investing in research and development for sustainable ink solutions. |
9 Armenia Inks Market - Opportunity Assessment |
9.1 Armenia Inks Market Opportunity Assessment, By Type, 2022 & 2032F |
9.2 Armenia Inks Market Opportunity Assessment, By Formulating Technology, 2022 & 2032F |
9.3 Armenia Inks Market Opportunity Assessment, By Applications, 2022 & 2032F |
10 Armenia Inks Market - Competitive Landscape |
10.1 Armenia Inks Market Revenue Share, By Companies, 2025 |
10.2 Armenia Inks Market Competitive Benchmarking, By Operating and Technical Parameters |
11 Company Profiles |
12 Recommendations | 13 Disclaimer |
Export potential assessment - trade Analytics for 2030
Export potential enables firms to identify high-growth global markets with greater confidence by combining advanced trade intelligence with a structured quantitative methodology. The framework analyzes emerging demand trends and country-level import patterns while integrating macroeconomic and trade datasets such as GDP and population forecasts, bilateral import–export flows, tariff structures, elasticity differentials between developed and developing economies, geographic distance, and import demand projections. Using weighted trade values from 2020–2024 as the base period to project country-to-country export potential for 2030, these inputs are operationalized through calculated drivers such as gravity model parameters, tariff impact factors, and projected GDP per-capita growth. Through an analysis of hidden potentials, demand hotspots, and market conditions that are most favorable to success, this method enables firms to focus on target countries, maximize returns, and global expansion with data, backed by accuracy.
By factoring in the projected importer demand gap that is currently unmet and could be potential opportunity, it identifies the potential for the Exporter (Country) among 190 countries, against the general trade analysis, which identifies the biggest importer or exporter.
To discover high-growth global markets and optimize your business strategy:
Click Here
Pricing
- Single User License$ 1,995
- Department License$ 2,400
- Site License$ 3,120
- Global License$ 3,795

Search
Thought Leadership and Analyst Meet


Our Clients
Latest Reports
- United Kingdom (UK) Long-term Care Insurance Market (2026-2032) | Growth, Share, Consumer Insights, Drivers, Opportunities, Competition, Pricing Analysis, Segments, Restraints, Companies, Competitive, Value, Outlook, Size, Demand, Analysis, Challenges, Strategic Insights, Investment Trends, Revenue, Trends, Supply, Forecast
- United Kingdom (UK) Long Term Care Market (2026-2032) | Companies, Outlook, Analysis, Trends, Value, Revenue, Segmentation, Share, Forecast, Competitive Landscape, Growth, Size & Forecast
- Iraq Insulation and Waterproofing Market (2026-2032) | Outlook, Drivers, Growth, Size, Share, Industry, Revenue, Trends, Demand, Competitive, Strategic Insights, Opportunities, Segments, Companies, Challenges, Strategy, Consumer Insights, Analysis, Investment Trends, Value, Segmentation, Forecast, Restraints
- India Switchgear Market Outlook (2026-2032) | Size, Share, Trends, Growth, Revenue, Forecast, Analysis, Value, Outlook
- Pakistan Contraceptive Implants Market (2025-2031) | Demand, Growth, Size, Share, Industry, Pricing Analysis, Competitive, Strategic Insights, Strategy, Consumer Insights, Analysis, Investment Trends, Opportunities, Revenue, Segments, Value, Segmentation, Supply, Forecast, Restraints, Outlook, Competition, Drivers, Trends, Companies, Challenges
- Sri Lanka Packaging Market (2026-2032) | Outlook, Competition, Drivers, Trends, Demand, Pricing Analysis, Competitive, Strategic Insights, Companies, Challenges, Strategy, Consumer Insights, Analysis, Investment Trends, Opportunities, Growth, Size, Share, Industry, Revenue, Segments, Value, Segmentation, Supply, Forecast, Restraints
- India Kids Watches Market (2026-2032) | Strategy, Consumer Insights, Analysis, Investment Trends, Opportunities, Growth, Size, Share, Industry, Revenue, Segments, Value, Segmentation, Supply, Forecast, Restraints, Outlook, Competition, Drivers, Trends, Demand, Pricing Analysis, Competitive, Strategic Insights, Companies, Challenges
- Saudi Arabia Core Assurance Service Market (2025-2031) | Strategy, Consumer Insights, Analysis, Investment Trends, Opportunities, Growth, Size, Share, Industry, Revenue, Segments, Value, Segmentation, Supply, Forecast, Restraints, Outlook, Competition, Drivers, Trends, Demand, Pricing Analysis, Competitive, Strategic Insights, Companies, Challenges
- Romania Uninterruptible Power Supply (UPS) Market (2026-2032) | Industry, Analysis, Revenue, Size, Forecast, Outlook, Value, Trends, Share, Growth & Companies
- Saudi Arabia Car Window Tinting Film, Paint Protection Film (PPF), and Ceramic Coating Market (2025-2031) | Strategy, Consumer Insights, Analysis, Investment Trends, Opportunities, Growth, Size, Share, Industry, Revenue, Segments, Value, Segmentation, Supply, Forecast, Restraints, Outlook, Competition, Drivers, Trends, Demand, Pricing Analysis, Competitive, Strategic Insights, Companies, Challenges
Industry Events and Analyst Meet

India EV Show 2026

EV tech India Expo 2026

Auto Tech Asia 2026

Battery Tech India 2026

Smart Production Solutions Guangzhou 2026
Whitepaper
- Middle East & Africa Commercial Security Market Click here to view more.
- Middle East & Africa Fire Safety Systems & Equipment Market Click here to view more.
- GCC Drone Market Click here to view more.
- Middle East Lighting Fixture Market Click here to view more.
- GCC Physical & Perimeter Security Market Click here to view more.
6WResearch In News
- Doha a strategic location for EV manufacturing hub: IPA Qatar
- Demand for luxury TVs surging in the GCC, says Samsung
- Empowering Growth: The Thriving Journey of Bangladesh’s Cable Industry
- Demand for luxury TVs surging in the GCC, says Samsung
- Video call with a traditional healer? Once unthinkable, it’s now common in South Africa
- Intelligent Buildings To Smooth GCC’s Path To Net Zero