Armenia Interactive Whiteboard Market (2026-2032) | Industry, Revenue, Growth, Share, Companies, Segmentation, Trends, Size, Analysis, Forecast, Outlook & Value
Market Forecast By Screen Size (Up to 69", 70"-90", Above 90"), By Technology (Infrared, Resistive, Capacitive, Electromagnetic), By End User (Education, Corporate, Government) And Competitive Landscape
| Product Code: ETC5595023 | Publication Date: Nov 2023 | Updated Date: Mar 2026 | Product Type: Market Research Report | |
| Publisher: 6Wresearch | Author: Vasudha | No. of Pages: 60 | No. of Figures: 30 | No. of Tables: 5 |
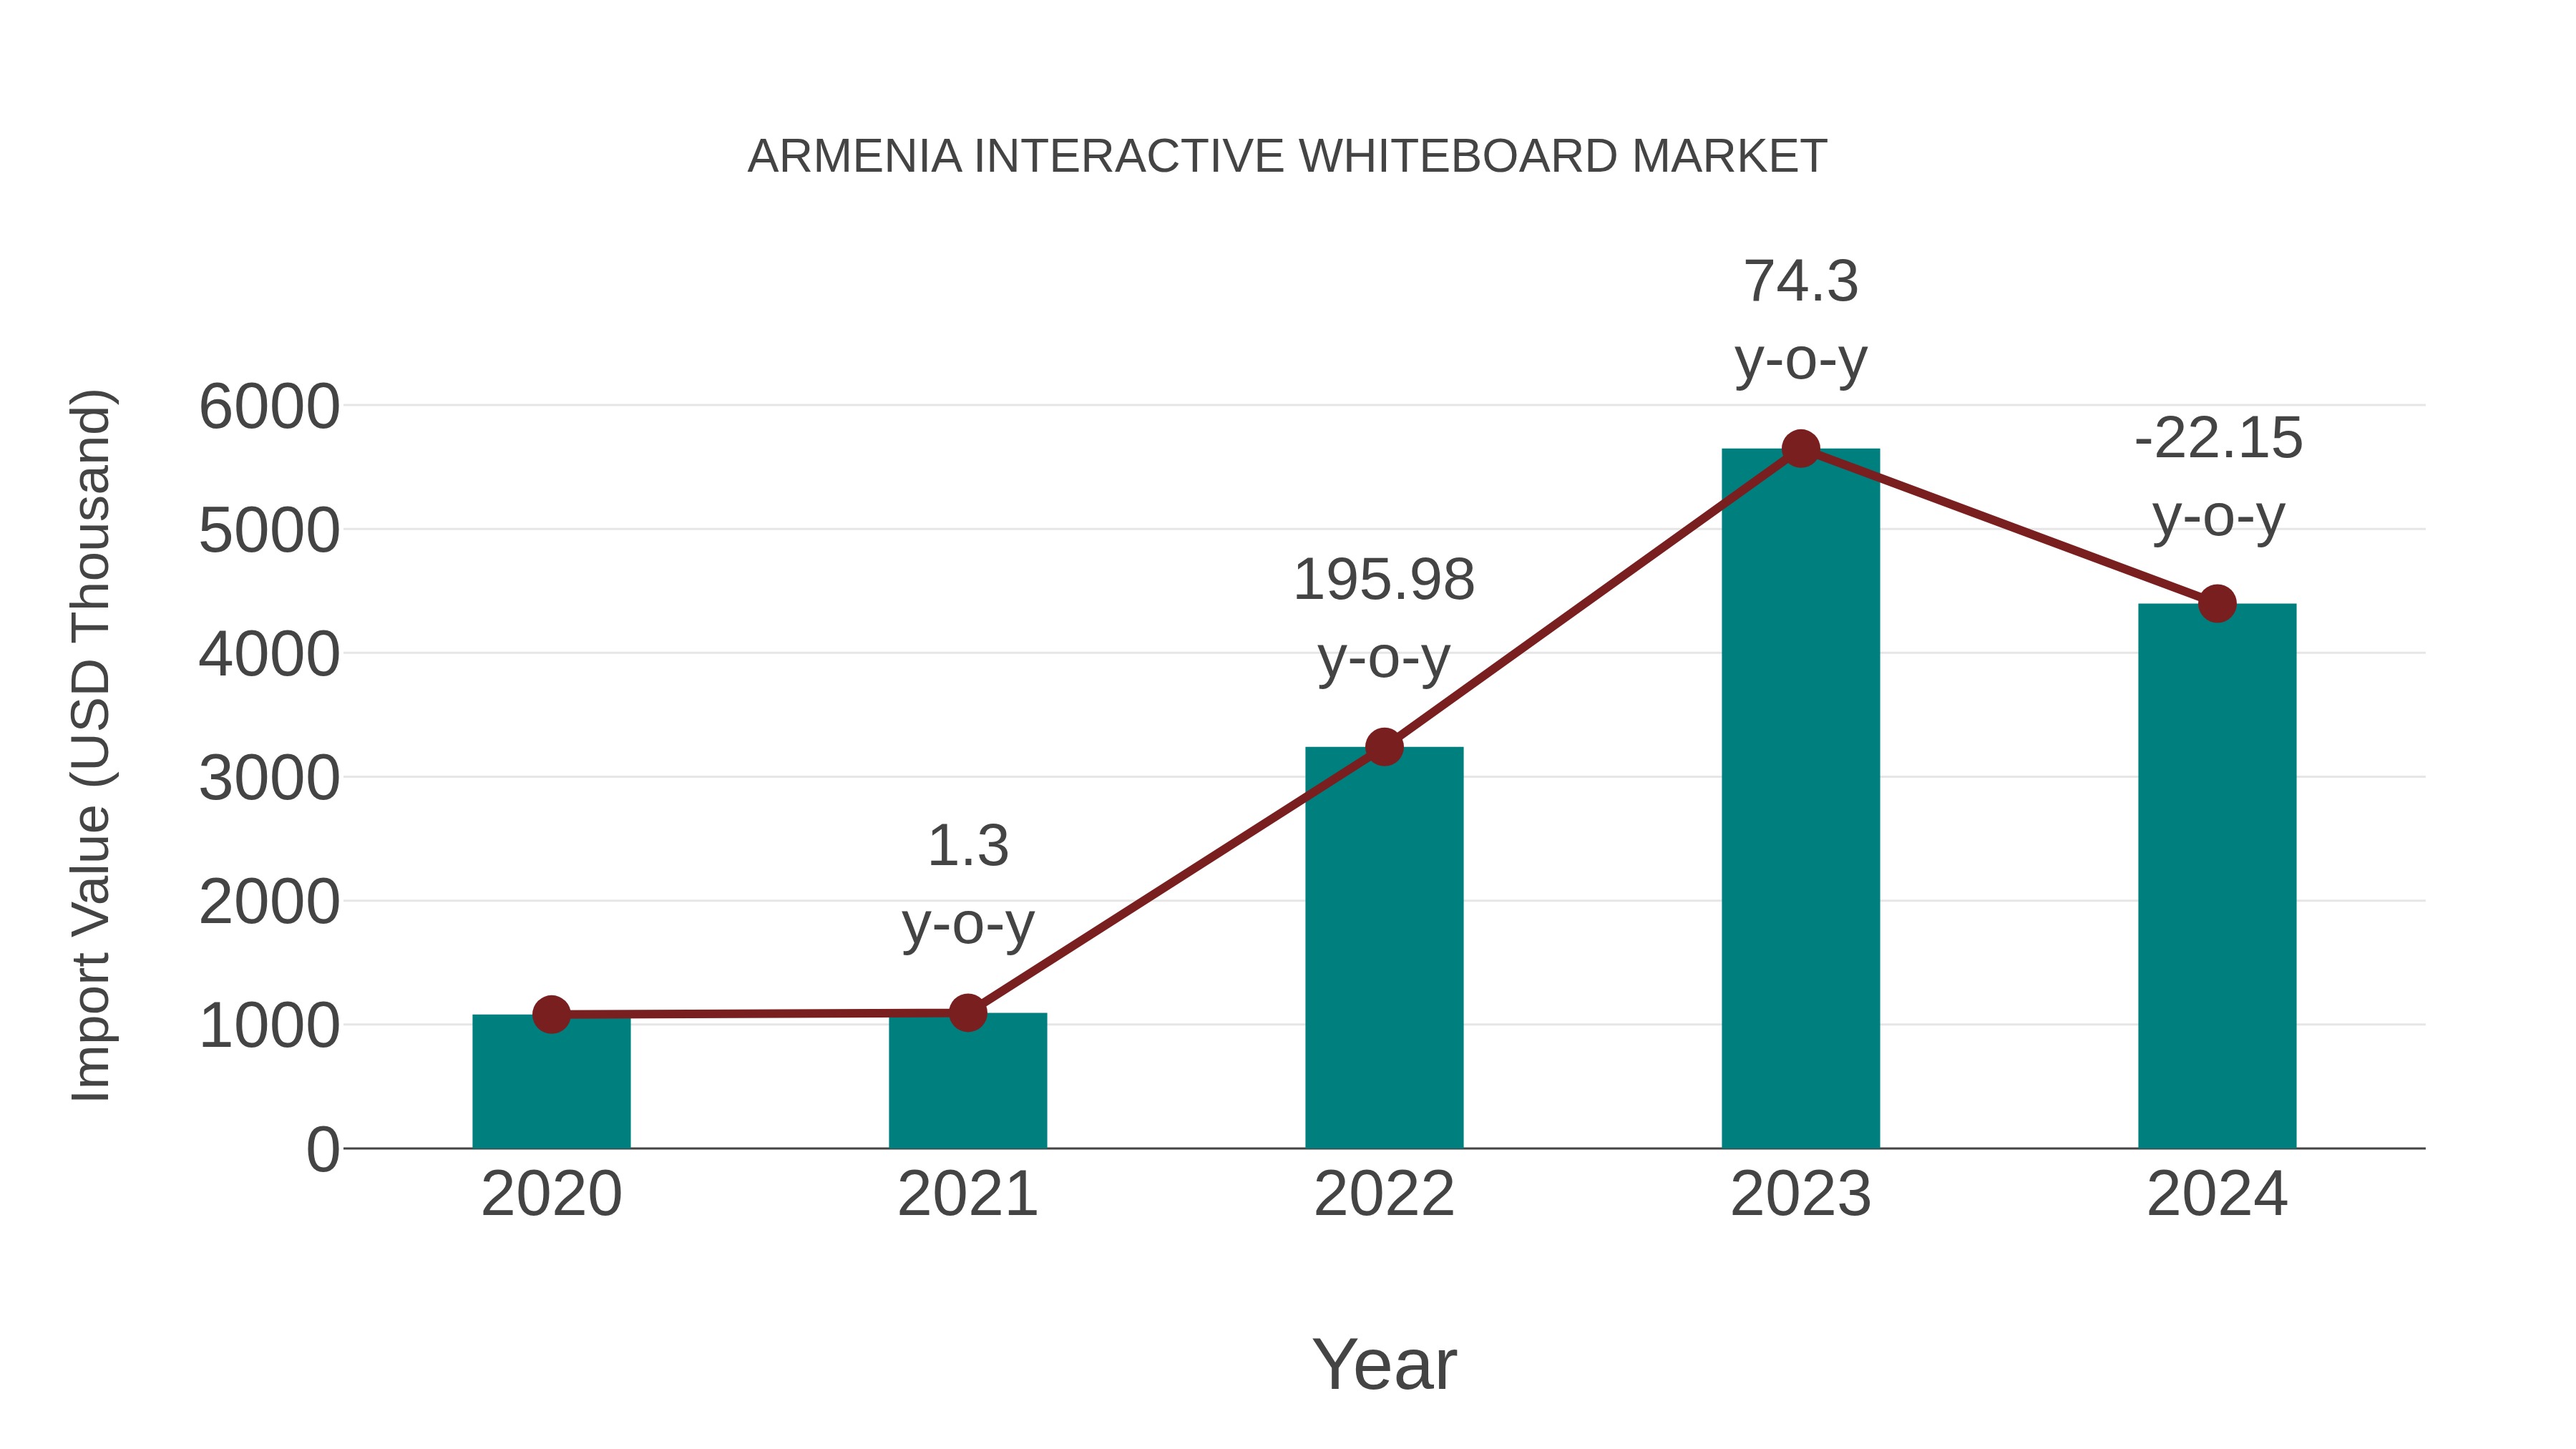
Armenia Interactive Whiteboard Market: Import Trend Analysis
Armenia import trend for the interactive whiteboard market showed a decline with a growth rate of -22.15% from 2023 to 2024, while the compound annual growth rate (CAGR) for 2020-2024 stood at 42.02%. This decrease could be attributed to shifts in demand dynamics or changes in trade policies impacting market stability.
Armenia Interactive Whiteboard Market Overview
This market includes digital whiteboards that allow users to write, draw, and interact with content using touch or stylus input. Interactive whiteboards are widely used in educational institutions, corporate meetings, and training sessions to enhance collaboration and learning.
Drivers of the market
Education and corporate sectors use interactive whiteboards for collaborative learning and meetings. The market is driven by technological advancements in display and touch technology, remote learning trends, and the shift towards digital classrooms.
Challenges of the market
Challenges in the interactive whiteboard market include enhancing whiteboard functionality with multimedia and collaborative features, ensuring compatibility with educational and corporate IT infrastructures, and managing costs associated with digital whiteboard adoption.
Government Policy of the market
Armenia`s education sector benefits from government initiatives promoting digital learning environments, boosting demand for interactive whiteboards. Policies emphasize technology integration in classrooms to improve educational outcomes.
Key Highlights of the Report:
- Armenia Interactive Whiteboard Market Outlook
- Market Size of Armenia Interactive Whiteboard Market, 2025
- Forecast of Armenia Interactive Whiteboard Market, 2032
- Historical Data and Forecast of Armenia Interactive Whiteboard Revenues & Volume for the Period 2022-2032F
- Armenia Interactive Whiteboard Market Trend Evolution
- Armenia Interactive Whiteboard Market Drivers and Challenges
- Armenia Interactive Whiteboard Price Trends
- Armenia Interactive Whiteboard Porter`s Five Forces
- Armenia Interactive Whiteboard Industry Life Cycle
- Historical Data and Forecast of Armenia Interactive Whiteboard Market Revenues & Volume By Screen Size for the Period 2022-2032F
- Historical Data and Forecast of Armenia Interactive Whiteboard Market Revenues & Volume By Up to 69" for the Period 2022-2032F
- Historical Data and Forecast of Armenia Interactive Whiteboard Market Revenues & Volume By 70"-90" for the Period 2022-2032F
- Historical Data and Forecast of Armenia Interactive Whiteboard Market Revenues & Volume By Above 90" for the Period 2022-2032F
- Historical Data and Forecast of Armenia Interactive Whiteboard Market Revenues & Volume By Technology for the Period 2022-2032F
- Historical Data and Forecast of Armenia Interactive Whiteboard Market Revenues & Volume By Infrared for the Period 2022-2032F
- Historical Data and Forecast of Armenia Interactive Whiteboard Market Revenues & Volume By Resistive for the Period 2022-2032F
- Historical Data and Forecast of Armenia Interactive Whiteboard Market Revenues & Volume By Capacitive for the Period 2022-2032F
- Historical Data and Forecast of Armenia Interactive Whiteboard Market Revenues & Volume By Electromagnetic for the Period 2022-2032F
- Historical Data and Forecast of Armenia Interactive Whiteboard Market Revenues & Volume By End User for the Period 2022-2032F
- Historical Data and Forecast of Armenia Interactive Whiteboard Market Revenues & Volume By Education for the Period 2022-2032F
- Historical Data and Forecast of Armenia Interactive Whiteboard Market Revenues & Volume By Corporate for the Period 2022-2032F
- Historical Data and Forecast of Armenia Interactive Whiteboard Market Revenues & Volume By Government for the Period 2022-2032F
- Armenia Interactive Whiteboard Import Export Trade Statistics
- Market Opportunity Assessment By Screen Size
- Market Opportunity Assessment By Technology
- Market Opportunity Assessment By End User
- Armenia Interactive Whiteboard Top Companies Market Share
- Armenia Interactive Whiteboard Competitive Benchmarking By Technical and Operational Parameters
- Armenia Interactive Whiteboard Company Profiles
- Armenia Interactive Whiteboard Key Strategic Recommendations
Armenia Interactive Whiteboard Market (2026-2032): FAQs
6Wresearch actively monitors the Armenia Interactive Whiteboard Market and publishes its comprehensive annual report, highlighting emerging trends, growth drivers, revenue analysis, and forecast outlook. Our insights help businesses to make data-backed strategic decisions with ongoing market dynamics. Our analysts track relevent industries related to the Armenia Interactive Whiteboard Market, allowing our clients with actionable intelligence and reliable forecasts tailored to emerging regional needs.
Yes, we provide customisation as per your requirements. To learn more, feel free to contact us on sales@6wresearch.com
1 Executive Summary |
2 Introduction |
2.1 Key Highlights of the Report |
2.2 Report Description |
2.3 Market Scope & Segmentation |
2.4 Research Methodology |
2.5 Assumptions |
3 Armenia Interactive Whiteboard Market Overview |
3.1 Armenia Country Macro Economic Indicators |
3.2 Armenia Interactive Whiteboard Market Revenues & Volume, 2022 & 2032F |
3.3 Armenia Interactive Whiteboard Market - Industry Life Cycle |
3.4 Armenia Interactive Whiteboard Market - Porter's Five Forces |
3.5 Armenia Interactive Whiteboard Market Revenues & Volume Share, By Screen Size , 2022 & 2032F |
3.6 Armenia Interactive Whiteboard Market Revenues & Volume Share, By Technology , 2022 & 2032F |
3.7 Armenia Interactive Whiteboard Market Revenues & Volume Share, By End User , 2022 & 2032F |
4 Armenia Interactive Whiteboard Market Dynamics |
4.1 Impact Analysis |
4.2 Market Drivers |
4.2.1 Increasing adoption of digital learning tools and technology in educational institutions in Armenia |
4.2.2 Growing emphasis on interactive and engaging teaching methods |
4.2.3 Government initiatives to enhance technology integration in schools and universities |
4.3 Market Restraints |
4.3.1 High initial setup costs for interactive whiteboard technology |
4.3.2 Limited awareness and technical know-how among educators and institutions |
4.3.3 Lack of consistent maintenance and support services for interactive whiteboards |
5 Armenia Interactive Whiteboard Market Trends |
6 Armenia Interactive Whiteboard Market Segmentations |
6.1 Armenia Interactive Whiteboard Market, By Screen Size |
6.1.1 Overview and Analysis |
6.1.2 Armenia Interactive Whiteboard Market Revenues & Volume, By Up to 69", 2022-2032F |
6.1.3 Armenia Interactive Whiteboard Market Revenues & Volume, By 70"-90", 2022-2032F |
6.1.4 Armenia Interactive Whiteboard Market Revenues & Volume, By Above 90", 2022-2032F |
6.2 Armenia Interactive Whiteboard Market, By Technology |
6.2.1 Overview and Analysis |
6.2.2 Armenia Interactive Whiteboard Market Revenues & Volume, By Infrared, 2022-2032F |
6.2.3 Armenia Interactive Whiteboard Market Revenues & Volume, By Resistive, 2022-2032F |
6.2.4 Armenia Interactive Whiteboard Market Revenues & Volume, By Capacitive, 2022-2032F |
6.2.5 Armenia Interactive Whiteboard Market Revenues & Volume, By Electromagnetic, 2022-2032F |
6.3 Armenia Interactive Whiteboard Market, By End User |
6.3.1 Overview and Analysis |
6.3.2 Armenia Interactive Whiteboard Market Revenues & Volume, By Education, 2022-2032F |
6.3.3 Armenia Interactive Whiteboard Market Revenues & Volume, By Corporate, 2022-2032F |
6.3.4 Armenia Interactive Whiteboard Market Revenues & Volume, By Government, 2022-2032F |
7 Armenia Interactive Whiteboard Market Import-Export Trade Statistics |
7.1 Armenia Interactive Whiteboard Market Export to Major Countries |
7.2 Armenia Interactive Whiteboard Market Imports from Major Countries |
8 Armenia Interactive Whiteboard Market Key Performance Indicators |
8.1 Percentage increase in the number of educational institutions using interactive whiteboards |
8.2 Average time spent by teachers and students using interactive whiteboards per session |
8.3 Rate of adoption of interactive whiteboard technology in new schools and universities |
9 Armenia Interactive Whiteboard Market - Opportunity Assessment |
9.1 Armenia Interactive Whiteboard Market Opportunity Assessment, By Screen Size , 2022 & 2032F |
9.2 Armenia Interactive Whiteboard Market Opportunity Assessment, By Technology , 2022 & 2032F |
9.3 Armenia Interactive Whiteboard Market Opportunity Assessment, By End User , 2022 & 2032F |
10 Armenia Interactive Whiteboard Market - Competitive Landscape |
10.1 Armenia Interactive Whiteboard Market Revenue Share, By Companies, 2025 |
10.2 Armenia Interactive Whiteboard Market Competitive Benchmarking, By Operating and Technical Parameters |
11 Company Profiles |
12 Recommendations | 13 Disclaimer |
Export potential assessment - trade Analytics for 2030
Export potential enables firms to identify high-growth global markets with greater confidence by combining advanced trade intelligence with a structured quantitative methodology. The framework analyzes emerging demand trends and country-level import patterns while integrating macroeconomic and trade datasets such as GDP and population forecasts, bilateral import–export flows, tariff structures, elasticity differentials between developed and developing economies, geographic distance, and import demand projections. Using weighted trade values from 2020–2024 as the base period to project country-to-country export potential for 2030, these inputs are operationalized through calculated drivers such as gravity model parameters, tariff impact factors, and projected GDP per-capita growth. Through an analysis of hidden potentials, demand hotspots, and market conditions that are most favorable to success, this method enables firms to focus on target countries, maximize returns, and global expansion with data, backed by accuracy.
By factoring in the projected importer demand gap that is currently unmet and could be potential opportunity, it identifies the potential for the Exporter (Country) among 190 countries, against the general trade analysis, which identifies the biggest importer or exporter.
To discover high-growth global markets and optimize your business strategy:
Click Here
Pricing
- Single User License$ 1,995
- Department License$ 2,400
- Site License$ 3,120
- Global License$ 3,795

Search
Thought Leadership and Analyst Meet


Our Clients
Latest Reports
- Taiwan Food Delivery Platform Market (2026-2032) | Companies, Outlook, Analysis, Trends, Value, Revenue, Segmentation, Share, Forecast, Competitive Landscape, Growth, Size & Forecast
- United Kingdom (UK) Long-term Care Insurance Market (2026-2032) | Growth, Share, Consumer Insights, Drivers, Opportunities, Competition, Pricing Analysis, Segments, Restraints, Companies, Competitive, Value, Outlook, Size, Demand, Analysis, Challenges, Strategic Insights, Investment Trends, Revenue, Trends, Supply, Forecast
- United Kingdom (UK) Long Term Care Market (2026-2032) | Companies, Outlook, Analysis, Trends, Value, Revenue, Segmentation, Share, Forecast, Competitive Landscape, Growth, Size & Forecast
- Iraq Insulation and Waterproofing Market (2026-2032) | Outlook, Drivers, Growth, Size, Share, Industry, Revenue, Trends, Demand, Competitive, Strategic Insights, Opportunities, Segments, Companies, Challenges, Strategy, Consumer Insights, Analysis, Investment Trends, Value, Segmentation, Forecast, Restraints
- India Switchgear Market Outlook (2026-2032) | Size, Share, Trends, Growth, Revenue, Forecast, Analysis, Value, Outlook
- Pakistan Contraceptive Implants Market (2025-2031) | Demand, Growth, Size, Share, Industry, Pricing Analysis, Competitive, Strategic Insights, Strategy, Consumer Insights, Analysis, Investment Trends, Opportunities, Revenue, Segments, Value, Segmentation, Supply, Forecast, Restraints, Outlook, Competition, Drivers, Trends, Companies, Challenges
- Sri Lanka Packaging Market (2026-2032) | Outlook, Competition, Drivers, Trends, Demand, Pricing Analysis, Competitive, Strategic Insights, Companies, Challenges, Strategy, Consumer Insights, Analysis, Investment Trends, Opportunities, Growth, Size, Share, Industry, Revenue, Segments, Value, Segmentation, Supply, Forecast, Restraints
- India Kids Watches Market (2026-2032) | Strategy, Consumer Insights, Analysis, Investment Trends, Opportunities, Growth, Size, Share, Industry, Revenue, Segments, Value, Segmentation, Supply, Forecast, Restraints, Outlook, Competition, Drivers, Trends, Demand, Pricing Analysis, Competitive, Strategic Insights, Companies, Challenges
- Saudi Arabia Core Assurance Service Market (2025-2031) | Strategy, Consumer Insights, Analysis, Investment Trends, Opportunities, Growth, Size, Share, Industry, Revenue, Segments, Value, Segmentation, Supply, Forecast, Restraints, Outlook, Competition, Drivers, Trends, Demand, Pricing Analysis, Competitive, Strategic Insights, Companies, Challenges
- Romania Uninterruptible Power Supply (UPS) Market (2026-2032) | Industry, Analysis, Revenue, Size, Forecast, Outlook, Value, Trends, Share, Growth & Companies
Industry Events and Analyst Meet

India EV Show 2026

EV tech India Expo 2026

Auto Tech Asia 2026

Battery Tech India 2026

Smart Production Solutions Guangzhou 2026
Whitepaper
- Middle East & Africa Commercial Security Market Click here to view more.
- Middle East & Africa Fire Safety Systems & Equipment Market Click here to view more.
- GCC Drone Market Click here to view more.
- Middle East Lighting Fixture Market Click here to view more.
- GCC Physical & Perimeter Security Market Click here to view more.
6WResearch In News
- Doha a strategic location for EV manufacturing hub: IPA Qatar
- Demand for luxury TVs surging in the GCC, says Samsung
- Empowering Growth: The Thriving Journey of Bangladesh’s Cable Industry
- Demand for luxury TVs surging in the GCC, says Samsung
- Video call with a traditional healer? Once unthinkable, it’s now common in South Africa
- Intelligent Buildings To Smooth GCC’s Path To Net Zero