Australia Aliphatic Solvents and Thinners Market (2026-2032) | Forecast, Revenue, Trends, Outlook, Analysis, Growth, Companies, Share, Value, Size & Industry
Market Forecast By Type (Varnish Makers’ & Painters’ Naphtha, Mineral Spirits, Hexane, Heptane, Others), By Applications (Paints & Coatings, Cleaning & Degreasing, Adhesives, Aerosols, Rubbers & polymers, Printing inks, Others) And Competitive Landscape
| Product Code: ETC029515 | Publication Date: Oct 2020 | Updated Date: Jun 2026 | Product Type: Report | |
| Publisher: 6Wresearch | Author: Ravi Bhandari | No. of Pages: 70 | No. of Figures: 35 | No. of Tables: 5 |
Australia Aliphatic Solvents and Thinners Market Summary
The australia aliphatic solvents and thinners market was estimated at USD 222 Million in 2025 and is projected to reach USD 261 Million by 2032, growing at a CAGR of 2.4% from 2026 to 2032.
Australia Aliphatic Solvents and Thinners Market Growth Rate Analysis (2021-2032)
The Australian aliphatic solvents and thinners market has experienced a notable rebound after a slight contraction of -0.4% in 2021. In 2022, growth surged to 5.8%, primarily driven by increased industrial activity and recovering consumer demand post-pandemic. This upward trend continued into 2023 with a robust growth rate of 4.9%, supported by ongoing investments in infrastructure and a shift toward eco-friendly solvents. As we look ahead, projections indicate a steady expansion, with anticipated growth rates of 2.8% in 2024 and 2.6% by 2032, reflecting stable demand amidst evolving regulatory frameworks and a focus on sustainable practices, ensuring long-term viability for the market.
Australia Aliphatic Solvents and Thinners Market Year-wise Growth Rate and Key Drivers
This graph highlights how the Australia Aliphatic Solvents and Thinners Market has steadily grown over the past five years, supported by major growth factors.
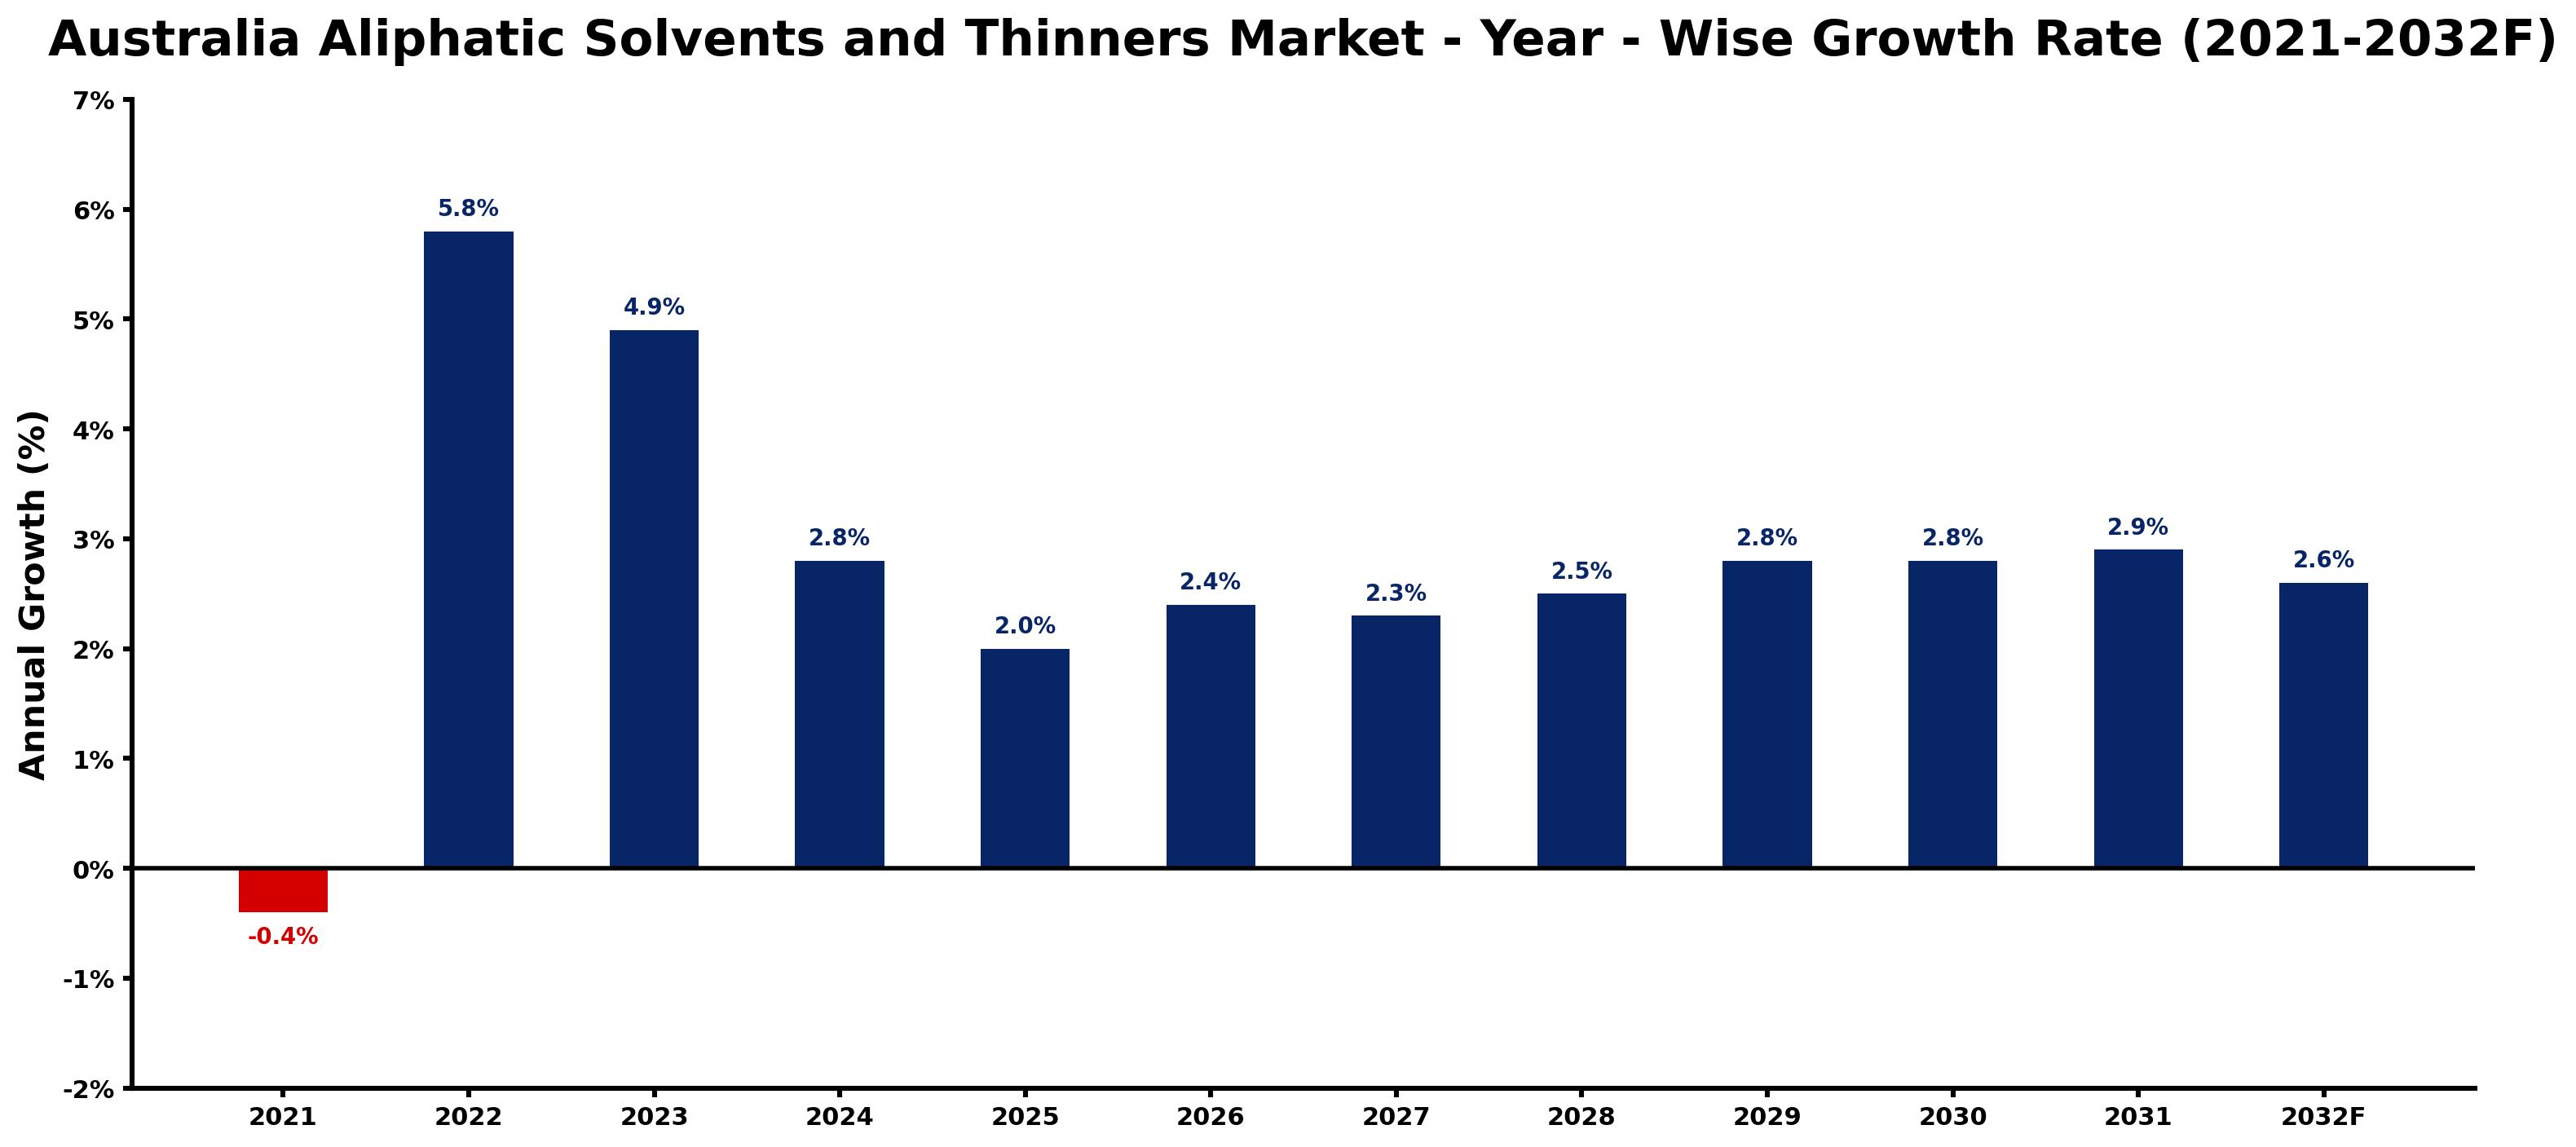
The table below presents the year wise growth rates along with the key drivers influencing the market
| Year | Growth Rate | Major Drivers |
| 2021 | -0.4% | Supply chain disruptions severely impacted the availability of key raw materials, hindering market stability. |
| 2022 | 5.8% | Legacy manufacturing processes prompted shifts toward more eco-friendly solvent alternatives. |
| 2023 | 4.9% | Corporate sustainability targets fueled interest in biodegradable thinners among manufacturers. |
| 2024 | 2.8% | Local industries increased reliance on domestic production to mitigate supply chain disruptions. |
| 2025 | 2.0% | Emerging automotive sectors required specialized solvents for advanced coatings and finishes. |
| 2026 | 2.4% | Rising construction activity across urban areas drove solvent use in building applications. |
| 2027 | 2.3% | Technological innovations in paint formulations led to enhanced performance of aliphatic solvents. |
| 2028 | 2.5% | Consumer preference for high-quality finishes resulted in a surge for premium thinners. |
| 2029 | 2.8% | Sustainability initiatives encouraged brands to adopt greener solvent formulations industry-wide. |
| 2030 | 2.8% | Market consolidation among key players improved distribution networks for solvent products. |
| 2031 | 2.9% | Investment in research on solvent recycling methods gained traction within the industry. |
| 2032 | 2.6% | Regulatory shifts toward stricter emission controls spurred innovation in solvent production. |
Note - Market size estimations and growth projections presented in this report are based on 6Wresearch's advanced forecasting approach, validated with industry datasets as of June 2026.
Australia Aliphatic Solvents and Thinners Market Synopsis
The Australia Aliphatic Solvents and Thinners Market is projected to reach 2.4% and witness significant growth during the forecast period (2026-2032). This market comprises a diverse range of solvents, primarily derived from aliphatic hydrocarbons, including mineral spirits, petroleum naphtha, and hexane. These solvents serve critical roles as diluents, carriers, and cleaning agents across various applications, such as paints, coatings, adhesives, and industrial processes. Their low toxicity and high solvency capabilities make them vital in meeting the demands of contemporary industrial applications.
Australia Aliphatic Solvents and Thinners Market Growth Drivers
The growth of the Australia aliphatic solvents and thinners market is fueled by several key factors:
- The expanding industrial sector in Australia contributes significantly to the demand for aliphatic solvents, particularly in manufacturing processes that require high-performance diluents.
- Increase in construction activities, driven by urbanization and infrastructure development, has led to a spike in the use of paints and coatings, further propelling market growth.
- There is a growing emphasis on eco-friendly, low-VOC formulations, which paves the way for aliphatic solvents due to their favorable environmental profiles.
- The shift toward water-based and high-solid content formulations necessitates the use of aliphatic solvents, aligning with regulatory requirements and consumer preferences for sustainable solutions.
- Ongoing research into bio-based and renewable aliphatic solvents is expected to drive innovation, enhancing product offerings and market sustainability.
Australia Aliphatic Solvents and Thinners Market Challenges and Restraints
Despite the positive outlook, several challenges persist within the Australia aliphatic solvents and thinners market:
- The availability of raw materials can pose a challenge for manufacturers, particularly as demand increases and competition for these resources intensifies.
- Energy consumption during the production processes raises concerns regarding operational costs and environmental impact, necessitating improvements in efficiency.
- The environmental footprint of traditional solvent production processes must be addressed, prompting manufacturers to adopt eco-friendlier practices.
- Market players must navigate the complexities of regulatory compliance to ensure adherence to safety and environmental standards, which can impact operational flexibility.
- Shifts in consumer preferences toward even lower-emission products may require ongoing adjustments in product formulations and marketing strategies.
Australia Aliphatic Solvents and Thinners Market Government Investment and Initiatives
The Australian government plays a critical role in shaping the aliphatic solvents and thinners market through various policies and initiatives aimed at enhancing public health and environmental quality:
- Regulatory frameworks govern the manufacturing, distribution, and use of chemicals, ensuring that safety standards are maintained to protect public health.
- Government initiatives often focus on reducing emissions from industrial processes, which influences the formulation and utilization of aliphatic solvents.
- Public spending on infrastructure and construction projects has increased, providing a boost to the demand for additional industrial materials, including solvents.
- Incentives for adopting sustainable practices encourage manufacturers to invest in the development of eco-friendly alternatives within the market.
- Collaboration between government and industry stakeholders fosters innovation and sustainability, driving advancements in raw material sourcing and product development.
Australia Aliphatic Solvents and Thinners Market Latest Developments (May 2025 - June 2026)
The period from May 2025 to June 2026 has witnessed several notable developments within the Australia aliphatic solvents and thinners market:
- There has been an increasing focus on the development of bio-based solvent alternatives, with researchers exploring new formulations to meet eco-friendly demands.
- Innovation in production technologies aims to enhance energy efficiency and reduce waste, aligning with broader environmental goals.
- Regulatory changes have prompted industries to adapt rapidly, leading to an influx of new product offerings that comply with updated safety and environmental standards.
- Collaboration among industry players has risen, fostering partnerships focused on research and development initiatives aimed at sustainability.
- Market participants are actively engaging with stakeholders to align their offerings with evolving consumer expectations, particularly in regard to low-VOC products.
Australia Aliphatic Solvents and Thinners Market - Key Attractiveness of the Report
- 10 Years of Market Numbers
- Historical Data Starting from 2022 to 2025
- Base Year: 2025
- Forecast Data until 2032
- Key Performance Indicators Impacting the Market
- Major Upcoming Developments and Projects
Key Highlights of the Report:
- Australia Aliphatic Solvents and Thinners Market Outlook
- Market Size of Australia Aliphatic Solvents and Thinners Market, 2025
- Forecast of Australia Aliphatic Solvents and Thinners Market, 2032
- Historical Data and Forecast of Australia Aliphatic Solvents and Thinners Revenues & Volume for the Period 2022-2032F
- Australia Aliphatic Solvents and Thinners Market Trend Evolution
- Australia Aliphatic Solvents and Thinners Market Drivers and Challenges
- Australia Aliphatic Solvents and Thinners Price Trends
- Australia Aliphatic Solvents and Thinners Porter's Five Forces
- Australia Aliphatic Solvents and Thinners Industry Life Cycle
- Historical Data and Forecast of Australia Aliphatic Solvents and Thinners Market Revenues & Volume By Type for the Period 2022-2032F
- Historical Data and Forecast of Australia Aliphatic Solvents and Thinners Market Revenues & Volume By Varnish Makers? & Painters? Naphtha for the Period 2022-2032F
- Historical Data and Forecast of Australia Aliphatic Solvents and Thinners Market Revenues & Volume By Mineral Spirits for the Period 2022-2032F
- Historical Data and Forecast of Australia Aliphatic Solvents and Thinners Market Revenues & Volume By Hexane for the Period 2022-2032F
- Historical Data and Forecast of Australia Aliphatic Solvents and Thinners Market Revenues & Volume By Heptane for the Period 2022-2032F
- Historical Data and Forecast of Australia Aliphatic Solvents and Thinners Market Revenues & Volume By Others for the Period 2022-2032F
- Historical Data and Forecast of Australia Aliphatic Solvents and Thinners Market Revenues & Volume By Applications for the Period 2022-2032F
- Historical Data and Forecast of Australia Aliphatic Solvents and Thinners Market Revenues & Volume By Paints & Coatings for the Period 2022-2032F
- Historical Data and Forecast of Australia Aliphatic Solvents and Thinners Market Revenues & Volume By Cleaning & Degreasing for the Period 2022-2032F
- Historical Data and Forecast of Australia Aliphatic Solvents and Thinners Market Revenues & Volume By Adhesives for the Period 2022-2032F
- Historical Data and Forecast of Australia Aliphatic Solvents and Thinners Market Revenues & Volume By Aerosols for the Period 2022-2032F
- Historical Data and Forecast of Australia Aliphatic Solvents and Thinners Market Revenues & Volume By Rubbers & polymers for the Period 2022-2032F
- Historical Data and Forecast of Australia Aliphatic Solvents and Thinners Market Revenues & Volume By Printing inks for the Period 2022-2032F
- Historical Data and Forecast of Australia Aliphatic Solvents and Thinners Market Revenues & Volume By Others for the Period 2022-2032F
- Australia Aliphatic Solvents and Thinners Import Export Trade Statistics
- Market Opportunity Assessment By Type
- Market Opportunity Assessment By Applications
- Australia Aliphatic Solvents and Thinners Top Companies Market Share
- Australia Aliphatic Solvents and Thinners Competitive Benchmarking By Technical and Operational Parameters
- Australia Aliphatic Solvents and Thinners Company Profiles
- Australia Aliphatic Solvents and Thinners Key Strategic Recommendations
Frequently Asked Questions About the Market Study (FAQs):
Aliphatic solvents are derived from aliphatic hydrocarbons and are commonly used as diluents, carriers, and cleaning agents in applications such as paints, coatings, and adhesives.
Government regulations focused on chemical safety and environmental quality will drive manufacturers to adopt sustainable practices, impacting product formulations and production methods.
Challenges include raw material availability, energy consumption, the need for compliance with stringent regulations, and the environmental impact of solvent production.
Key trends include the transition to eco-friendly formulations, innovations in bio-based solvents, and increased collaboration for sustainability initiatives.
6Wresearch actively monitors the Australia Aliphatic Solvents and Thinners Market and publishes its comprehensive annual report, highlighting emerging trends, growth drivers, revenue analysis, and forecast outlook. Our insights help businesses to make data-backed strategic decisions with ongoing market dynamics. Our analysts track relevent industries related to the Australia Aliphatic Solvents and Thinners Market, allowing our clients with actionable intelligence and reliable forecasts tailored to emerging regional needs.
Yes, we provide customisation as per your requirements. To learn more, feel free to contact us on sales@6wresearch.com
1 Executive Summary |
2 Introduction |
2.1 Key Highlights of the Report |
2.2 Report Description |
2.3 Market Scope & Segmentation |
2.4 Research Methodology |
2.5 Assumptions |
3 Australia Aliphatic Solvents and Thinners Market Overview |
3.1 Australia Country Macro Economic Indicators |
3.2 Australia Aliphatic Solvents and Thinners Market Revenues & Volume, 2022 & 2032F |
3.3 Australia Aliphatic Solvents and Thinners Market - Industry Life Cycle |
3.4 Australia Aliphatic Solvents and Thinners Market - Porter's Five Forces |
3.5 Australia Aliphatic Solvents and Thinners Market Revenues & Volume Share, By Type, 2022 & 2032F |
3.6 Australia Aliphatic Solvents and Thinners Market Revenues & Volume Share, By Applications, 2022 & 2032F |
4 Australia Aliphatic Solvents and Thinners Market Dynamics |
4.1 Impact Analysis |
4.2 Market Drivers |
4.2.1 Growing demand for environmentally friendly and low-VOC (Volatile Organic Compounds) products |
4.2.2 Increasing use of aliphatic solvents and thinners in end-user industries such as paints coatings, adhesives, and cleaning products |
4.2.3 Rising investments in infrastructure development projects driving the demand for these products |
4.3 Market Restraints |
4.3.1 Fluctuating prices of raw materials impacting the overall production costs |
4.3.2 Stringent regulations and policies related to environmental concerns and worker safety |
4.3.3 Competition from substitute products like aromatic solvents and bio-based solvents |
5 Australia Aliphatic Solvents and Thinners Market Trends |
6 Australia Aliphatic Solvents and Thinners Market, By Types |
6.1 Australia Aliphatic Solvents and Thinners Market, By Type |
6.1.1 Overview and Analysis |
6.1.2 Australia Aliphatic Solvents and Thinners Market Revenues & Volume, By Type, 2022-2032F |
6.1.3 Australia Aliphatic Solvents and Thinners Market Revenues & Volume, By Varnish Makers? & Painters? Naphtha, 2022-2032F |
6.1.4 Australia Aliphatic Solvents and Thinners Market Revenues & Volume, By Mineral Spirits, 2022-2032F |
6.1.5 Australia Aliphatic Solvents and Thinners Market Revenues & Volume, By Hexane, 2022-2032F |
6.1.6 Australia Aliphatic Solvents and Thinners Market Revenues & Volume, By Heptane, 2022-2032F |
6.1.7 Australia Aliphatic Solvents and Thinners Market Revenues & Volume, By Others, 2022-2032F |
6.2 Australia Aliphatic Solvents and Thinners Market, By Applications |
6.2.1 Overview and Analysis |
6.2.2 Australia Aliphatic Solvents and Thinners Market Revenues & Volume, By Paints & Coatings, 2022-2032F |
6.2.3 Australia Aliphatic Solvents and Thinners Market Revenues & Volume, By Cleaning & Degreasing, 2022-2032F |
6.2.4 Australia Aliphatic Solvents and Thinners Market Revenues & Volume, By Adhesives, 2022-2032F |
6.2.5 Australia Aliphatic Solvents and Thinners Market Revenues & Volume, By Aerosols, 2022-2032F |
6.2.6 Australia Aliphatic Solvents and Thinners Market Revenues & Volume, By Rubbers & polymers, 2022-2032F |
6.2.7 Australia Aliphatic Solvents and Thinners Market Revenues & Volume, By Printing inks, 2022-2032F |
7 Australia Aliphatic Solvents and Thinners Market Import-Export Trade Statistics |
7.1 Australia Aliphatic Solvents and Thinners Market Export to Major Countries |
7.2 Australia Aliphatic Solvents and Thinners Market Imports from Major Countries |
8 Australia Aliphatic Solvents and Thinners Market Key Performance Indicators |
8.1 Adoption rate of eco-friendly aliphatic solvents and thinners in key industries |
8.2 Number of infrastructure projects utilizing aliphatic solvents and thinners |
8.3 Compliance rate with environmental and safety regulations in the manufacturing and usage of these products |
9 Australia Aliphatic Solvents and Thinners Market - Opportunity Assessment |
9.1 Australia Aliphatic Solvents and Thinners Market Opportunity Assessment, By Type, 2022 & 2032F |
9.2 Australia Aliphatic Solvents and Thinners Market Opportunity Assessment, By Applications, 2022 & 2032F |
10 Australia Aliphatic Solvents and Thinners Market - Competitive Landscape |
10.1 Australia Aliphatic Solvents and Thinners Market Revenue Share, By Companies, 2025 |
10.2 Australia Aliphatic Solvents and Thinners Market Competitive Benchmarking, By Operating and Technical Parameters |
11 Company Profiles |
12 Recommendations |
13 Disclaimer |
Global Go To Market Strategy - 2030
Export potential enables firms to identify high-growth global markets with greater confidence by combining advanced trade intelligence with a structured quantitative methodology. The framework analyzes emerging demand trends and country-level import patterns while integrating macroeconomic and trade datasets such as GDP and population forecasts, bilateral import–export flows, tariff structures, elasticity differentials between developed and developing economies, geographic distance, and import demand projections. Using weighted trade values from 2020–2024 as the base period to project country-to-country export potential for 2030, these inputs are operationalized through calculated drivers such as gravity model parameters, tariff impact factors, and projected GDP per-capita growth. Through an analysis of hidden potentials, demand hotspots, and market conditions that are most favorable to success, this method enables firms to focus on target countries, maximize returns, and global expansion with data, backed by accuracy.
By factoring in the projected importer demand gap that is currently unmet and could be potential opportunity, it identifies the potential for the Exporter (Country) among 190 countries, against the general trade analysis, which identifies the biggest importer or exporter.
To discover high-growth global markets and optimize your business strategy:
Click Here
Pricing
- Single User License$ 1,995
- Department License$ 2,400
- Site License$ 3,120
- Global License$ 3,795

Leadership Perspectives from Industry Events
Search
Thought Leadership and Analyst Meet


Our Clients
6WResearch In News
- India Air Conditioner Market Set for Strong Rebound in 2026 After Weather-Led Correction and GST-Driven Recovery: 6Wresearch
- ADAS in India: How Automatic Emergency Braking, Blind Spot Detection & Driver Monitoring are Transforming Road Safety
- Doha a strategic location for EV manufacturing hub: IPA Qatar
- Demand for luxury TVs surging in the GCC, says Samsung
- Empowering Growth: The Thriving Journey of Bangladesh’s Cable Industry
- Demand for luxury TVs surging in the GCC, says Samsung
Latest Reports
- Nicaragua RPG Gaming Market (2026-2032)
- New Zealand RPG Gaming Market (2026-2032)
- Netherlands RPG Gaming Market (2026-2032)
- Nauru RPG Gaming Market (2026-2032)
- Namibia RPG Gaming Market (2026-2032)
- Mozambique RPG Gaming Market (2026-2032)
- Montenegro RPG Gaming Market (2026-2032)
- Mongolia RPG Gaming Market (2026-2032)
- Monaco RPG Gaming Market (2026-2032)
- Micronesia RPG Gaming Market (2026-2032)
Industry Events and Analyst Meet

HIMTEX 2026

India Refining Summit 2026

India EV Show 2026

EV tech India Expo 2026

Auto Tech Asia 2026
Whitepaper
- Middle East & Africa Commercial Security Market Click here to view more.
- Middle East & Africa Fire Safety Systems & Equipment Market Click here to view more.
- GCC Drone Market Click here to view more.
- Middle East Lighting Fixture Market Click here to view more.
- GCC Physical & Perimeter Security Market Click here to view more.