Australia Anhydrides Market (2026-2032) | Size, Revenue, Analysis, Companies, Growth, Industry, Outlook, Share, Forecast, Trends & Value
Market Forecast By Composition (Inorganic, Organic), By Types (Acetic Anhydride, Maleic Anhydride, Isobutyric Anhydride, Propionic Anhydride, Phthalic Anhydride, Isatoic Acid Anhydride, Others), By Application (Pesticides, Plasticizers, Dyes & Pigments, Additives, Flavors, Others), By End-Use Industry (Construction, Pharmaceuticals, Automotive, Agrochemicals, Textiles, Food & Beverages, Others) And Competitive Landscape
| Product Code: ETC046815 | Publication Date: Jan 2021 | Updated Date: Mar 2026 | Product Type: Report | |
| Publisher: 6Wresearch | Author: Ravi Bhandari | No. of Pages: 70 | No. of Figures: 35 | No. of Tables: 5 |
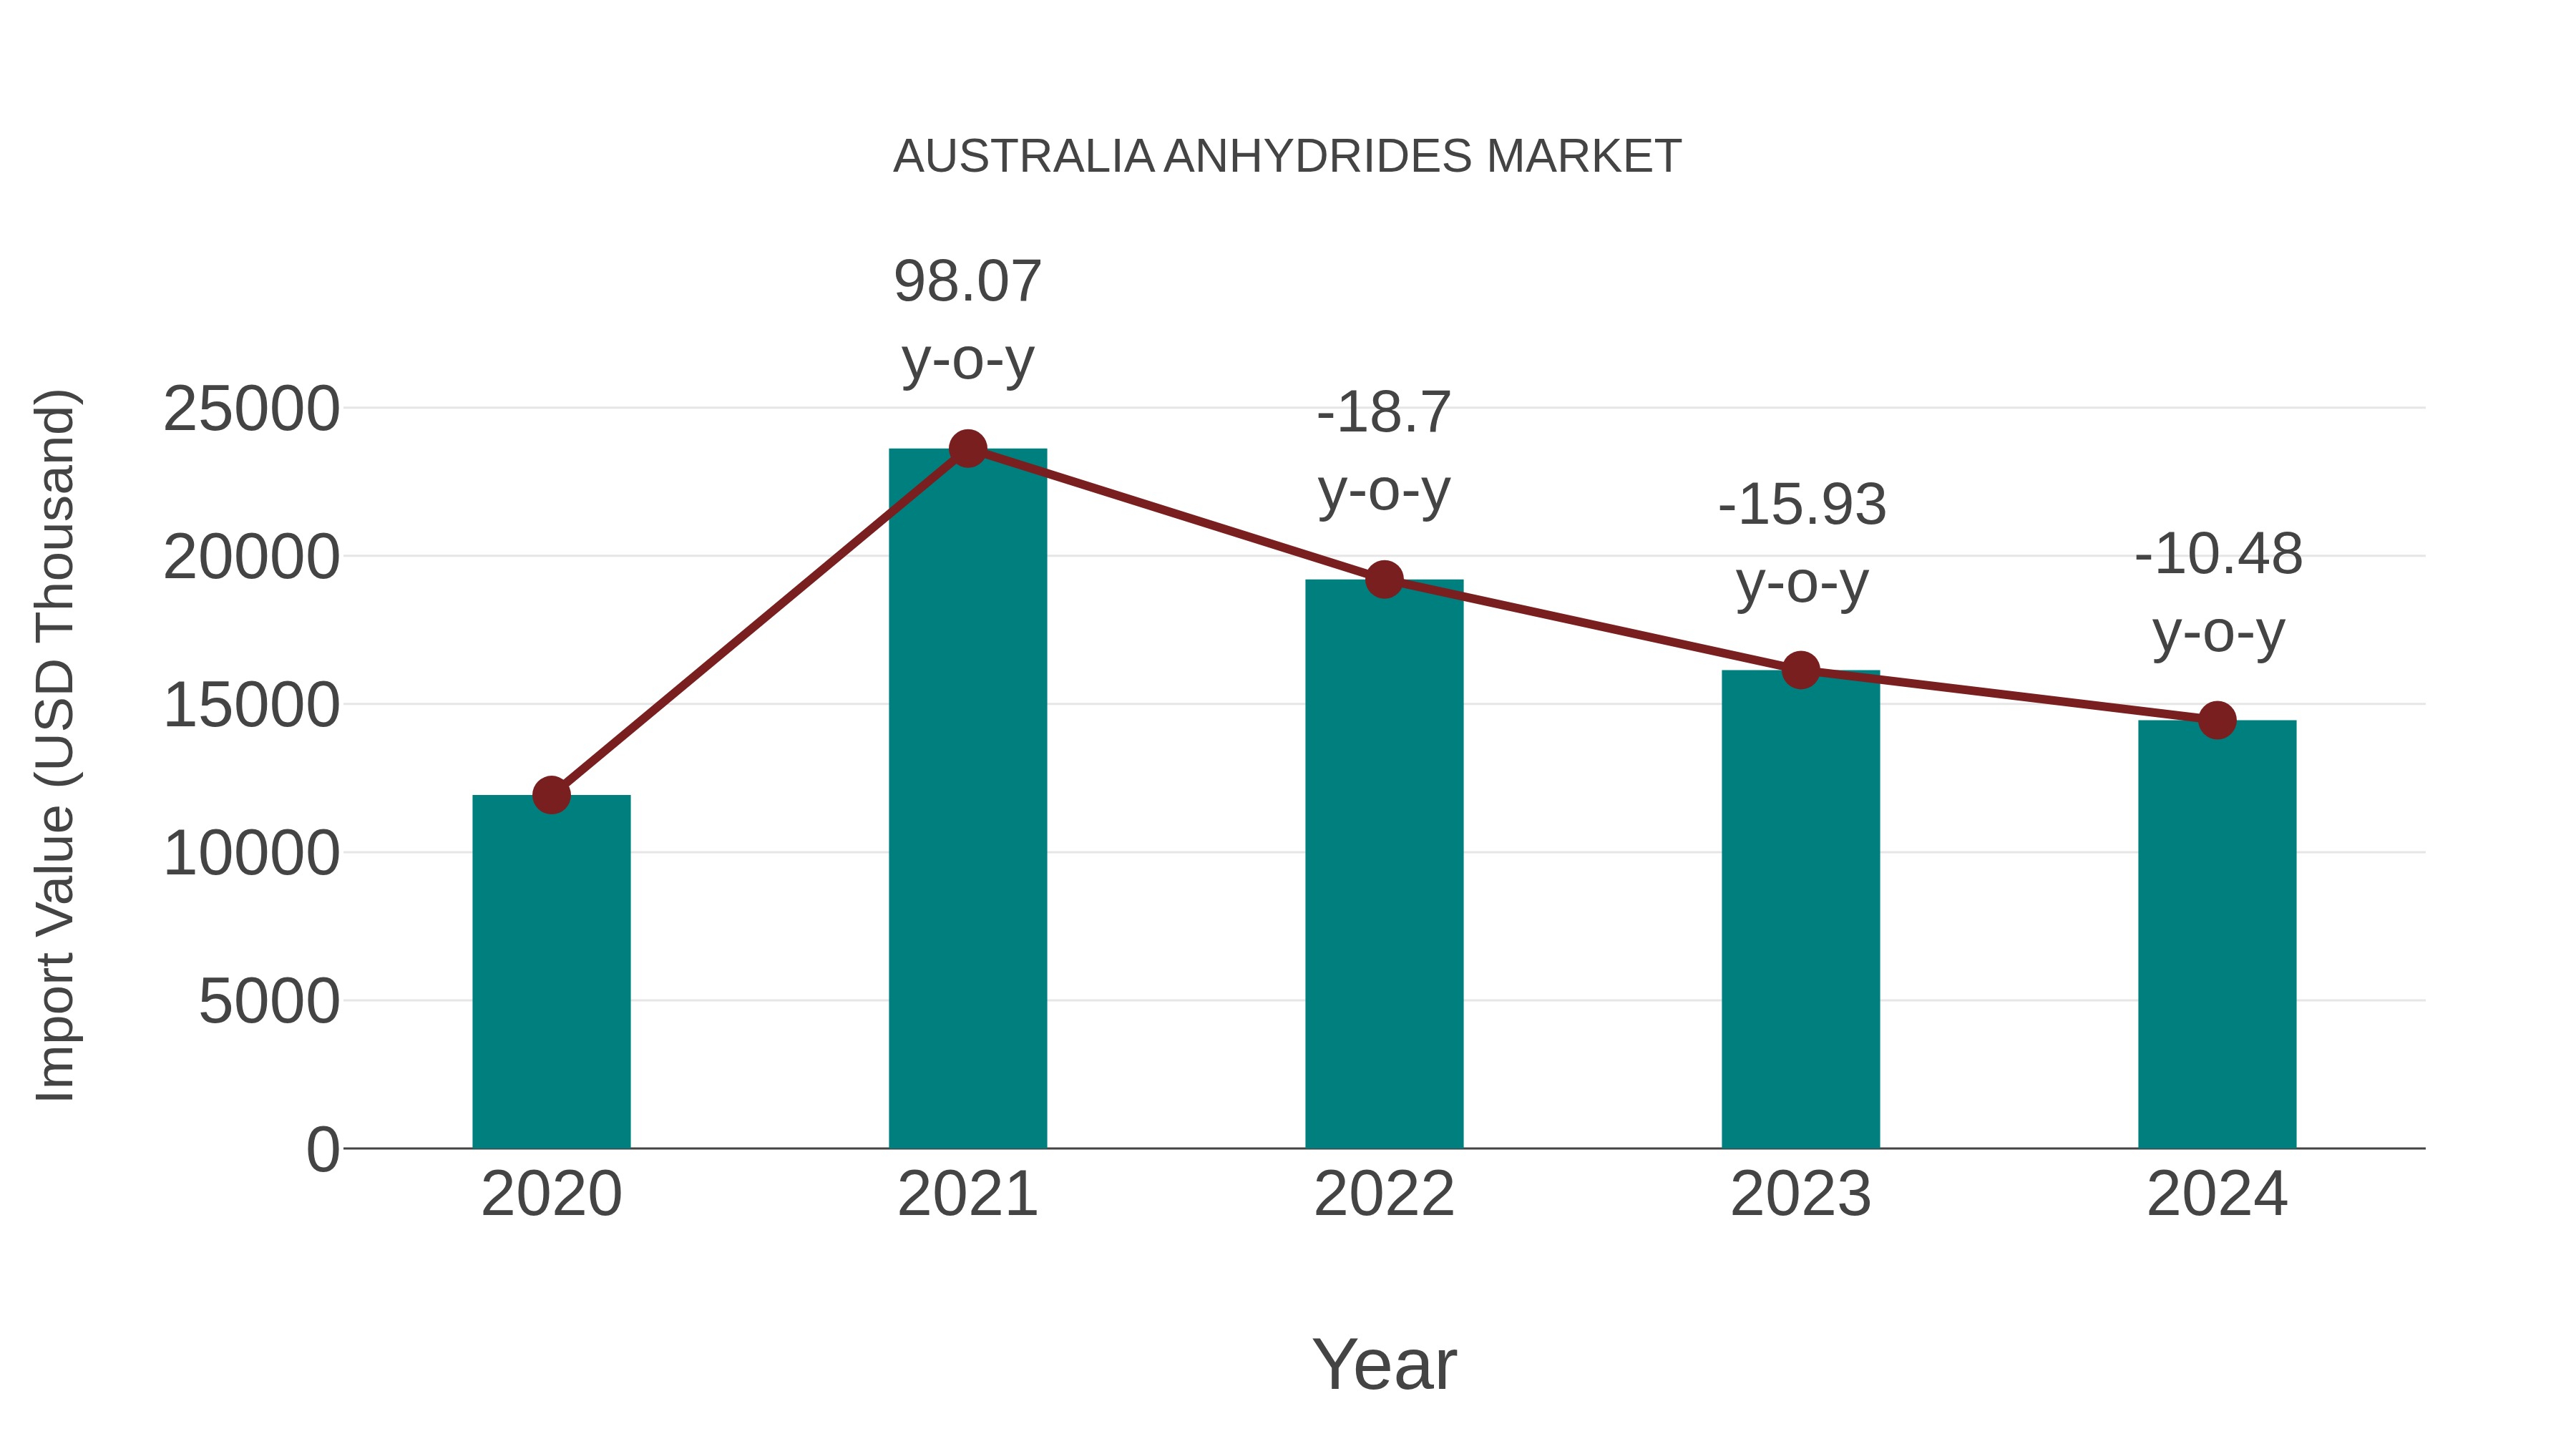
Australia Anhydrides Market: Import Trend Analysis
In the Australia anhydrides market, the import trend experienced a decline with a growth rate of -10.48% from 2023 to 2024, while the compound annual growth rate (CAGR) for 2020-2024 stood at 4.92%. This downturn in import momentum could be attributed to shifting demand dynamics or changes in trade policies impacting market stability.
Australia Anhydrides Market Synopsis
The anhydrides market in Australia plays a critical role in the chemical and manufacturing industries. Used in adhesives, coatings, and pharmaceuticals, demand for these compounds is driven by industrial applications and technological advancements in production processes.
Drivers of the market
The Australian anhydrides market is expanding due to its wide-ranging applications in manufacturing resins, coatings, adhesives, and pharmaceuticals. Increasing demand for high-performance materials in the automotive and construction industries is propelling market growth, alongside the growing need for eco-friendly alternatives. Regulatory policies promoting sustainable chemical production are also influencing industry players to develop bio-based anhydrides.
Challenges of the market
The anhydrides market struggles with raw material supply constraints, particularly for chemicals such as maleic and phthalic anhydride, which are influenced by global petrochemical industry trends. Environmental regulations on chemical manufacturing add compliance costs, while fluctuating demand from industries such as coatings, adhesives, and plastics creates market instability.
Investment opportunities in the Market
The anhydrides market in Australia serves industries like coatings, pharmaceuticals, and agriculture. Investments in high-purity anhydrides, sustainable production methods, and specialty chemical formulations present profitable opportunities.
Government Policy of the market
The anhydrides market in Australia is governed by chemical industry regulations and environmental policies. The government enforces safety standards for handling and storage, ensuring that anhydrides used in various industries, such as pharmaceuticals and coatings, meet strict guidelines. Environmental policies promote the use of sustainable alternatives to reduce emissions from chemical manufacturing, while trade regulations control the import and export of anhydrides to maintain industry standards.
Key Highlights of the Report:
- Australia Anhydrides? Market Outlook
- Market Size of Australia Anhydrides? Market, 2025
- Forecast of Australia Anhydrides? Market, 2032
- Historical Data and Forecast of Australia Anhydrides? Revenues & Volume for the Period 2022-2032F
- Australia Anhydrides? Market Trend Evolution
- Australia Anhydrides? Market Drivers and Challenges
- Australia Anhydrides? Price Trends
- Australia Anhydrides? Porter's Five Forces
- Australia Anhydrides? Industry Life Cycle
- Historical Data and Forecast of Australia Anhydrides? Market Revenues & Volume By Composition for the Period 2022-2032F
- Historical Data and Forecast of Australia Anhydrides? Market Revenues & Volume By Inorganic for the Period 2022-2032F
- Historical Data and Forecast of Australia Anhydrides? Market Revenues & Volume By Organic for the Period 2022-2032F
- Historical Data and Forecast of Australia Anhydrides? Market Revenues & Volume By Types for the Period 2022-2032F
- Historical Data and Forecast of Australia Anhydrides? Market Revenues & Volume By Acetic Anhydride for the Period 2022-2032F
- Historical Data and Forecast of Australia Anhydrides? Market Revenues & Volume By Maleic Anhydride for the Period 2022-2032F
- Historical Data and Forecast of Australia Anhydrides? Market Revenues & Volume By Isobutyric Anhydride for the Period 2022-2032F
- Historical Data and Forecast of Australia Anhydrides? Market Revenues & Volume By Propionic Anhydride for the Period 2022-2032F
- Historical Data and Forecast of Australia Anhydrides? Market Revenues & Volume By Phthalic Anhydride for the Period 2022-2032F
- Historical Data and Forecast of Australia Anhydrides? Market Revenues & Volume By Isatoic Acid Anhydride for the Period 2022-2032F
- Historical Data and Forecast of Australia Anhydrides? Market Revenues & Volume By Others for the Period 2022-2032F
- Historical Data and Forecast of Australia Anhydrides? Market Revenues & Volume By Application for the Period 2022-2032F
- Historical Data and Forecast of Australia Anhydrides? Market Revenues & Volume By Pesticides for the Period 2022-2032F
- Historical Data and Forecast of Australia Anhydrides? Market Revenues & Volume By Plasticizers for the Period 2022-2032F
- Historical Data and Forecast of Australia Anhydrides? Market Revenues & Volume By Dyes & Pigments for the Period 2022-2032F
- Historical Data and Forecast of Australia Anhydrides? Market Revenues & Volume By Additives for the Period 2022-2032F
- Historical Data and Forecast of Australia Anhydrides? Market Revenues & Volume By Flavors for the Period 2022-2032F
- Historical Data and Forecast of Australia Anhydrides? Market Revenues & Volume By Others for the Period 2022-2032F
- Historical Data and Forecast of Australia Anhydrides? Market Revenues & Volume By End-Use Industry for the Period 2022-2032F
- Historical Data and Forecast of Australia Anhydrides? Market Revenues & Volume By Construction for the Period 2022-2032F
- Historical Data and Forecast of Australia Anhydrides? Market Revenues & Volume By Pharmaceuticals for the Period 2022-2032F
- Historical Data and Forecast of Australia Anhydrides? Market Revenues & Volume By Automotive for the Period 2022-2032F
- Historical Data and Forecast of Australia Anhydrides? Market Revenues & Volume By Agrochemicals for the Period 2022-2032F
- Historical Data and Forecast of Australia Anhydrides? Market Revenues & Volume By Textiles for the Period 2022-2032F
- Historical Data and Forecast of Australia Anhydrides? Market Revenues & Volume By Food & Beverages for the Period 2022-2032F
- Historical Data and Forecast of Australia Anhydrides? Market Revenues & Volume By Others for the Period 2022-2032F
- Australia Anhydrides? Import Export Trade Statistics
- Market Opportunity Assessment By Composition
- Market Opportunity Assessment By Types
- Market Opportunity Assessment By Application
- Market Opportunity Assessment By End-Use Industry
- Australia Anhydrides? Top Companies Market Share
- Australia Anhydrides? Competitive Benchmarking By Technical and Operational Parameters
- Australia Anhydrides? Company Profiles
- Australia Anhydrides? Key Strategic Recommendations
Australia Anhydrides Market (2026-2032): FAQs
6Wresearch actively monitors the Australia Anhydrides Market and publishes its comprehensive annual report, highlighting emerging trends, growth drivers, revenue analysis, and forecast outlook. Our insights help businesses to make data-backed strategic decisions with ongoing market dynamics. Our analysts track relevent industries related to the Australia Anhydrides Market, allowing our clients with actionable intelligence and reliable forecasts tailored to emerging regional needs.
Yes, we provide customisation as per your requirements. To learn more, feel free to contact us on sales@6wresearch.com
1 Executive Summary |
2 Introduction |
2.1 Key Highlights of the Report |
2.2 Report Description |
2.3 Market Scope & Segmentation |
2.4 Research Methodology |
2.5 Assumptions |
3 Australia Anhydrides Market Overview |
3.1 Australia Country Macro Economic Indicators |
3.2 Australia Anhydrides Market Revenues & Volume, 2022 & 2032F |
3.3 Australia Anhydrides Market - Industry Life Cycle |
3.4 Australia Anhydrides Market - Porter's Five Forces |
3.5 Australia Anhydrides Market Revenues & Volume Share, By Composition, 2022 & 2032F |
3.6 Australia Anhydrides Market Revenues & Volume Share, By Types, 2022 & 2032F |
3.7 Australia Anhydrides Market Revenues & Volume Share, By Application, 2022 & 2032F |
3.8 Australia Anhydrides Market Revenues & Volume Share, By End-Use Industry, 2022 & 2032F |
4 Australia Anhydrides Market Dynamics |
4.1 Impact Analysis |
4.2 Market Drivers |
4.2.1 Increasing demand for anhydrides in various industries such as construction, automotive, and electronics due to their use in manufacturing processes. |
4.2.2 Growing investments in research and development for the development of innovative anhydrides with enhanced properties. |
4.2.3 Favorable government regulations promoting the use of anhydrides in eco-friendly applications. |
4.3 Market Restraints |
4.3.1 Fluctuating prices of raw materials used in the production of anhydrides impacting profit margins. |
4.3.2 Intense competition from substitute products in the market. |
4.3.3 Economic downturns affecting the overall demand for anhydrides in Australia. |
5 Australia Anhydrides Market Trends |
6 Australia Anhydrides Market, By Types |
6.1 Australia Anhydrides Market, By Composition |
6.1.1 Overview and Analysis |
6.1.2 Australia Anhydrides Market Revenues & Volume, By Composition, 2022-2032F |
6.1.3 Australia Anhydrides Market Revenues & Volume, By Inorganic, 2022-2032F |
6.1.4 Australia Anhydrides Market Revenues & Volume, By Organic, 2022-2032F |
6.2 Australia Anhydrides Market, By Types |
6.2.1 Overview and Analysis |
6.2.2 Australia Anhydrides Market Revenues & Volume, By Acetic Anhydride, 2022-2032F |
6.2.3 Australia Anhydrides Market Revenues & Volume, By Maleic Anhydride, 2022-2032F |
6.2.4 Australia Anhydrides Market Revenues & Volume, By Isobutyric Anhydride, 2022-2032F |
6.2.5 Australia Anhydrides Market Revenues & Volume, By Propionic Anhydride, 2022-2032F |
6.2.6 Australia Anhydrides Market Revenues & Volume, By Phthalic Anhydride, 2022-2032F |
6.2.7 Australia Anhydrides Market Revenues & Volume, By Isatoic Acid Anhydride, 2022-2032F |
6.3 Australia Anhydrides Market, By Application |
6.3.1 Overview and Analysis |
6.3.2 Australia Anhydrides Market Revenues & Volume, By Pesticides, 2022-2032F |
6.3.3 Australia Anhydrides Market Revenues & Volume, By Plasticizers, 2022-2032F |
6.3.4 Australia Anhydrides Market Revenues & Volume, By Dyes & Pigments, 2022-2032F |
6.3.5 Australia Anhydrides Market Revenues & Volume, By Additives, 2022-2032F |
6.3.6 Australia Anhydrides Market Revenues & Volume, By Flavors, 2022-2032F |
6.3.7 Australia Anhydrides Market Revenues & Volume, By Others, 2022-2032F |
6.4 Australia Anhydrides Market, By End-Use Industry |
6.4.1 Overview and Analysis |
6.4.2 Australia Anhydrides Market Revenues & Volume, By Construction, 2022-2032F |
6.4.3 Australia Anhydrides Market Revenues & Volume, By Pharmaceuticals, 2022-2032F |
6.4.4 Australia Anhydrides Market Revenues & Volume, By Automotive, 2022-2032F |
6.4.5 Australia Anhydrides Market Revenues & Volume, By Agrochemicals, 2022-2032F |
6.4.6 Australia Anhydrides Market Revenues & Volume, By Textiles, 2022-2032F |
6.4.7 Australia Anhydrides Market Revenues & Volume, By Food & Beverages, 2022-2032F |
7 Australia Anhydrides Market Import-Export Trade Statistics |
7.1 Australia Anhydrides Market Export to Major Countries |
7.2 Australia Anhydrides Market Imports from Major Countries |
8 Australia Anhydrides Market Key Performance Indicators |
8.1 Research and development expenditure dedicated to anhydrides innovation. |
8.2 Number of patents filed for new anhydrides formulations. |
8.3 Environmental impact assessments and certifications for anhydrides production processes. |
9 Australia Anhydrides Market - Opportunity Assessment |
9.1 Australia Anhydrides Market Opportunity Assessment, By Composition, 2022 & 2032F |
9.2 Australia Anhydrides Market Opportunity Assessment, By Types, 2022 & 2032F |
9.3 Australia Anhydrides Market Opportunity Assessment, By Application, 2022 & 2032F |
9.4 Australia Anhydrides Market Opportunity Assessment, By End-Use Industry, 2022 & 2032F |
10 Australia Anhydrides Market - Competitive Landscape |
10.1 Australia Anhydrides Market Revenue Share, By Companies, 2025 |
10.2 Australia Anhydrides Market Competitive Benchmarking, By Operating and Technical Parameters |
11 Company Profiles |
12 Recommendations |
13 Disclaimer |
Global Go To Market Strategy - 2030
Export potential enables firms to identify high-growth global markets with greater confidence by combining advanced trade intelligence with a structured quantitative methodology. The framework analyzes emerging demand trends and country-level import patterns while integrating macroeconomic and trade datasets such as GDP and population forecasts, bilateral import–export flows, tariff structures, elasticity differentials between developed and developing economies, geographic distance, and import demand projections. Using weighted trade values from 2020–2024 as the base period to project country-to-country export potential for 2030, these inputs are operationalized through calculated drivers such as gravity model parameters, tariff impact factors, and projected GDP per-capita growth. Through an analysis of hidden potentials, demand hotspots, and market conditions that are most favorable to success, this method enables firms to focus on target countries, maximize returns, and global expansion with data, backed by accuracy.
By factoring in the projected importer demand gap that is currently unmet and could be potential opportunity, it identifies the potential for the Exporter (Country) among 190 countries, against the general trade analysis, which identifies the biggest importer or exporter.
To discover high-growth global markets and optimize your business strategy:
Click Here
Pricing
- Single User License$ 1,995
- Department License$ 2,400
- Site License$ 3,120
- Global License$ 3,795

Leadership Perspectives from Industry Events
Search
Thought Leadership and Analyst Meet


Our Clients
6WResearch In News
- India Air Conditioner Market Set for Strong Rebound in 2026 After Weather-Led Correction and GST-Driven Recovery: 6Wresearch
- ADAS in India: How Automatic Emergency Braking, Blind Spot Detection & Driver Monitoring are Transforming Road Safety
- Doha a strategic location for EV manufacturing hub: IPA Qatar
- Demand for luxury TVs surging in the GCC, says Samsung
- Empowering Growth: The Thriving Journey of Bangladesh’s Cable Industry
- Demand for luxury TVs surging in the GCC, says Samsung
Latest Reports
- Poland Fire Protection Systems Market (2026-2032)
- Cape Verde Portable Hand-Thrown Extinguisher Market (2026-2032)
- Canada Portable Hand-Thrown Extinguisher Market (2026-2032)
- Cameroon Portable Hand-Thrown Extinguisher Market (2026-2032)
- Burundi Portable Hand-Thrown Extinguisher Market (2026-2032)
- Burkina Faso Portable Hand-Thrown Extinguisher Market (2026-2032)
- Bulgaria Portable Hand-Thrown Extinguisher Market (2026-2032)
- Brunei Portable Hand-Thrown Extinguisher Market (2026-2032)
- Botswana Portable Hand-Thrown Extinguisher Market (2026-2032)
- Bosnia and Herzegovina Portable Hand-Thrown Extinguisher Market (2026-2032)
Industry Events and Analyst Meet

HIMTEX 2026

India Refining Summit 2026

India EV Show 2026

EV tech India Expo 2026

Auto Tech Asia 2026
Whitepaper
- Middle East & Africa Commercial Security Market Click here to view more.
- Middle East & Africa Fire Safety Systems & Equipment Market Click here to view more.
- GCC Drone Market Click here to view more.
- Middle East Lighting Fixture Market Click here to view more.
- GCC Physical & Perimeter Security Market Click here to view more.