Australia Black Board Market (2026-2032) Outlook | Industry, Analysis, Share, Companies, Trends, Size, Forecast, Growth, Value & Revenue
Market Forecast By Product Type (Wall-mounted Board, Mobile Board, Others), By Application (Schools, Office, Family, Others) And Competitive Landscape
| Product Code: ETC315155 | Publication Date: Aug 2022 | Updated Date: Mar 2026 | Product Type: Market Research Report | |
| Publisher: 6Wresearch | Author: Shubham Padhi | No. of Pages: 75 | No. of Figures: 35 | No. of Tables: 20 |
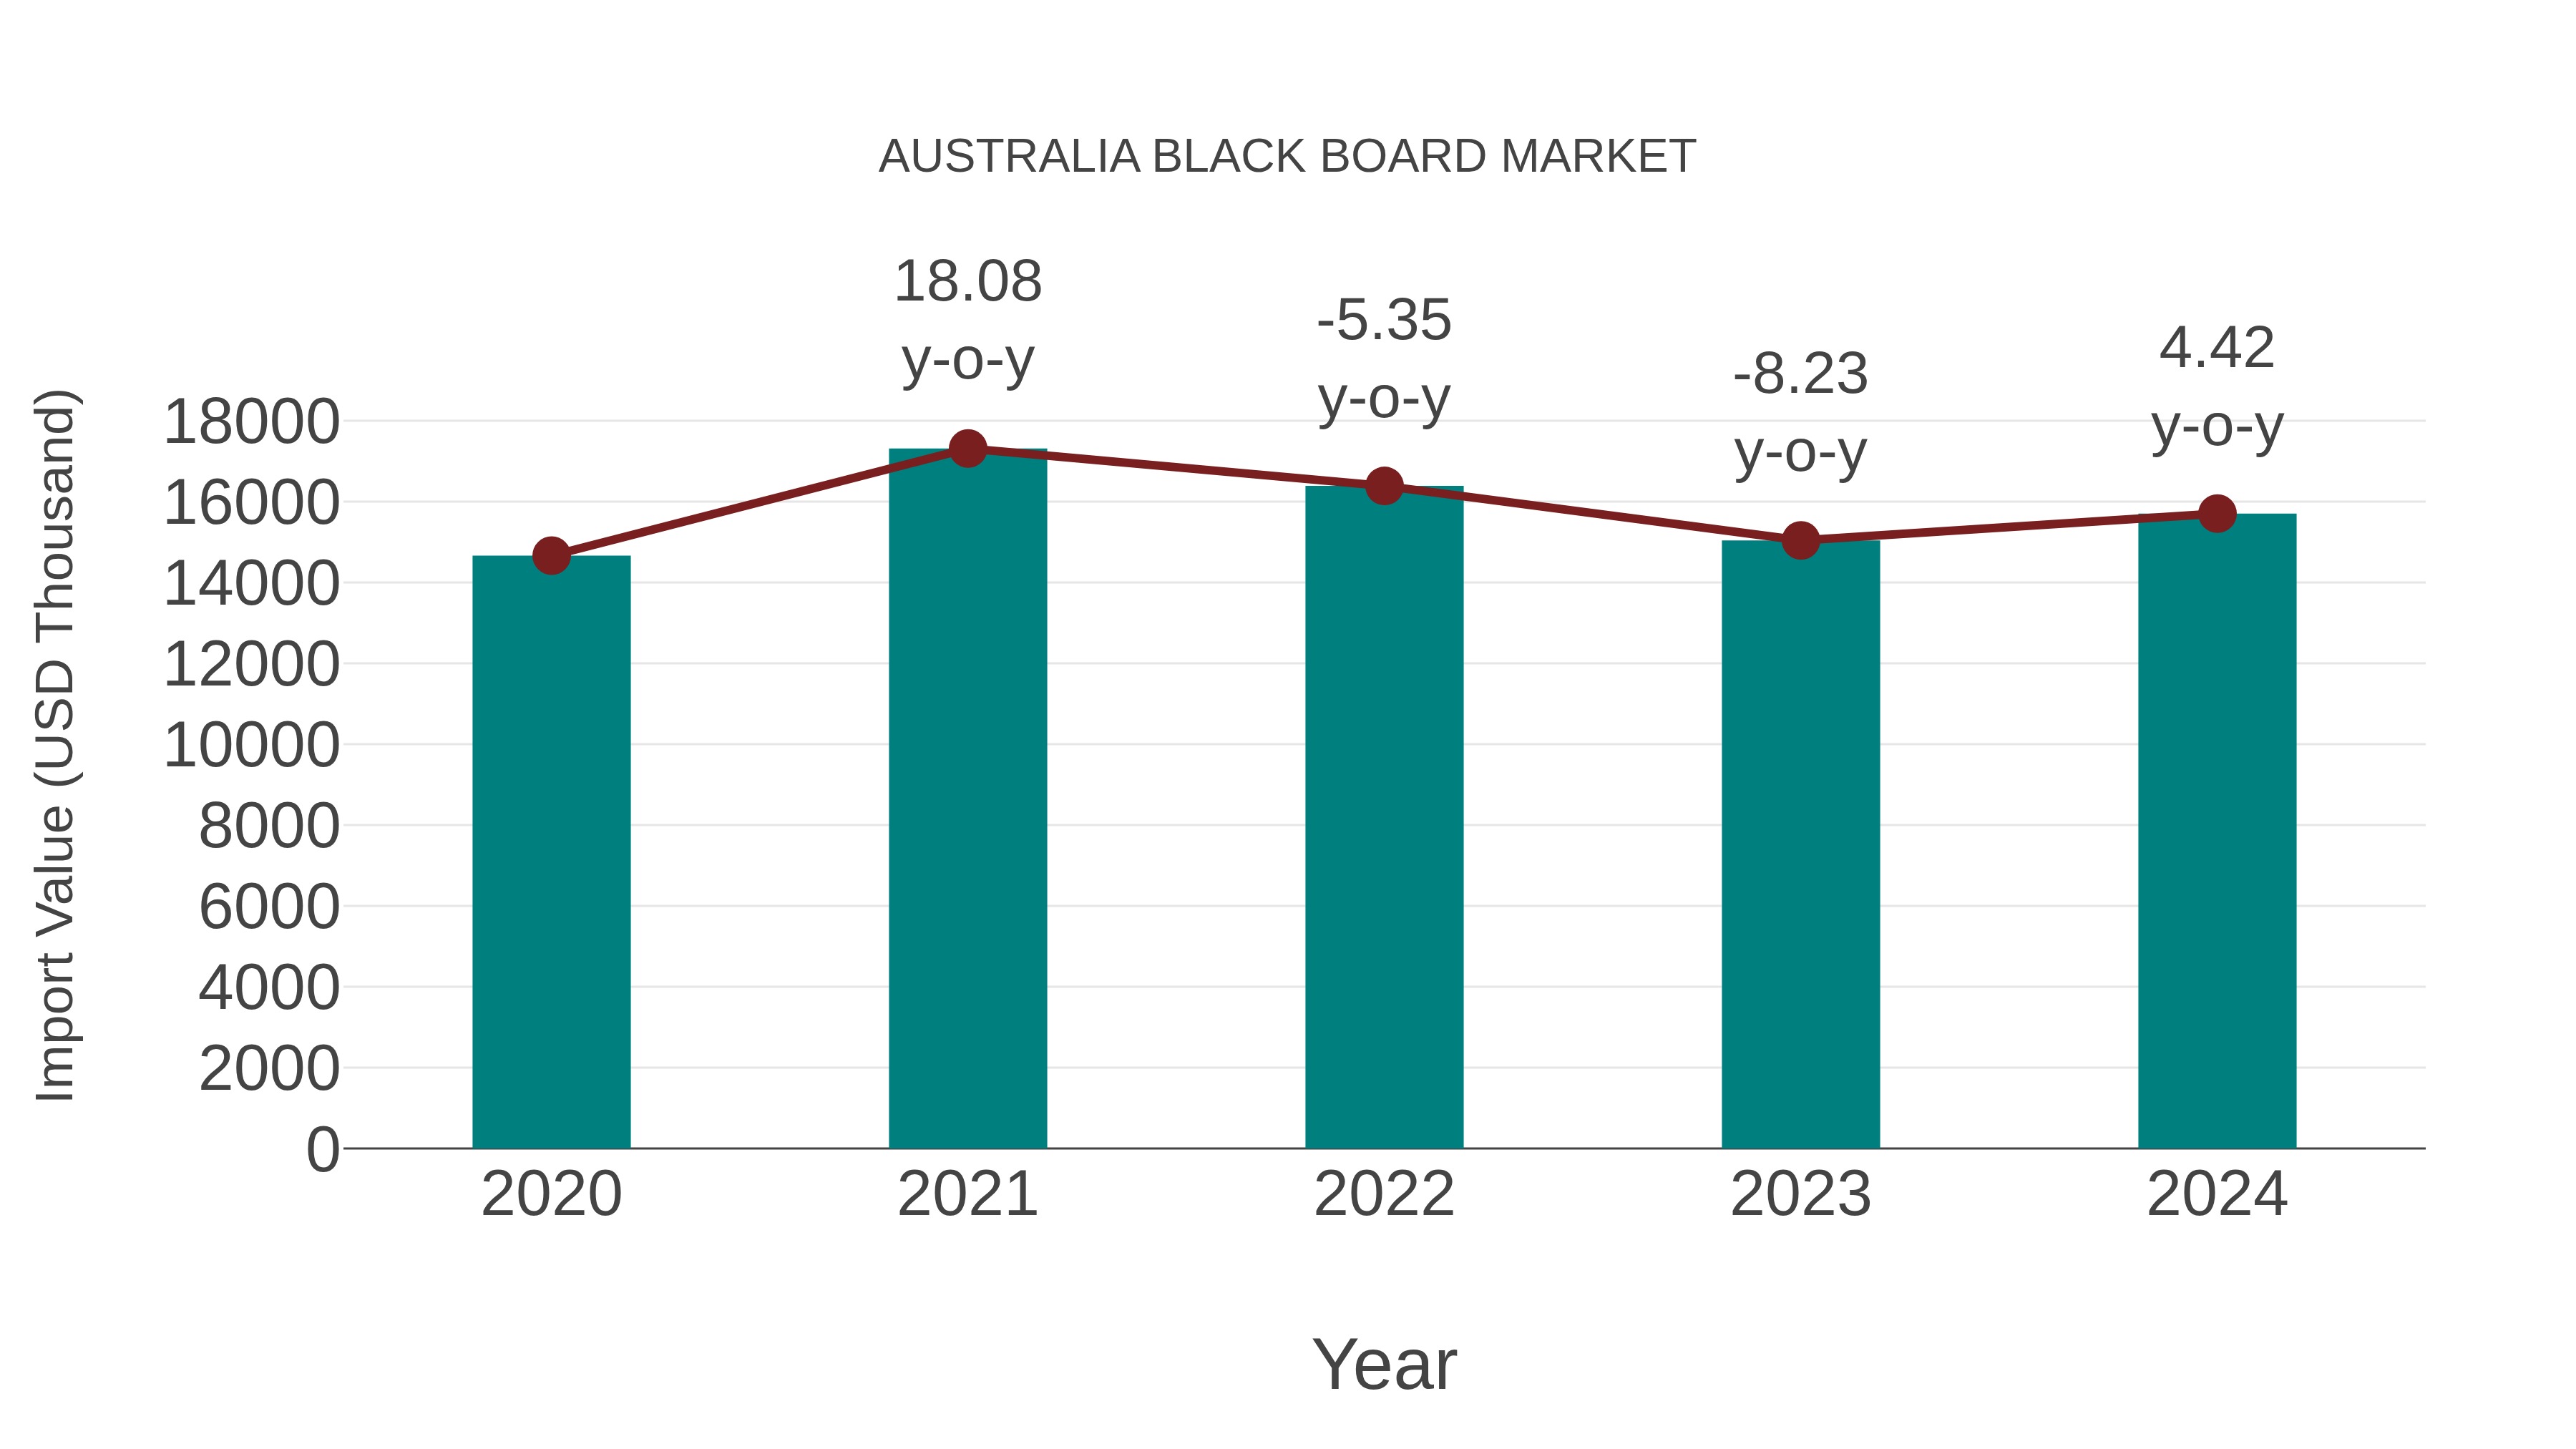
Australia Black Board Market: Import Trend Analysis
In 2024, Australia`s import momentum for the black board market showed a growth rate of 4.42% compared to the previous year. The compound annual growth rate (CAGR) between 2020 and 2024 stood at 1.73%. This upward trend could be attributed to a gradual demand shift towards high-quality black boards and a stable market environment during the period.
Australia Black Board Market Overview
In Australia, the blackboard market remains relevant in educational institutions and commercial spaces despite digital advancements. Blackboards, often made of slate or coated surfaces, serve as essential teaching and communication tools, contributing to the stability of this market segment in the country.
Drivers of the market
The Australia black board market is witnessing notable growth, driven by several key factors. Firstly, the education sector`s ongoing demand for classroom supplies, including blackboards, is a primary driver of market growth. Despite the increasing use of digital technologies in education, traditional blackboards remain essential tools for interactive learning and classroom instruction. Secondly, the growing trend towards personalized and flexible learning environments is driving demand for innovative blackboard solutions, such as magnetic or interactive surfaces, that enhance engagement and collaboration among students and educators. Additionally, advancements in blackboard materials, surface coatings, and mounting systems are driving innovation in the market, leading to the development of durable, easy-to-clean, and versatile blackboard products suitable for diverse educational settings in Australia.
Challenges of the market
The Australia blackboard market faces challenges such as digitalization in education and competition from interactive whiteboards. Adapting to changes in classroom technology and addressing concerns regarding product durability are ongoing challenges for blackboard manufacturers.
Government Policy of the market
Australia education sector drives demand in the blackboard market. Despite the digitalization of classrooms, traditional teaching tools like blackboards remain essential in many educational institutions. Government initiatives supporting educational infrastructure development contribute to market growth, ensuring continued demand for blackboards in schools and universities.
Key Highlights of the Report:
- Australia Black Board Market Outlook
- Market Size of Australia Black Board Market, 2025
- Forecast of Australia Black Board Market, 2032
- Historical Data and Forecast of Australia Black Board Revenues & Volume for the Period 2022-2032F
- Australia Black Board Market Trend Evolution
- Australia Black Board Market Drivers and Challenges
- Australia Black Board Price Trends
- Australia Black Board Porter's Five Forces
- Australia Black Board Industry Life Cycle
- Historical Data and Forecast of Australia Black Board Market Revenues & Volume By Product Type for the Period 2022-2032F
- Historical Data and Forecast of Australia Black Board Market Revenues & Volume By Wall-mounted Board for the Period 2022-2032F
- Historical Data and Forecast of Australia Black Board Market Revenues & Volume By Mobile Board for the Period 2022-2032F
- Historical Data and Forecast of Australia Black Board Market Revenues & Volume By Others for the Period 2022-2032F
- Historical Data and Forecast of Australia Black Board Market Revenues & Volume By Application for the Period 2022-2032F
- Historical Data and Forecast of Australia Black Board Market Revenues & Volume By Schools for the Period 2022-2032F
- Historical Data and Forecast of Australia Black Board Market Revenues & Volume By Office for the Period 2022-2032F
- Historical Data and Forecast of Australia Black Board Market Revenues & Volume By Family for the Period 2022-2032F
- Historical Data and Forecast of Australia Black Board Market Revenues & Volume By Others for the Period 2022-2032F
- Australia Black Board Import Export Trade Statistics
- Market Opportunity Assessment By Product Type
- Market Opportunity Assessment By Application
- Australia Black Board Top Companies Market Share
- Australia Black Board Competitive Benchmarking By Technical and Operational Parameters
- Australia Black Board Company Profiles
- Australia Black Board Key Strategic Recommendations
Australia Black Board Market (2026-2032): FAQs
6Wresearch actively monitors the Australia Black Board Market and publishes its comprehensive annual report, highlighting emerging trends, growth drivers, revenue analysis, and forecast outlook. Our insights help businesses to make data-backed strategic decisions with ongoing market dynamics. Our analysts track relevent industries related to the Australia Black Board Market, allowing our clients with actionable intelligence and reliable forecasts tailored to emerging regional needs.
Yes, we provide customisation as per your requirements. To learn more, feel free to contact us on sales@6wresearch.com
1 Executive Summary |
2 Introduction |
2.1 Key Highlights of the Report |
2.2 Report Description |
2.3 Market Scope & Segmentation |
2.4 Research Methodology |
2.5 Assumptions |
3 Australia Black Board Market Overview |
3.1 Australia Country Macro Economic Indicators |
3.2 Australia Black Board Market Revenues & Volume, 2022 & 2032F |
3.3 Australia Black Board Market - Industry Life Cycle |
3.4 Australia Black Board Market - Porter's Five Forces |
3.5 Australia Black Board Market Revenues & Volume Share, By Product Type, 2022 & 2032F |
3.6 Australia Black Board Market Revenues & Volume Share, By Application, 2022 & 2032F |
4 Australia Black Board Market Dynamics |
4.1 Impact Analysis |
4.2 Market Drivers |
4.2.1 Increasing demand for interactive and collaborative learning environments in educational institutions |
4.2.2 Growing trend of remote work and online education, leading to higher adoption of black boards for virtual communication and collaboration |
4.2.3 Innovation in black board technologies, such as digital and interactive whiteboards, driving market growth |
4.3 Market Restraints |
4.3.1 Competition from alternative technologies like digital displays and projectors posing a threat to traditional black board sales |
4.3.2 Budget constraints in educational institutions and businesses affecting the adoption of black boards |
4.3.3 Limited product differentiation among black board manufacturers leading to pricing pressures |
5 Australia Black Board Market Trends |
6 Australia Black Board Market, By Types |
6.1 Australia Black Board Market, By Product Type |
6.1.1 Overview and Analysis |
6.1.2 Australia Black Board Market Revenues & Volume, By Product Type, 2022-2032F |
6.1.3 Australia Black Board Market Revenues & Volume, By Wall-mounted Board, 2022-2032F |
6.1.4 Australia Black Board Market Revenues & Volume, By Mobile Board, 2022-2032F |
6.1.5 Australia Black Board Market Revenues & Volume, By Others, 2022-2032F |
6.2 Australia Black Board Market, By Application |
6.2.1 Overview and Analysis |
6.2.2 Australia Black Board Market Revenues & Volume, By Schools, 2022-2032F |
6.2.3 Australia Black Board Market Revenues & Volume, By Office, 2022-2032F |
6.2.4 Australia Black Board Market Revenues & Volume, By Family, 2022-2032F |
6.2.5 Australia Black Board Market Revenues & Volume, By Others, 2022-2032F |
7 Australia Black Board Market Import-Export Trade Statistics |
7.1 Australia Black Board Market Export to Major Countries |
7.2 Australia Black Board Market Imports from Major Countries |
8 Australia Black Board Market Key Performance Indicators |
8.1 Adoption rate of digital and interactive black boards in educational institutions and corporate settings |
8.2 Frequency of black board replacements or upgrades in the market |
8.3 Level of investment in research and development for black board technologies by manufacturers |
9 Australia Black Board Market - Opportunity Assessment |
9.1 Australia Black Board Market Opportunity Assessment, By Product Type, 2022 & 2032F |
9.2 Australia Black Board Market Opportunity Assessment, By Application, 2022 & 2032F |
10 Australia Black Board Market - Competitive Landscape |
10.1 Australia Black Board Market Revenue Share, By Companies, 2025 |
10.2 Australia Black Board Market Competitive Benchmarking, By Operating and Technical Parameters |
11 Company Profiles |
12 Recommendations |
13 Disclaimer |
Global Go To Market Strategy - 2030
Export potential enables firms to identify high-growth global markets with greater confidence by combining advanced trade intelligence with a structured quantitative methodology. The framework analyzes emerging demand trends and country-level import patterns while integrating macroeconomic and trade datasets such as GDP and population forecasts, bilateral import–export flows, tariff structures, elasticity differentials between developed and developing economies, geographic distance, and import demand projections. Using weighted trade values from 2020–2024 as the base period to project country-to-country export potential for 2030, these inputs are operationalized through calculated drivers such as gravity model parameters, tariff impact factors, and projected GDP per-capita growth. Through an analysis of hidden potentials, demand hotspots, and market conditions that are most favorable to success, this method enables firms to focus on target countries, maximize returns, and global expansion with data, backed by accuracy.
By factoring in the projected importer demand gap that is currently unmet and could be potential opportunity, it identifies the potential for the Exporter (Country) among 190 countries, against the general trade analysis, which identifies the biggest importer or exporter.
To discover high-growth global markets and optimize your business strategy:
Click Here
Pricing
- Single User License$ 1,995
- Department License$ 2,400
- Site License$ 3,120
- Global License$ 3,795

Leadership Perspectives from Industry Events
Search
Thought Leadership and Analyst Meet


Our Clients
6WResearch In News
- India Air Conditioner Market Set for Strong Rebound in 2026 After Weather-Led Correction and GST-Driven Recovery: 6Wresearch
- ADAS in India: How Automatic Emergency Braking, Blind Spot Detection & Driver Monitoring are Transforming Road Safety
- Doha a strategic location for EV manufacturing hub: IPA Qatar
- Demand for luxury TVs surging in the GCC, says Samsung
- Empowering Growth: The Thriving Journey of Bangladesh’s Cable Industry
- Demand for luxury TVs surging in the GCC, says Samsung
Latest Reports
- Nicaragua RPG Gaming Market (2026-2032)
- New Zealand RPG Gaming Market (2026-2032)
- Netherlands RPG Gaming Market (2026-2032)
- Nauru RPG Gaming Market (2026-2032)
- Namibia RPG Gaming Market (2026-2032)
- Mozambique RPG Gaming Market (2026-2032)
- Montenegro RPG Gaming Market (2026-2032)
- Mongolia RPG Gaming Market (2026-2032)
- Monaco RPG Gaming Market (2026-2032)
- Micronesia RPG Gaming Market (2026-2032)
Industry Events and Analyst Meet

HIMTEX 2026

India Refining Summit 2026

India EV Show 2026

EV tech India Expo 2026

Auto Tech Asia 2026
Whitepaper
- Middle East & Africa Commercial Security Market Click here to view more.
- Middle East & Africa Fire Safety Systems & Equipment Market Click here to view more.
- GCC Drone Market Click here to view more.
- Middle East Lighting Fixture Market Click here to view more.
- GCC Physical & Perimeter Security Market Click here to view more.