Australia Buttermilk Market (2026-2032) Outlook | Analysis, Value, Industry, Revenue, Companies, Size, Growth, Trends, Share & Forecast
Market Forecast By Type (Powder, Liquid), By End-use Industry (Food & Beverage Industry, Foodservice Industry, Processed Food Industry), By Distribution Channel (Business to Business, Business to Consumer) And Competitive Landscape
| Product Code: ETC187427 | Publication Date: May 2022 | Updated Date: Mar 2026 | Product Type: Market Research Report | |
| Publisher: 6Wresearch | Author: Ravi Bhandari | No. of Pages: 60 | No. of Figures: 40 | No. of Tables: 7 |
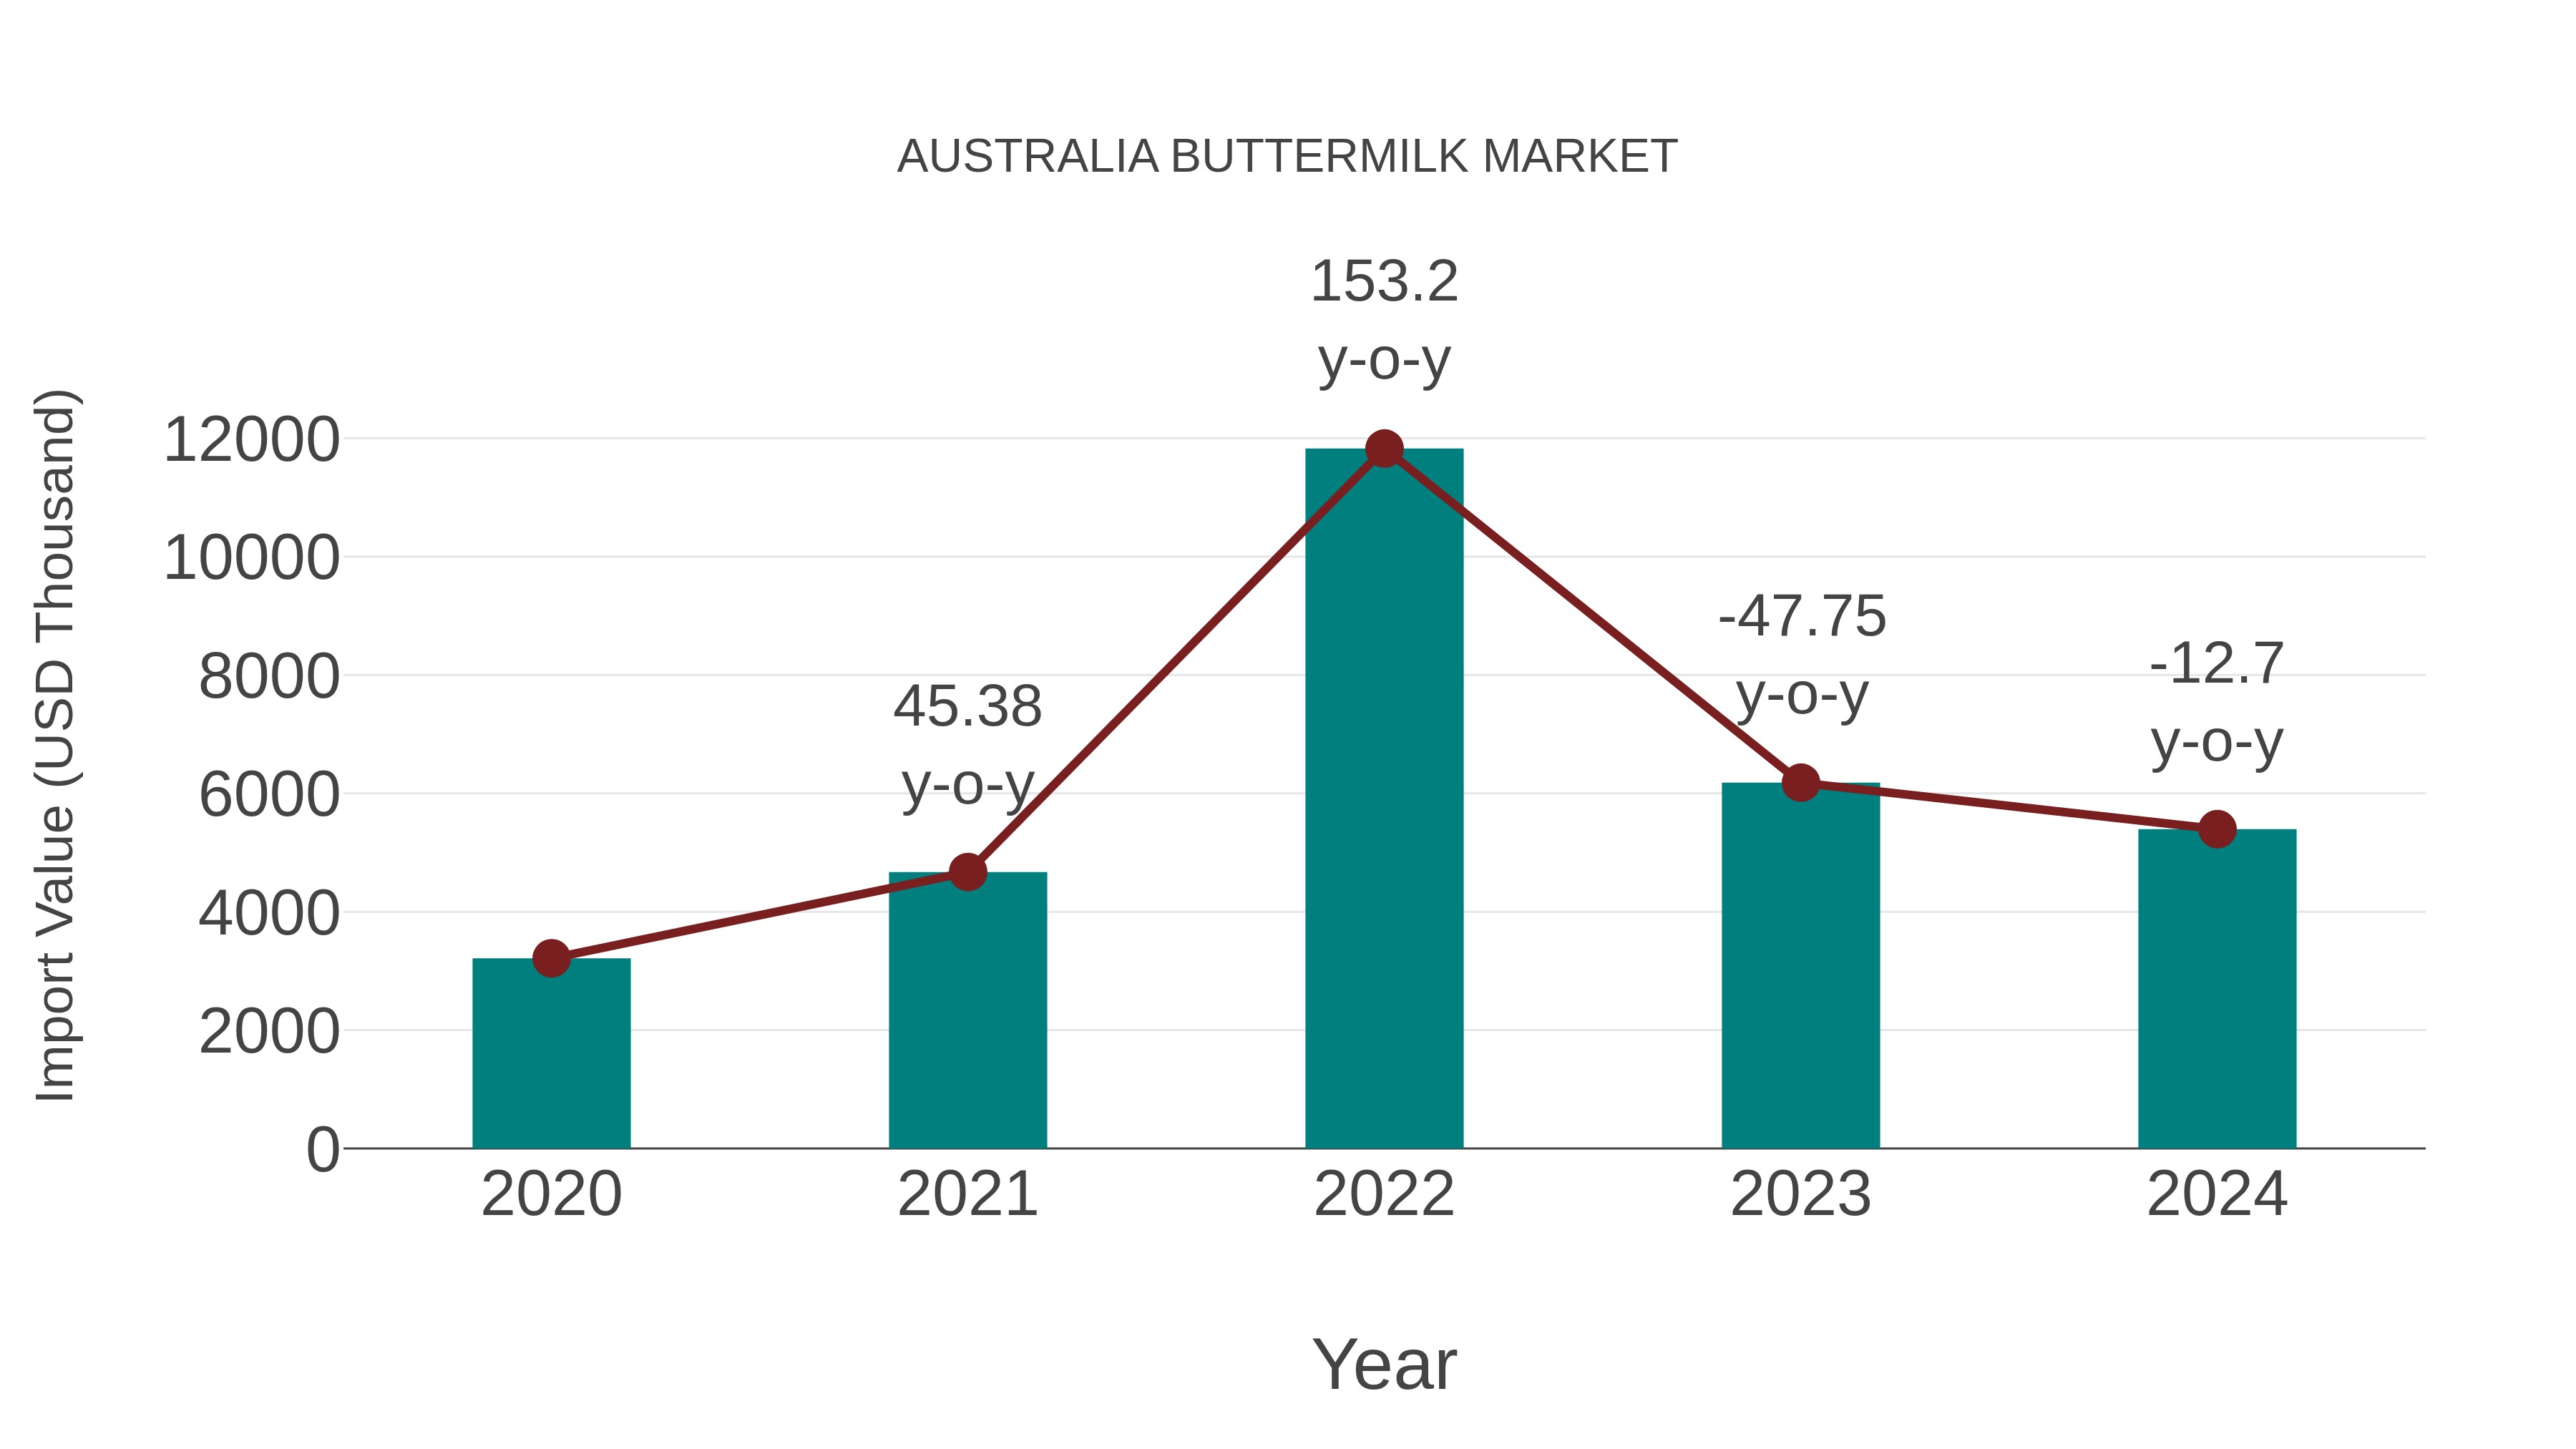
Australia Buttermilk Market: Import Trend Analysis
Australia`s import trend for the buttermilk market experienced a decline in growth rate from 2023 to 2024, decreasing by -12.7%. However, the compound annual growth rate (CAGR) for the period 2020-2024 stood at a positive 13.83%. This decline in import momentum could be attributed to shifting consumer preferences or changes in global trade dynamics impacting the market stability.
Australia Buttermilk Market Overview
Australia buttermilk market caters to consumers` demand for nutritious and versatile dairy products. With a focus on health and wellness, dairy producers offer buttermilk variants with low-fat and probiotic properties, positioning them as a healthy beverage option and ingredient in culinary applications.
Drivers of the market
The Australia buttermilk market is driven by factors such as the growing consumer preference for healthier beverage options, the rising demand for dairy-based products, and the increasing popularity of functional foods. Buttermilk is valued for its nutritional benefits, including probiotics, calcium, and vitamins, contributing to its popularity among health-conscious consumers. Moreover, the versatility of buttermilk in culinary applications, such as baking, cooking, and beverage blending, further drives market demand. Additionally, marketing efforts promoting buttermilk as a refreshing and nutritious drink contribute to market growth.
Challenges of the market
Challenges in the Australia buttermilk market include shelf-life extension and product differentiation. Adapting to changes in dairy processing technology and addressing concerns regarding buttermilk packaging are ongoing challenges for suppliers.
Government Policy of the market
The buttermilk market in Australia encompasses the production and sale of buttermilk, a dairy beverage produced as a byproduct of butter production or by culturing milk with lactic acid bacteria. Buttermilk is commonly consumed as a beverage or used as an ingredient in cooking and baking, imparting a tangy flavor and creamy texture to dishes. In Australia, buttermilk is available in both traditional and cultured forms, with variations in fat content and flavor profiles. Government regulations may govern dairy industry standards, product labeling, and food safety requirements for buttermilk production and distribution. Market dynamics are influenced by factors such as milk production levels, consumer demand for dairy products, dietary preferences, and culinary trends.
Key Highlights of the Report:
- Australia Buttermilk Market Outlook
- Market Size of Australia Buttermilk Market, 2025
- Forecast of Australia Buttermilk Market, 2032
- Historical Data and Forecast of Australia Buttermilk Revenues & Volume for the Period 2022-2032F
- Australia Buttermilk Market Trend Evolution
- Australia Buttermilk Market Drivers and Challenges
- Australia Buttermilk Price Trends
- Australia Buttermilk Porter's Five Forces
- Australia Buttermilk Industry Life Cycle
- Historical Data and Forecast of Australia Buttermilk Market Revenues & Volume By Type for the Period 2022-2032F
- Historical Data and Forecast of Australia Buttermilk Market Revenues & Volume By Powder for the Period 2022-2032F
- Historical Data and Forecast of Australia Buttermilk Market Revenues & Volume By Liquid for the Period 2022-2032F
- Historical Data and Forecast of Australia Buttermilk Market Revenues & Volume By End-use Industry for the Period 2022-2032F
- Historical Data and Forecast of Australia Buttermilk Market Revenues & Volume By Food & Beverage Industry for the Period 2022-2032F
- Historical Data and Forecast of Australia Buttermilk Market Revenues & Volume By Foodservice Industry for the Period 2022-2032F
- Historical Data and Forecast of Australia Buttermilk Market Revenues & Volume By Processed Food Industry for the Period 2022-2032F
- Historical Data and Forecast of Australia Buttermilk Market Revenues & Volume By Distribution Channel for the Period 2022-2032F
- Historical Data and Forecast of Australia Buttermilk Market Revenues & Volume By Business to Business for the Period 2022-2032F
- Historical Data and Forecast of Australia Buttermilk Market Revenues & Volume By Business to Consumer for the Period 2022-2032F
- Australia Buttermilk Import Export Trade Statistics
- Market Opportunity Assessment By Type
- Market Opportunity Assessment By End-use Industry
- Market Opportunity Assessment By Distribution Channel
- Australia Buttermilk Top Companies Market Share
- Australia Buttermilk Competitive Benchmarking By Technical and Operational Parameters
- Australia Buttermilk Company Profiles
- Australia Buttermilk Key Strategic Recommendations
Australia Buttermilk Market (2026-2032): FAQs
6Wresearch actively monitors the Australia Buttermilk Market and publishes its comprehensive annual report, highlighting emerging trends, growth drivers, revenue analysis, and forecast outlook. Our insights help businesses to make data-backed strategic decisions with ongoing market dynamics. Our analysts track relevent industries related to the Australia Buttermilk Market, allowing our clients with actionable intelligence and reliable forecasts tailored to emerging regional needs.
Yes, we provide customisation as per your requirements. To learn more, feel free to contact us on sales@6wresearch.com
1 Executive Summary |
2 Introduction |
2.1 Key Highlights of the Report |
2.2 Report Description |
2.3 Market Scope & Segmentation |
2.4 Research Methodology |
2.5 Assumptions |
3 Australia Buttermilk Market Overview |
3.1 Australia Country Macro Economic Indicators |
3.2 Australia Buttermilk Market Revenues & Volume, 2022 & 2032F |
3.3 Australia Buttermilk Market - Industry Life Cycle |
3.4 Australia Buttermilk Market - Porter's Five Forces |
3.5 Australia Buttermilk Market Revenues & Volume Share, By Type, 2022 & 2032F |
3.6 Australia Buttermilk Market Revenues & Volume Share, By End-use Industry, 2022 & 2032F |
3.7 Australia Buttermilk Market Revenues & Volume Share, By Distribution Channel, 2022 & 2032F |
4 Australia Buttermilk Market Dynamics |
4.1 Impact Analysis |
4.2 Market Drivers |
4.2.1 Increasing consumer awareness about the health benefits of buttermilk |
4.2.2 Growing demand for natural and organic dairy products |
4.2.3 Rising popularity of buttermilk-based beverages and smoothies |
4.3 Market Restraints |
4.3.1 Fluctuating prices of raw milk and dairy products |
4.3.2 Competition from alternative plant-based milk products |
4.3.3 Seasonal variations in milk production affecting buttermilk availability |
5 Australia Buttermilk Market Trends |
6 Australia Buttermilk Market, By Types |
6.1 Australia Buttermilk Market, By Type |
6.1.1 Overview and Analysis |
6.1.2 Australia Buttermilk Market Revenues & Volume, By Type, 2022-2032F |
6.1.3 Australia Buttermilk Market Revenues & Volume, By Powder, 2022-2032F |
6.1.4 Australia Buttermilk Market Revenues & Volume, By Liquid, 2022-2032F |
6.2 Australia Buttermilk Market, By End-use Industry |
6.2.1 Overview and Analysis |
6.2.2 Australia Buttermilk Market Revenues & Volume, By Food & Beverage Industry, 2022-2032F |
6.2.3 Australia Buttermilk Market Revenues & Volume, By Foodservice Industry, 2022-2032F |
6.2.4 Australia Buttermilk Market Revenues & Volume, By Processed Food Industry, 2022-2032F |
6.3 Australia Buttermilk Market, By Distribution Channel |
6.3.1 Overview and Analysis |
6.3.2 Australia Buttermilk Market Revenues & Volume, By Business to Business, 2022-2032F |
6.3.3 Australia Buttermilk Market Revenues & Volume, By Business to Consumer, 2022-2032F |
7 Australia Buttermilk Market Import-Export Trade Statistics |
7.1 Australia Buttermilk Market Export to Major Countries |
7.2 Australia Buttermilk Market Imports from Major Countries |
8 Australia Buttermilk Market Key Performance Indicators |
8.1 Average selling price of buttermilk |
8.2 Number of new product launches in the buttermilk segment |
8.3 Consumer satisfaction ratings for buttermilk products |
9 Australia Buttermilk Market - Opportunity Assessment |
9.1 Australia Buttermilk Market Opportunity Assessment, By Type, 2022 & 2032F |
9.2 Australia Buttermilk Market Opportunity Assessment, By End-use Industry, 2022 & 2032F |
9.3 Australia Buttermilk Market Opportunity Assessment, By Distribution Channel, 2022 & 2032F |
10 Australia Buttermilk Market - Competitive Landscape |
10.1 Australia Buttermilk Market Revenue Share, By Companies, 2025 |
10.2 Australia Buttermilk Market Competitive Benchmarking, By Operating and Technical Parameters |
11 Company Profiles |
12 Recommendations |
13 Disclaimer |
Global Go To Market Strategy - 2030
Export potential enables firms to identify high-growth global markets with greater confidence by combining advanced trade intelligence with a structured quantitative methodology. The framework analyzes emerging demand trends and country-level import patterns while integrating macroeconomic and trade datasets such as GDP and population forecasts, bilateral import–export flows, tariff structures, elasticity differentials between developed and developing economies, geographic distance, and import demand projections. Using weighted trade values from 2020–2024 as the base period to project country-to-country export potential for 2030, these inputs are operationalized through calculated drivers such as gravity model parameters, tariff impact factors, and projected GDP per-capita growth. Through an analysis of hidden potentials, demand hotspots, and market conditions that are most favorable to success, this method enables firms to focus on target countries, maximize returns, and global expansion with data, backed by accuracy.
By factoring in the projected importer demand gap that is currently unmet and could be potential opportunity, it identifies the potential for the Exporter (Country) among 190 countries, against the general trade analysis, which identifies the biggest importer or exporter.
To discover high-growth global markets and optimize your business strategy:
Click Here
Pricing
- Single User License$ 1,995
- Department License$ 2,400
- Site License$ 3,120
- Global License$ 3,795

Leadership Perspectives from Industry Events
Search
Thought Leadership and Analyst Meet


Our Clients
6WResearch In News
- India Export Attractiveness Tracker 2026
- India Air Conditioner Market Set for Strong Rebound in 2026 After Weather-Led Correction and GST-Driven Recovery: 6Wresearch
- ADAS in India: How Automatic Emergency Braking, Blind Spot Detection & Driver Monitoring are Transforming Road Safety
- Doha a strategic location for EV manufacturing hub: IPA Qatar
- Demand for luxury TVs surging in the GCC, says Samsung
- Empowering Growth: The Thriving Journey of Bangladesh’s Cable Industry
Latest Reports
- Nicaragua RPG Gaming Market (2026-2032)
- New Zealand RPG Gaming Market (2026-2032)
- Netherlands RPG Gaming Market (2026-2032)
- Nauru RPG Gaming Market (2026-2032)
- Namibia RPG Gaming Market (2026-2032)
- Mozambique RPG Gaming Market (2026-2032)
- Montenegro RPG Gaming Market (2026-2032)
- Mongolia RPG Gaming Market (2026-2032)
- Monaco RPG Gaming Market (2026-2032)
- Micronesia RPG Gaming Market (2026-2032)
Industry Events and Analyst Meet

EV India Expo 2026

HIMTEX 2026

India Refining Summit 2026

India EV Show 2026

EV tech India Expo 2026
Whitepaper
- Middle East & Africa Commercial Security Market Click here to view more.
- Middle East & Africa Fire Safety Systems & Equipment Market Click here to view more.
- GCC Drone Market Click here to view more.
- Middle East Lighting Fixture Market Click here to view more.
- GCC Physical & Perimeter Security Market Click here to view more.