Australia Cable Tray Market (2023-2029) | Size, Forecast, Growth, Share, Trends, Industry, Companies, Revenue, Outlook, Analysis & Value
By Material Types (Steel Cable Tray, Stainless Cable Tray, Aluminum Cable Tray, FRP Cable Tray),By Types (Ladder Cable Tray, Trough & Perforated Cable Tray, Solid Cable Tray, Single Rail Cable Tray, Channel Rail Cable Tray, Wire Mesh Rail Cable Tray),By Thickness (Below 1.5 MM, 1.5-2.5 MM, Above 2.5 MM), By Applications (Power Utilities, Construction, Industrial, Other Applications)
| Product Code: ETC5928348 | Publication Date: Aug 2023 | Updated Date: Aug 2025 | Product Type: Report | |
| Publisher: 6Wresearch | Author: Ravi Bhandari | No. of Pages: 86 | No. of Figures: 24 | No. of Tables: 6 |
Australia Cable Tray Market Synopsis
The Australia cable tray market had steady growth driven by urbanization, developments in the residential, commercial, and industrial sectors. However, in the year 2020 country witnessed a downturn due to the Covid-19 pandemic, which led to a contraction in the economy. The pandemic had significant repercussions on various industries, causing decrease in investments and uncertainty, and also slowing down commercial construction projects such as One Sydney Harbour – Barangaroo, Collins Arch – Melbourne, and Adelaide Casino Expansion - South Australia. The power sector, a major consumer of cable trays, also faced a decline as Australia's net energy supply dropped by 6.9% in 2020-21 to 23,930 PJ, energy exports decreased by 7.0% to 18,338 PJ, and industry energy end use declined by 4.3% to 2,676 PJ.
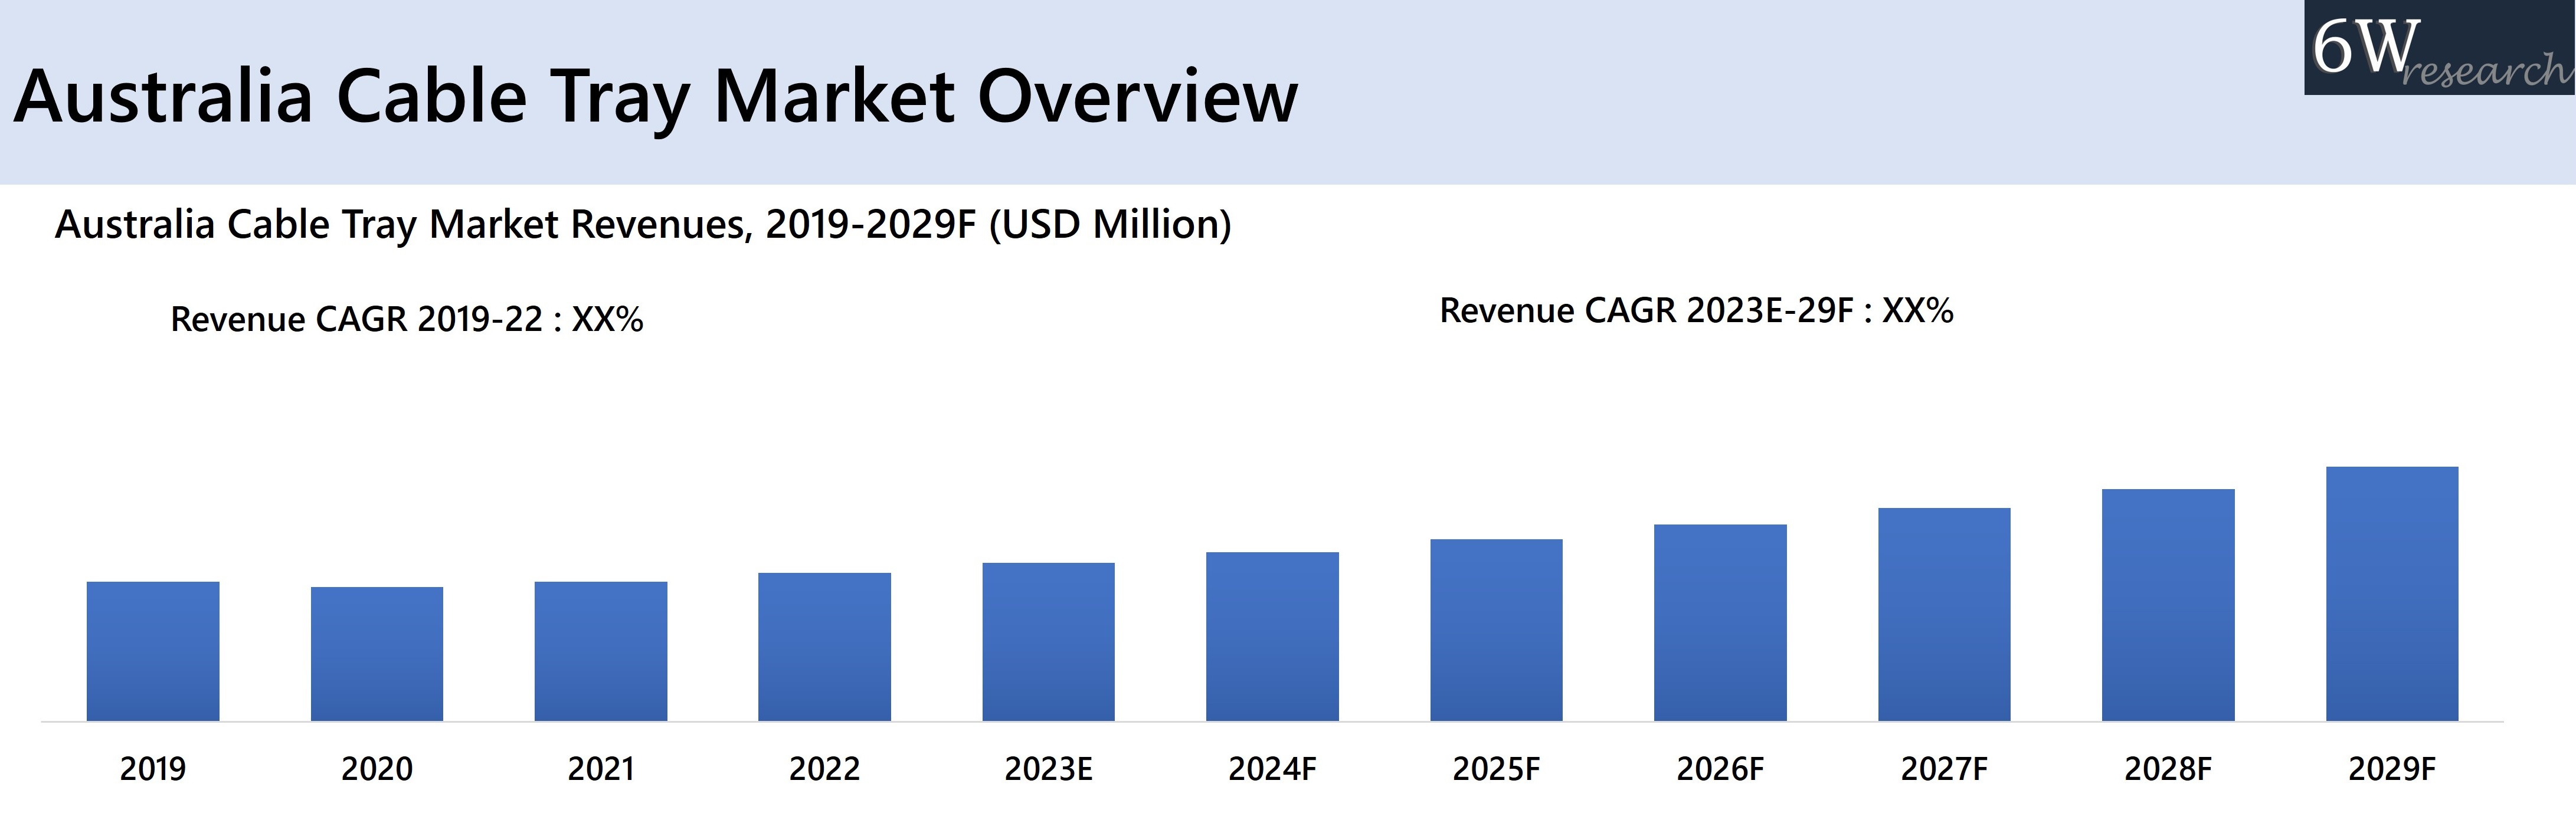 According to 6Wresearch, Australia Cable Tray Market size is anticipated to grow at a CAGR of 8.3% during 2023-2029. Annually, the Australian construction industry holds a value of approximately US$112 billion, contributing around 9% to the country's GDP. In February 2021, Infrastructure Australia (IA) introduced a robust infrastructure priority list, encompassing 44 new infrastructure proposals, marking a significant addition. This list for 2021 comprises a record-breaking 163 major infrastructure proposals, categorized as Priority Projects, High Priority Initiatives, and Priority Initiatives. Moreover, in May 2021, the Australian Government announced an additional allocation of approximately US$11.3 billion to further bolster infrastructure projects as part of its Federal Budget. Notably, the Australian Budget for October 2022–23 allocates an unprecedented A$25 billion to support clean energy and renewables projects, demonstrating a strong commitment towards the government's net zero target by 2050, providing a clear sense of direction and backing. The growing construction sector would generate a higher demand for these efficient cable management solutions, propelling manufacturers and suppliers to cater to the rising requirements, thereby boosting the growth of Cable Tray Market in Australia.
![Australia Cable Tray Market Revenue Share]() Market by Material Types
Market by Material Types
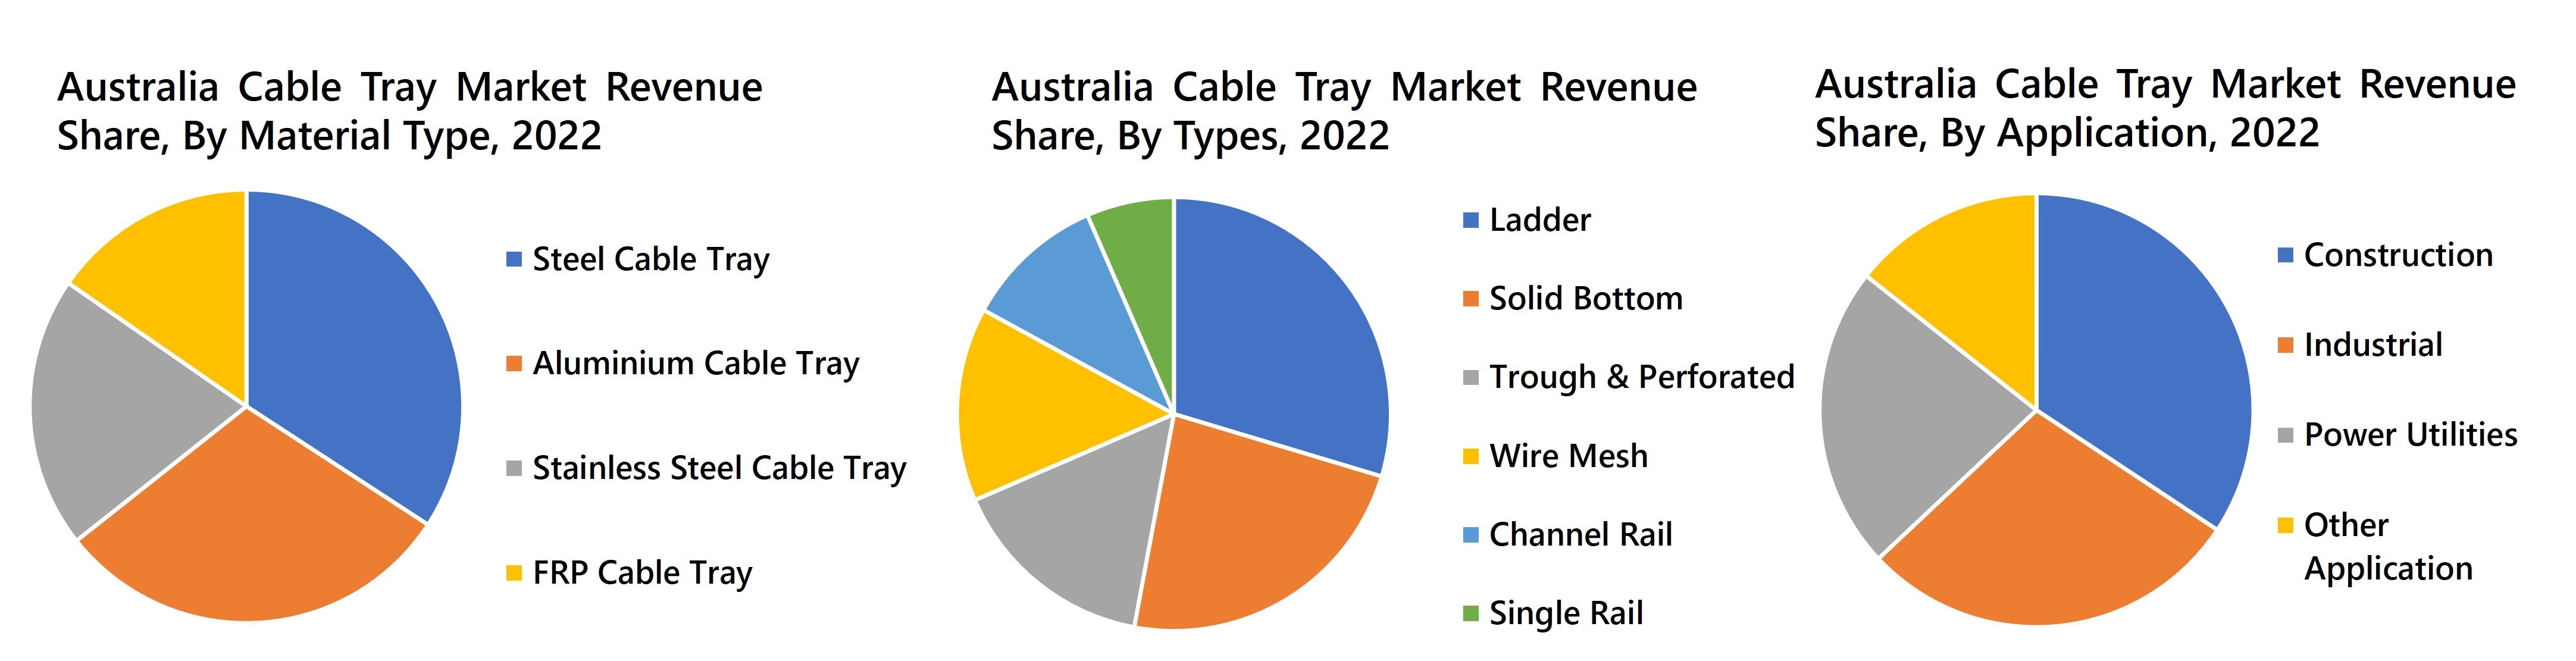
By material types, steel cable tray holds the major share in Australia cable tray market owing to their wide applicability in industries, such as power generation, petrochemicals, manufacturing, and commercial construction. The similar segment will continue to grow in the industry. Aluminium tray segment can also rise in the years to come.
Market by Types
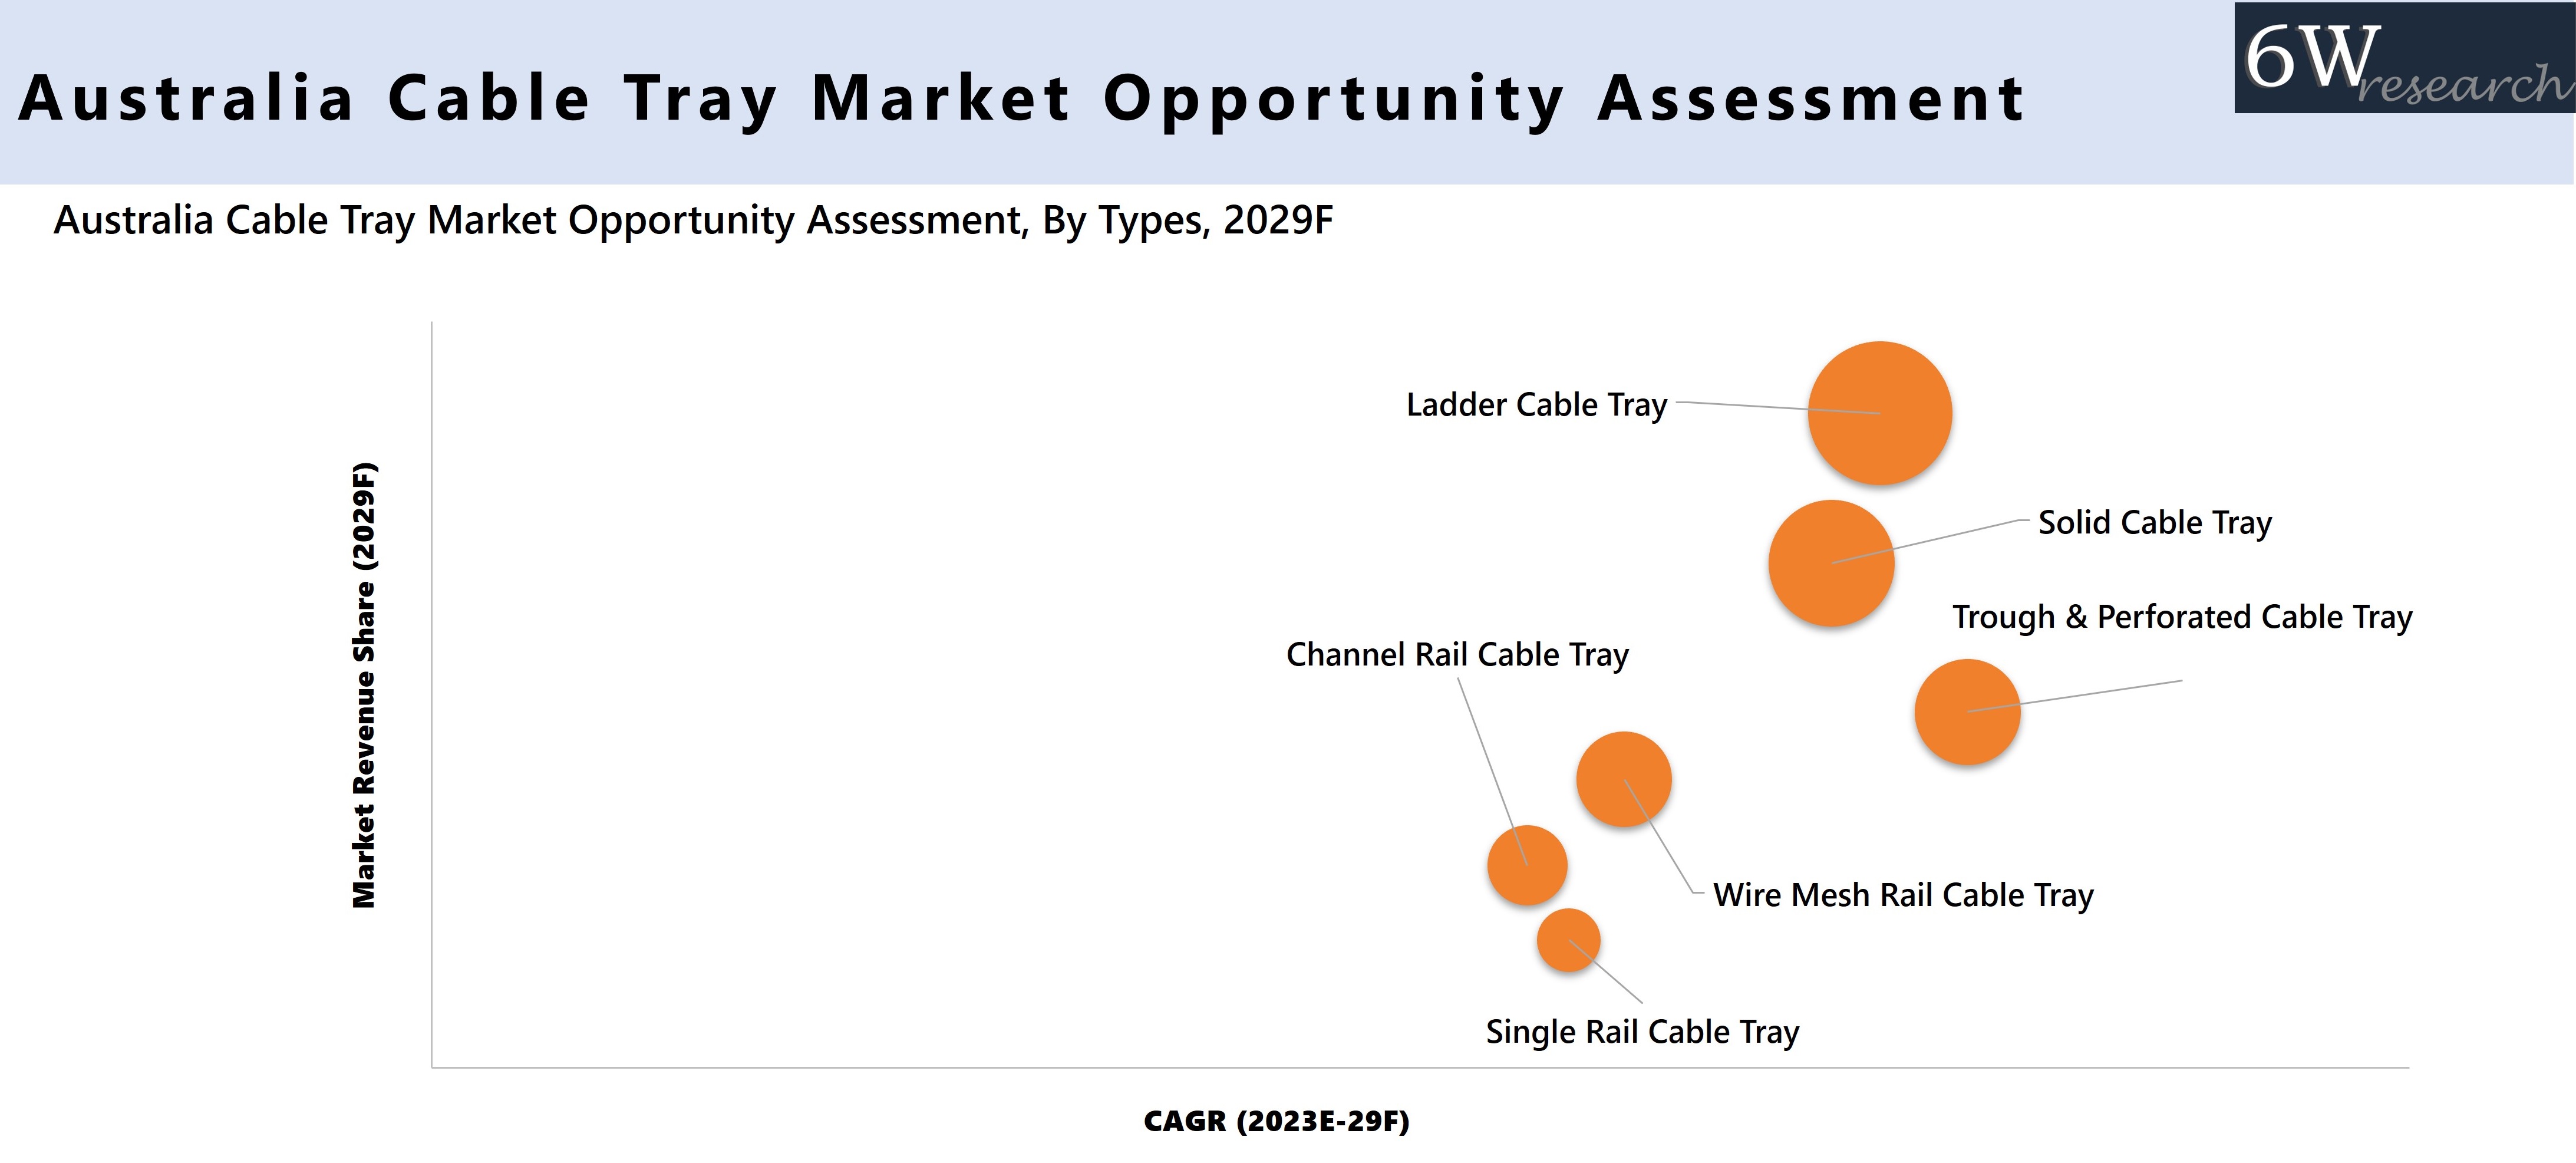
Due to its high load-bearing capacity and wide range of applications in heavy industries such as power generation, oil and gas, and petrochemicals, ladder cable tray has emerged as the dominant type, capturing a significant share in the Australia Cable Tray Industry.
Market by Thickness
Rising industrial and commercial sector on account of developmental projects would drive 1.5 – 2.5mm cable tray market in the forecast years. These cables are preferred in Australia due to its ability to carry cables, pipes etc. under varying loading conditions.
Market by Applications
Backed by the government major infrastructure projects such as WestConnex motorway, the Sydney Metro and Melbourne metro tunnel projects; construction sector is expected to register highest growth in the forecast years in cable tray market.
![Australia Cable Tray Market Opportunity Assessment]() Key Attractiveness of the Report
Key Attractiveness of the Report
- COVID-19 Impact on the Market.
- 11 Years Market Numbers.
- Historical Data Starting from 2019 to 2022.
- Base Year: 2022
- Forecast Data until 2029.
- Key Performance Indicators Impacting the Market.
- Major Upcoming Developments and Projects.
Key Highlights of the Report:
- Australia Cable Tray Market Overview
- Australia Cable Tray Market Outlook
- Australia Cable Tray Market Forecast
- Historical Data and Forecast of Australia Cable Tray Market Revenues for the Period 2019-2029F
- Historical Data and Forecast of Australia Cable Tray Market Revenues, By Material Type, for the Period 2019-2029F
- Historical Data and Forecast of Australia Cable Tray Market Revenues, By Types, for the Period 2019-2029F
- Historical Data and Forecast of Australia Cable Tray Market Revenues, By Thickness, for the Period 2019-2029F
- Historical Data and Forecast of Australia Cable Tray Market Revenues, By Applications, for the Period 2019-2029F
- Market Drivers and Restraints
- Australia Cable Tray Market Trends
- Industry Life Cycle
- Porter’s Five Force Analysis
- Market Opportunity Assessment
- Australia Cable Tray Market Revenue Ranking, By Companies
- Company Profiles
- Key Strategic Recommendations
Market Scope and Segmentation
Thereportprovides a detailed analysis of the following market segments:
By Material Types
- Steel Cable Tray
- Stainless Cable Tray
- Aluminum Cable Tray
- FRP Cable Tray
By Types
- Ladder Cable Tray
- Trough & Perforated Cable Tray
- Solid Cable Tray
- Single Rail Cable Tray
- Channel Rail Cable Tray
- Wire Mesh Rail Cable Tray
By Thickness
- Below 1.5 MM
- 1.5-2.5 MM
- Above 2.5 MM
By Applications
- Power Utilities
- Construction
- Industrial
- Other Applications
Australia Cable Tray Market: FAQs
Australia Cable Tray Market size is anticipated to grow at a CAGR of 8.3% during 2023-2029.
The growing construction sector would generate a higher demand for these efficient cable management solutions, propelling manufacturers and suppliers to cater to the rising requirements, thereby boosting the growth of the Cable Tray Market in Australia.
Rising industrial and commercial sectors on account of developmental projects would drive 1.5 – 2.5mm cable tray market in the forecast years.
Segments that are covered in the market report are by material types, types, thickness, and applications.
6Wresearch actively monitors the Australia Cable Tray Market and publishes its comprehensive annual report, highlighting emerging trends, growth drivers, revenue analysis, and forecast outlook. Our insights help businesses to make data-backed strategic decisions with ongoing market dynamics. Our analysts track relevent industries related to the Australia Cable Tray Market, allowing our clients with actionable intelligence and reliable forecasts tailored to emerging regional needs.
Yes, we provide customisation as per your requirements. To learn more, feel free to contact us on sales@6wresearch.com
| 1. Executive Summary |
| 2. Introduction |
| 2.1 Report Description |
| 2.2 Key Highlights of the Report |
| 2.3 Market Scope & Segmentation |
| 2.4 Methodology Adopted & Key Data Points |
| 2.5 Assumptions |
| 3. Australia Cable Tray Market Overview |
| 3.1 Australia Cable Tray Market Revenues, 2019-2029F |
| 3.2 Australia Cable Tray Market Industry Life Cycle |
| 3.3 Australia Cable Tray Market Value Chain & Ecosystem |
| 3.4 Australia Cable Tray Market Porter’s Five Forces |
| 4. COVID-19 Impact Analysis on Australia Cable Tray Market |
| 5. Australia Cable Tray Market Dynamics |
| 5.1 Impact Analysis |
| 5.2 Market Drivers |
| 5.2.1 Increasing construction activities in Australia |
| 5.2.2 Growing demand for efficient cable management systems |
| 5.2.3 Adoption of advanced technologies in the infrastructure sector |
| 5.3 Market Restraints |
| 5.3.1 Fluctuating raw material prices |
| 5.3.2 Intense competition from alternative cable management solutions |
| 5.3.3 Regulatory challenges related to safety and environmental standards |
| 6. Australia Cable Tray Market Trends & Evolution |
| 7. Australia Cable Tray Overview, By Market Segmentation |
| 7.1. Australia Cable Tray Market Revenue Share and Revenues, By Material Types (2019-2029F) |
| 7.1.1 Australia Cable Tray Market Revenues, By Aluminium (2019-2029F) |
| 7.1.2 Australia Cable Tray Market Revenues, By Steel (2019-2029F) |
| 7.1.3 Australia Cable Tray Market Revenues, By Stainless Steel (2019-2029F) |
| 7.1.4 Australia Cable Tray Market Revenues, By FRP (2019-2029F) |
| 7.2. Australia Cable Tray Market Revenue Share and Revenues, By Types (2019-2029F) |
| 7.2.1 Australia Cable Tray Market Revenues, By Ladder (2019-2029F) |
| 7.2.2 Australia Cable Tray Market Revenues, By Trough & Perforated (2019-2029F) |
| 7.2.3 Australia Cable Tray Market Revenues, By Solid (2019-2029F) |
| 7.2.4 Australia Cable Tray Market Revenues, By Single Rail (2019-2029F) |
| 7.2.5 Australia Cable Tray Market Revenues, By Channel Rail (2019-2029F) |
| 7.2.6 Australia Cable Tray Market Revenues, By Wire Mesh (2019-2029F) |
| 7.3. Australia Cable Tray Market Revenue Share and Revenues, By Thickness (2019-2029F) |
| 7.3.1 Australia Cable Tray Market Revenues, By Below 1.5 mm (2019-2029F) |
| 7.3.2 Australia Cable Tray Market Revenues, By 1.5-2.5 mm (2019-2029F) |
| 7.3.3 Australia Cable Tray Market Revenues, By Above 2.5 mm (2019-2029F) |
| 7.4. Australia Cable Tray Market Revenue Share and Revenues, By Application (2019-2029F) |
| 7.4.1 Australia Cable Tray Market Revenues, By Power Utilities (2019-2029F) |
| 7.4.2 Australia Cable Tray Market Revenues, By Construction (2019-2029F) |
| 7.4.3 Australia Cable Tray Market Revenues, By Industrial (2019-2029F) |
| 7.4.4 Australia Cable Tray Market Revenues, By Others (2019-2029F) |
| 8. Australia Cable Tray Market Entry Strategies |
| 9. Australia Cable Tray Market 4 Ps Marketing Analysis |
| 10. Australia Cable Tray Market Government Taxes and Regulations |
| 11. Australia Cable Tray Market Import Analysis |
| 12. Australia Cable Tray Market Key Performing Indicators |
| 13. Australia Cable Tray Market Opportunity Assessment |
| 13.1. Australia Cable Tray Market Opportunity Assessment, By Material Type, 2029F |
| 13.2. Australia Cable Tray Market Opportunity Assessment, By Types, 2029F |
| 13.3. Australia Cable Tray Market Opportunity Assessment, By Thickness, 2029F |
| 13.4. Australia Cable Tray Market Opportunity Assessment, By Applications, 2029F |
| 14. Australia Cable Tray Market Competitive Landscape |
| 14.1. Australia Cable Tray Market Revenues Ranking, By Companies, 2022 |
| 14.2. Australia Cable Tray Market Competitive Benchmarking, By Technical Parameters |
| 14.3. Australia Cable Tray Market Competitive Benchmarking, By SWOT Analysis |
| 14.4. Australia Cable Tray Market Competitive Benchmarking, By Operating Parameters |
| 15. Company Profiles |
| 15.1. Legrand Australia |
| 15.2. B&R Enclosures Pty Ltd |
| 15.3. Atkore Unistrut |
| 15.4. EzyStrut Cable & Pipe Supports |
| 15.5. Electrix International Ltd |
| 15.6. Kounis Group Pty Ltd |
| 15.7. Brilltech Engineers Pvt Ltd |
| 15.8. Flexistrut Australia |
| 15.9. Burndy Cable Support System |
| 15.10. Cableaway Pty Ltd |
| 16. Key Strategic Recommendations |
| 17. Disclaimer |
| List of Figures |
| 1. Australia Cable Tray Market Revenues, 2019-2029F (USD Million) |
| 2. Australia Value of Construction Work Done, Growth (%), (Dec 19 to Dec 20) |
| 3. Australia Value of Total Building Construction Work Done, $m, 2020 |
| 4. Total Number of Data Centers in Asia-Pacific, 2021 |
| 5. Australia Internet Users, 2019-2022, Million |
| 6. Australia forecasts of total construction activity for New South Wales, 2019-2026, USD Million |
| 7. Australia Cable Tray Market Revenue Share, By Material Type, 2022 |
| 8. Australia Cable Tray Market Revenue Share, By Material Type, 2029F |
| 9. Australia Cable Tray Market Revenue Share, By Types, 2022 |
| 10. Australia Cable Tray Market Revenue Share, By Types, 2029F |
| 11. Australia Cable Tray Market Revenue Share, By Thickness, 2022 |
| 12. Australia Cable Tray Market Revenue Share, By Thickness, 2029F |
| 13. Australia Cable Tray Market Revenue Share, By Applications, 2022 |
| 14. Australia Cable Tray Market Revenue Share, By Applications, 2029F |
| 15. Australia Household (Percentile) peak bandwidth demand, 2018 & 2028, Mbps |
| 16. Australia Electricity, Gas, Water And Waste Services Income Growth (%), 2015-16 to 2021-22 |
| 17. Australia Cable Tray Market Opportunity Assessment, Material Types, 2029F |
| 18. Australia Cable Tray Market Opportunity Assessment, By Types, 2029F |
| 19. Australia Cable Tray Market Opportunity Assessment, By Thickness, 2029F |
| 20. Australia Cable Tray Market Opportunity Assessment, By Applications, 2029F |
| 21. Australia Cable Tray Market Revenues Ranking, 2022 |
| 22. Australia National Broadband Network Wholesale - Residential Broadband Market Shares, 2017-2020 |
| 23. Australia National Broadband Network Subscription Share, 2020-2021, (Millions) |
| 24. Australia National Broadband Network 100+ Mbps Subscription Share, 2020-2021, (Millions) |
| List of Tables |
| 1. Australia Cable Tray Market Revenues, By Material Types, 2019-2029F (USD Million) |
| 2. Australia Cable Tray Market Revenues, By Types, 2019-2029F (USD Million) |
| 3. Australia Cable Tray Market Revenues, By Thickness, 2019-2029F (USD Million) |
| 4. Australia Cable Tray Market Revenues, By Applications, 2019-2029F (USD Million) |
| 5. Australia Exchange Rate For Indian Currency, 12/7/23 to 17/7/23 (Rupee) |
| 6. Australia Import Processing Charges (IPCs ), (AUD) |
Global Go To Market Strategy - 2030
Export potential enables firms to identify high-growth global markets with greater confidence by combining advanced trade intelligence with a structured quantitative methodology. The framework analyzes emerging demand trends and country-level import patterns while integrating macroeconomic and trade datasets such as GDP and population forecasts, bilateral import–export flows, tariff structures, elasticity differentials between developed and developing economies, geographic distance, and import demand projections. Using weighted trade values from 2020–2024 as the base period to project country-to-country export potential for 2030, these inputs are operationalized through calculated drivers such as gravity model parameters, tariff impact factors, and projected GDP per-capita growth. Through an analysis of hidden potentials, demand hotspots, and market conditions that are most favorable to success, this method enables firms to focus on target countries, maximize returns, and global expansion with data, backed by accuracy.
By factoring in the projected importer demand gap that is currently unmet and could be potential opportunity, it identifies the potential for the Exporter (Country) among 190 countries, against the general trade analysis, which identifies the biggest importer or exporter.
To discover high-growth global markets and optimize your business strategy:
Click Here
Pricing
- Single User License$ 1,995
- Department License$ 2,400
- Site License$ 3,120
- Global License$ 3,795

Leadership Perspectives from Industry Events
Search
Thought Leadership and Analyst Meet


Our Clients
6WResearch In News
- Doha a strategic location for EV manufacturing hub: IPA Qatar
- Demand for luxury TVs surging in the GCC, says Samsung
- Empowering Growth: The Thriving Journey of Bangladesh’s Cable Industry
- Demand for luxury TVs surging in the GCC, says Samsung
- Video call with a traditional healer? Once unthinkable, it’s now common in South Africa
- Intelligent Buildings To Smooth GCC’s Path To Net Zero
Latest Reports
- New Zealand Aseptic Manufacturing Market (2026-2032)
- Netherlands Aseptic Manufacturing Market (2026-2032)
- Nauru Aseptic Manufacturing Market (2026-2032)
- Namibia Aseptic Manufacturing Market (2026-2032)
- Mozambique Aseptic Manufacturing Market (2026-2032)
- Montenegro Aseptic Manufacturing Market (2026-2032)
- Mongolia Aseptic Manufacturing Market (2026-2032)
- Monaco Aseptic Manufacturing Market (2026-2032)
- Micronesia Aseptic Manufacturing Market (2026-2032)
- Mauritius Aseptic Manufacturing Market (2026-2032)
Industry Events and Analyst Meet

HIMTEX 2026

India Refining Summit 2026

India EV Show 2026

EV tech India Expo 2026

Auto Tech Asia 2026
Whitepaper
- Middle East & Africa Commercial Security Market Click here to view more.
- Middle East & Africa Fire Safety Systems & Equipment Market Click here to view more.
- GCC Drone Market Click here to view more.
- Middle East Lighting Fixture Market Click here to view more.
- GCC Physical & Perimeter Security Market Click here to view more.