Australia Canned Vegetables Market (2026-2032) | Trends, Forecast, Size, Industry, Share, Analysis, COVID-19 IMPACT, Revenue, Value, Growth & Companies
Market Forecast By Type (Tomatoes, Carrot, Peas, Corn, Spinach, Vegetable Blend, Others), By Category (Organic, Conventional), By Distribution Channel (Store-Based, Non-Store-Based) And Competitive Landscape
| Product Code: ETC175434 | Publication Date: Jan 2022 | Updated Date: Mar 2026 | Product Type: Market Research Report | |
| Publisher: 6Wresearch | Author: Ravi Bhandari | No. of Pages: 70 | No. of Figures: 35 | No. of Tables: 5 |
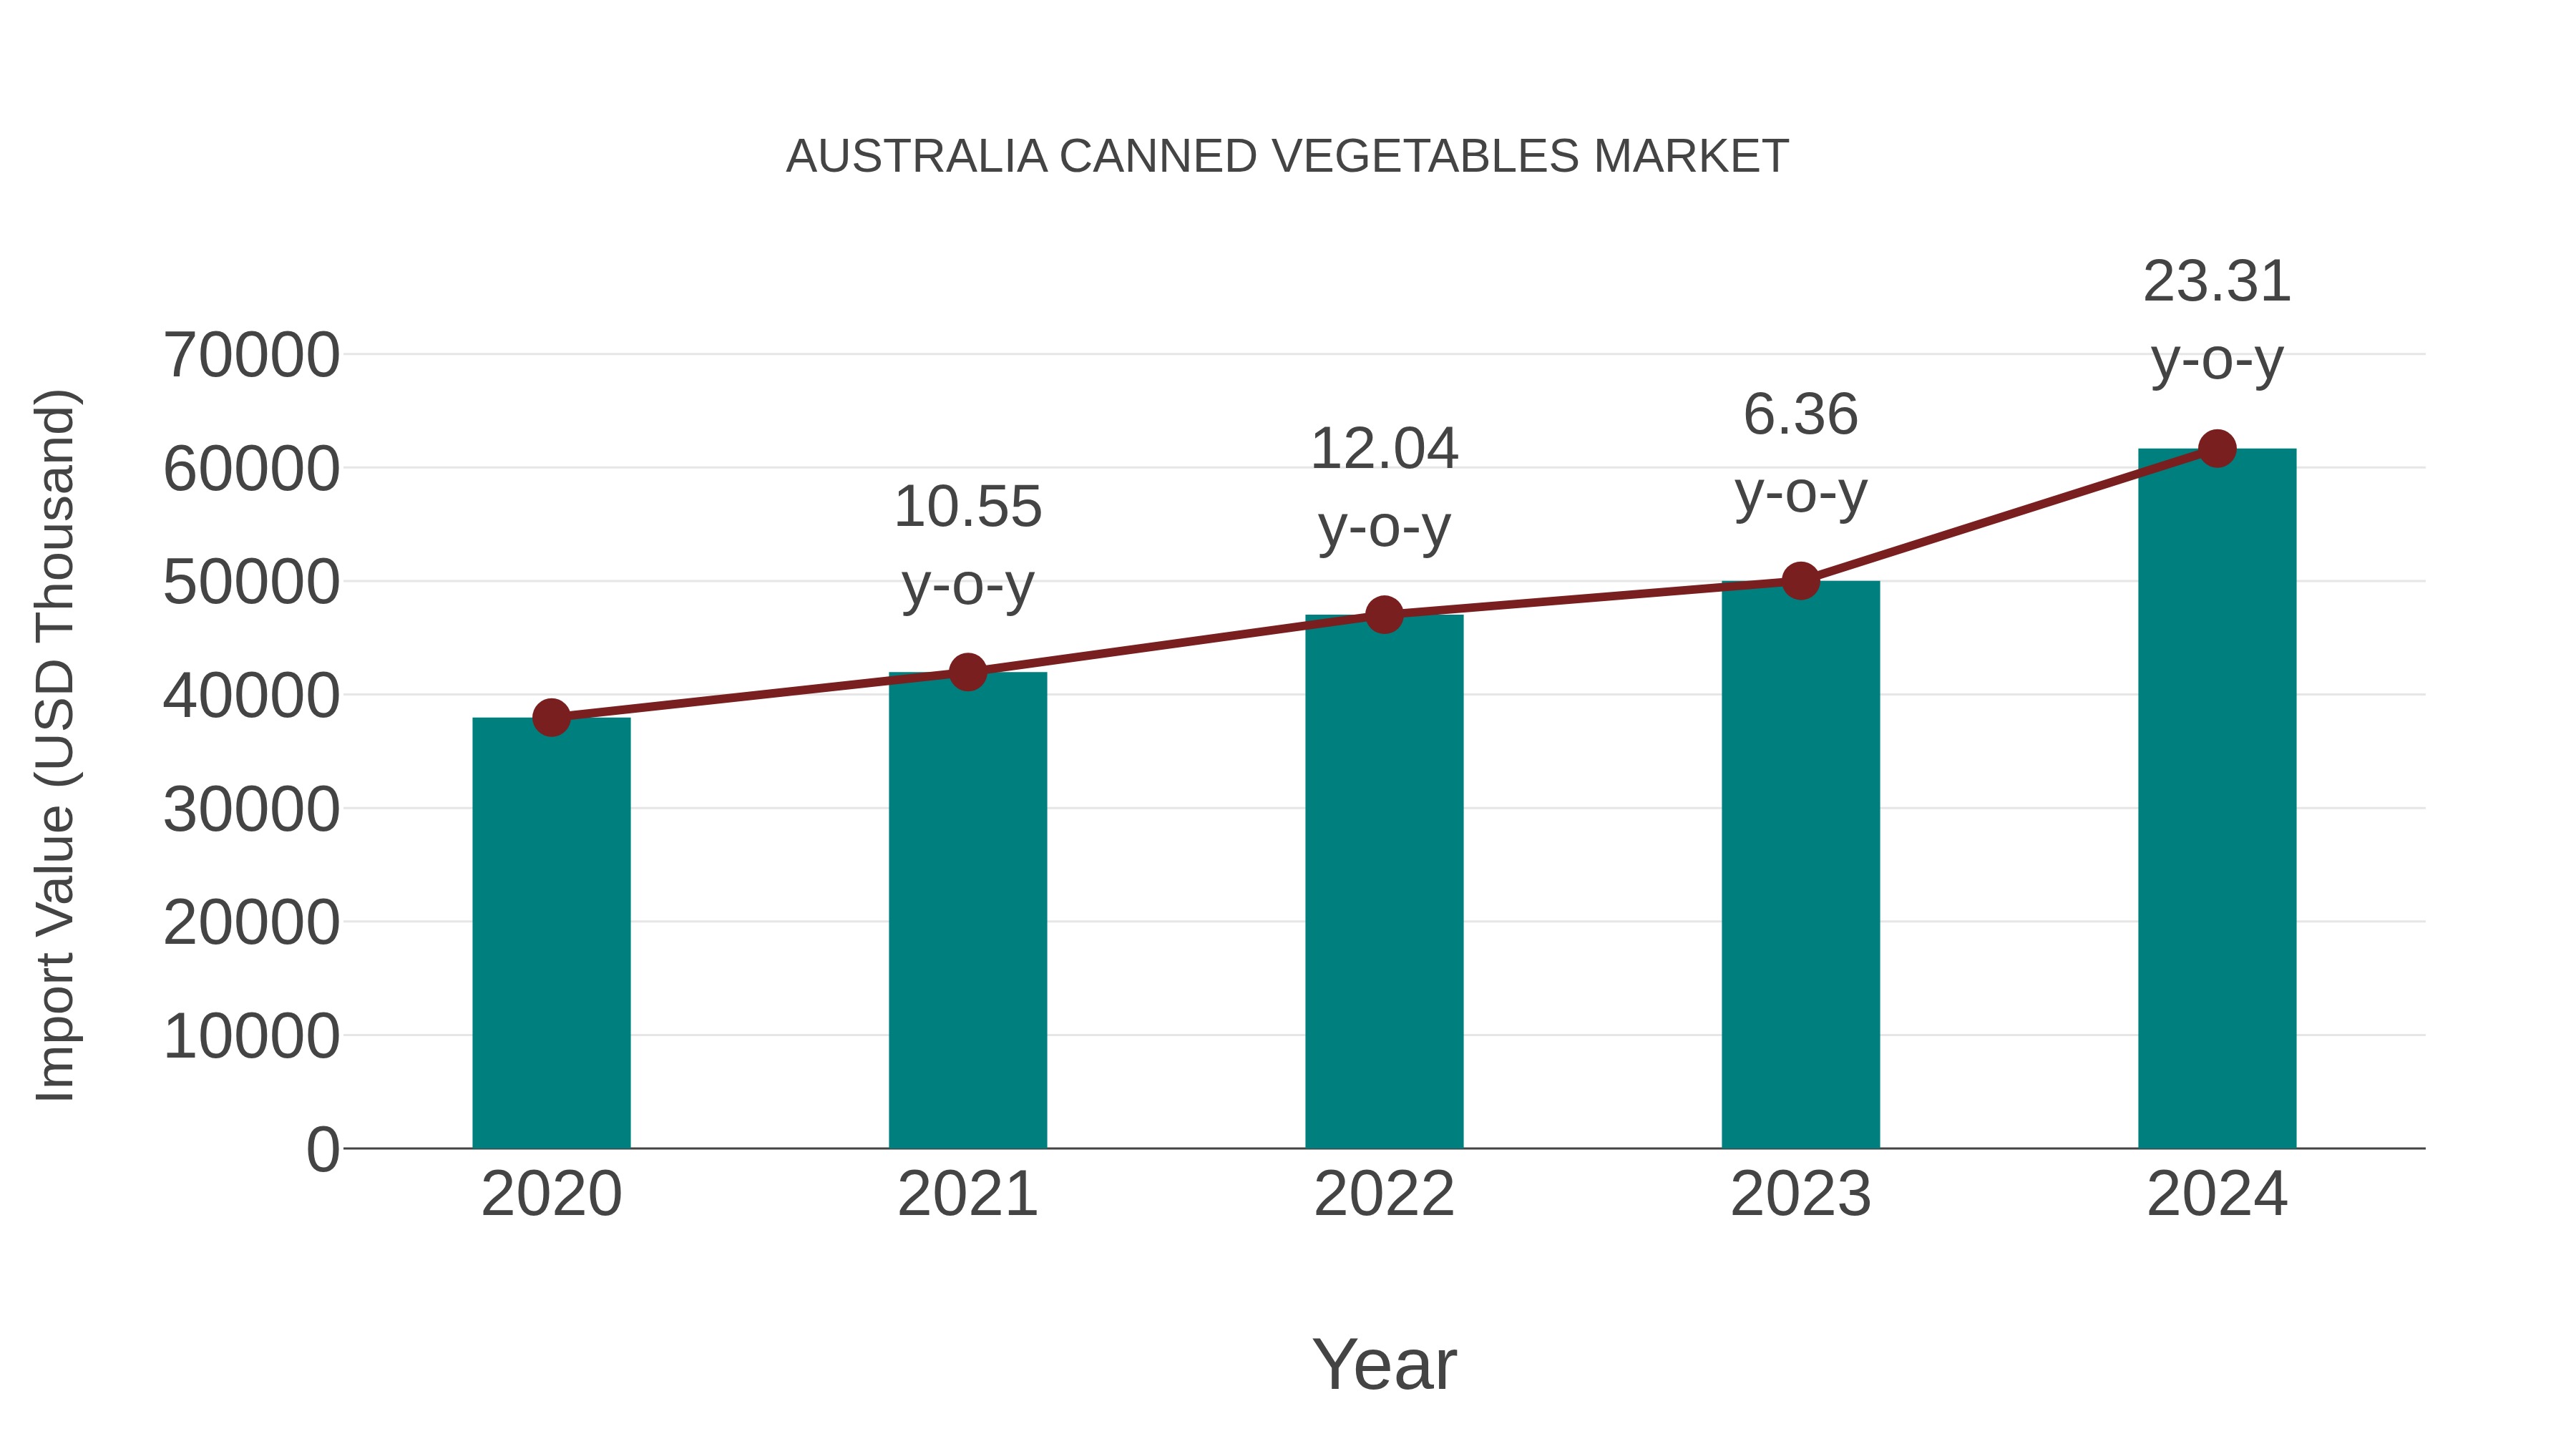
Australia Canned Vegetables Market: Import Trend Analysis
In the Australia canned vegetables market, the import trend showed significant growth from 2023 to 2024, with a growth rate of 23.31%. The compound annual growth rate (CAGR) for imports between 2020 and 2024 stood at 12.9%. This uptick in import momentum can be attributed to shifting consumer preferences towards convenient and healthy food options, driving increased demand for imported canned vegetables in the market.
Australia Canned Vegetables Market Overview
Canned vegetables provide convenient and nutritious options for consumers seeking pantry staples and meal ingredients. In Australia, the canned vegetables market offers a variety of products such as beans, peas, corn, and carrots, catering to diverse culinary preferences and dietary needs.
Drivers of the market
The canned vegetables market in Australia is driven by consumer demand for convenient, shelf-stable, and nutritious meal options. Canned vegetables offer year-round availability, ease of preparation, and versatility in cooking, making them a staple in households and food service establishments. Factors such as changing dietary habits, busy lifestyles, and the demand for plant-based diets influence market dynamics. Moreover, innovations in packaging technology, product formulations, and flavor varieties contribute to the expansion of the canned vegetables market in Australia.
Challenges of the market
In the canned vegetables market, challenges include meeting consumer demand for convenience without compromising on nutritional value and taste. Preserving the texture, flavor, and nutritional content of vegetables during the canning process requires careful handling and processing techniques. Additionally, addressing concerns about additives and preservatives in canned vegetables is important for consumer trust.
Government Policy of the market
In the canned vegetables market, government policies may encompass regulations related to agricultural production standards, food safety requirements, and labeling guidelines. Regulations may also address additives usage, packaging materials, and quality control measures to ensure consumer safety.
Key Highlights of the Report:
- Australia Canned Vegetables Market Outlook
- Market Size of Australia Canned Vegetables Market, 2025
- Forecast of Australia Canned Vegetables Market, 2032
- Historical Data and Forecast of Australia Canned Vegetables Revenues & Volume for the Period 2022-2032F
- Australia Canned Vegetables Market Trend Evolution
- Australia Canned Vegetables Market Drivers and Challenges
- Australia Canned Vegetables Price Trends
- Australia Canned Vegetables Porter's Five Forces
- Australia Canned Vegetables Industry Life Cycle
- Historical Data and Forecast of Australia Canned Vegetables Market Revenues & Volume By Type for the Period 2022-2032F
- Historical Data and Forecast of Australia Canned Vegetables Market Revenues & Volume By Tomatoes for the Period 2022-2032F
- Historical Data and Forecast of Australia Canned Vegetables Market Revenues & Volume By Carrot for the Period 2022-2032F
- Historical Data and Forecast of Australia Canned Vegetables Market Revenues & Volume By Peas for the Period 2022-2032F
- Historical Data and Forecast of Australia Canned Vegetables Market Revenues & Volume By Corn for the Period 2022-2032F
- Historical Data and Forecast of Australia Canned Vegetables Market Revenues & Volume By Spinach for the Period 2022-2032F
- Historical Data and Forecast of Australia Canned Vegetables Market Revenues & Volume By Vegetable Blend for the Period 2022-2032F
- Historical Data and Forecast of Australia Canned Vegetables Market Revenues & Volume By Others for the Period 2022-2032F
- Historical Data and Forecast of Australia Canned Vegetables Market Revenues & Volume By Category for the Period 2022-2032F
- Historical Data and Forecast of Australia Canned Vegetables Market Revenues & Volume By Organic for the Period 2022-2032F
- Historical Data and Forecast of Australia Canned Vegetables Market Revenues & Volume By Conventional for the Period 2022-2032F
- Historical Data and Forecast of Australia Canned Vegetables Market Revenues & Volume By Distribution Channel for the Period 2022-2032F
- Historical Data and Forecast of Australia Canned Vegetables Market Revenues & Volume By Store-Based for the Period 2022-2032F
- Historical Data and Forecast of Australia Canned Vegetables Market Revenues & Volume By Non-Store-Based for the Period 2022-2032F
- Australia Canned Vegetables Import Export Trade Statistics
- Market Opportunity Assessment By Type
- Market Opportunity Assessment By Category
- Market Opportunity Assessment By Distribution Channel
- Australia Canned Vegetables Top Companies Market Share
- Australia Canned Vegetables Competitive Benchmarking By Technical and Operational Parameters
- Australia Canned Vegetables Company Profiles
- Australia Canned Vegetables Key Strategic Recommendations
Australia Canned Vegetables Market (2026-2032): FAQs
6Wresearch actively monitors the Australia Canned Vegetables Market and publishes its comprehensive annual report, highlighting emerging trends, growth drivers, revenue analysis, and forecast outlook. Our insights help businesses to make data-backed strategic decisions with ongoing market dynamics. Our analysts track relevent industries related to the Australia Canned Vegetables Market, allowing our clients with actionable intelligence and reliable forecasts tailored to emerging regional needs.
Yes, we provide customisation as per your requirements. To learn more, feel free to contact us on sales@6wresearch.com
1 Executive Summary |
2 Introduction |
2.1 Key Highlights of the Report |
2.2 Report Description |
2.3 Market Scope & Segmentation |
2.4 Research Methodology |
2.5 Assumptions |
3 Australia Canned Vegetables Market Overview |
3.1 Australia Country Macro Economic Indicators |
3.2 Australia Canned Vegetables Market Revenues & Volume, 2022 & 2032F |
3.3 Australia Canned Vegetables Market - Industry Life Cycle |
3.4 Australia Canned Vegetables Market - Porter's Five Forces |
3.5 Australia Canned Vegetables Market Revenues & Volume Share, By Type, 2022 & 2032F |
3.6 Australia Canned Vegetables Market Revenues & Volume Share, By Category, 2022 & 2032F |
3.7 Australia Canned Vegetables Market Revenues & Volume Share, By Distribution Channel, 2022 & 2032F |
4 Australia Canned Vegetables Market Dynamics |
4.1 Impact Analysis |
4.2 Market Drivers |
4.2.1 Increasing consumer awareness about the nutritional benefits of canned vegetables |
4.2.2 Demand for convenient and ready-to-eat meal solutions |
4.2.3 Growth in urban population leading to higher demand for packaged food products |
4.3 Market Restraints |
4.3.1 Competition from fresh and frozen vegetables |
4.3.2 Concerns over the use of additives and preservatives in canned vegetables |
4.3.3 Price sensitivity among consumers impacting purchasing decisions |
5 Australia Canned Vegetables Market Trends |
6 Australia Canned Vegetables Market, By Types |
6.1 Australia Canned Vegetables Market, By Type |
6.1.1 Overview and Analysis |
6.1.2 Australia Canned Vegetables Market Revenues & Volume, By Type, 2022-2032F |
6.1.3 Australia Canned Vegetables Market Revenues & Volume, By Tomatoes, 2022-2032F |
6.1.4 Australia Canned Vegetables Market Revenues & Volume, By Carrot, 2022-2032F |
6.1.5 Australia Canned Vegetables Market Revenues & Volume, By Peas, 2022-2032F |
6.1.6 Australia Canned Vegetables Market Revenues & Volume, By Corn, 2022-2032F |
6.1.7 Australia Canned Vegetables Market Revenues & Volume, By Spinach, 2022-2032F |
6.1.8 Australia Canned Vegetables Market Revenues & Volume, By Vegetable Blend, 2022-2032F |
6.2 Australia Canned Vegetables Market, By Category |
6.2.1 Overview and Analysis |
6.2.2 Australia Canned Vegetables Market Revenues & Volume, By Organic, 2022-2032F |
6.2.3 Australia Canned Vegetables Market Revenues & Volume, By Conventional, 2022-2032F |
6.3 Australia Canned Vegetables Market, By Distribution Channel |
6.3.1 Overview and Analysis |
6.3.2 Australia Canned Vegetables Market Revenues & Volume, By Store-Based, 2022-2032F |
6.3.3 Australia Canned Vegetables Market Revenues & Volume, By Non-Store-Based, 2022-2032F |
7 Australia Canned Vegetables Market Import-Export Trade Statistics |
7.1 Australia Canned Vegetables Market Export to Major Countries |
7.2 Australia Canned Vegetables Market Imports from Major Countries |
8 Australia Canned Vegetables Market Key Performance Indicators |
8.1 Consumer perception and awareness of the health benefits of canned vegetables |
8.2 Market penetration of canned vegetables in various retail channels |
8.3 Innovation and introduction of new product variants in the canned vegetables segment |
9 Australia Canned Vegetables Market - Opportunity Assessment |
9.1 Australia Canned Vegetables Market Opportunity Assessment, By Type, 2022 & 2032F |
9.2 Australia Canned Vegetables Market Opportunity Assessment, By Category, 2022 & 2032F |
9.3 Australia Canned Vegetables Market Opportunity Assessment, By Distribution Channel, 2022 & 2032F |
10 Australia Canned Vegetables Market - Competitive Landscape |
10.1 Australia Canned Vegetables Market Revenue Share, By Companies, 2025 |
10.2 Australia Canned Vegetables Market Competitive Benchmarking, By Operating and Technical Parameters |
11 Company Profiles |
12 Recommendations |
13 Disclaimer |
Global Go To Market Strategy - 2030
Export potential enables firms to identify high-growth global markets with greater confidence by combining advanced trade intelligence with a structured quantitative methodology. The framework analyzes emerging demand trends and country-level import patterns while integrating macroeconomic and trade datasets such as GDP and population forecasts, bilateral import–export flows, tariff structures, elasticity differentials between developed and developing economies, geographic distance, and import demand projections. Using weighted trade values from 2020–2024 as the base period to project country-to-country export potential for 2030, these inputs are operationalized through calculated drivers such as gravity model parameters, tariff impact factors, and projected GDP per-capita growth. Through an analysis of hidden potentials, demand hotspots, and market conditions that are most favorable to success, this method enables firms to focus on target countries, maximize returns, and global expansion with data, backed by accuracy.
By factoring in the projected importer demand gap that is currently unmet and could be potential opportunity, it identifies the potential for the Exporter (Country) among 190 countries, against the general trade analysis, which identifies the biggest importer or exporter.
To discover high-growth global markets and optimize your business strategy:
Click Here
Pricing
- Single User License$ 1,995
- Department License$ 2,400
- Site License$ 3,120
- Global License$ 3,795

Leadership Perspectives from Industry Events
Search
Thought Leadership and Analyst Meet


Our Clients
6WResearch In News
- India Export Attractiveness Tracker 2026
- India Air Conditioner Market Set for Strong Rebound in 2026 After Weather-Led Correction and GST-Driven Recovery: 6Wresearch
- ADAS in India: How Automatic Emergency Braking, Blind Spot Detection & Driver Monitoring are Transforming Road Safety
- Doha a strategic location for EV manufacturing hub: IPA Qatar
- Demand for luxury TVs surging in the GCC, says Samsung
- Empowering Growth: The Thriving Journey of Bangladesh’s Cable Industry
Latest Reports
- Nicaragua RPG Gaming Market (2026-2032)
- New Zealand RPG Gaming Market (2026-2032)
- Netherlands RPG Gaming Market (2026-2032)
- Nauru RPG Gaming Market (2026-2032)
- Namibia RPG Gaming Market (2026-2032)
- Mozambique RPG Gaming Market (2026-2032)
- Montenegro RPG Gaming Market (2026-2032)
- Mongolia RPG Gaming Market (2026-2032)
- Monaco RPG Gaming Market (2026-2032)
- Micronesia RPG Gaming Market (2026-2032)
Industry Events and Analyst Meet

EV India Expo 2026

HIMTEX 2026

India Refining Summit 2026

India EV Show 2026

EV tech India Expo 2026
Whitepaper
- Middle East & Africa Commercial Security Market Click here to view more.
- Middle East & Africa Fire Safety Systems & Equipment Market Click here to view more.
- GCC Drone Market Click here to view more.
- Middle East Lighting Fixture Market Click here to view more.
- GCC Physical & Perimeter Security Market Click here to view more.