Australia Carbon And Graphite Product Market (2026-2032) Outlook | Growth, Revenue, Analysis, Forecast, Industry, Companies, Value, Size, Share & Trends
Market Forecast By Product (Carbon and Graphite Electrodes, Carbon and Graphite Fibers, Carbon and Graphite Powder, Others), By End-User (Industrial Applications, Aerospace Applications, Others), By Application (Logistics, Chemical, Food and Beverages, Others) And Competitive Landscape
| Product Code: ETC259055 | Publication Date: Aug 2022 | Updated Date: Mar 2026 | Product Type: Market Research Report | |
| Publisher: 6Wresearch | Author: Ravi Bhandari | No. of Pages: 75 | No. of Figures: 35 | No. of Tables: 20 |
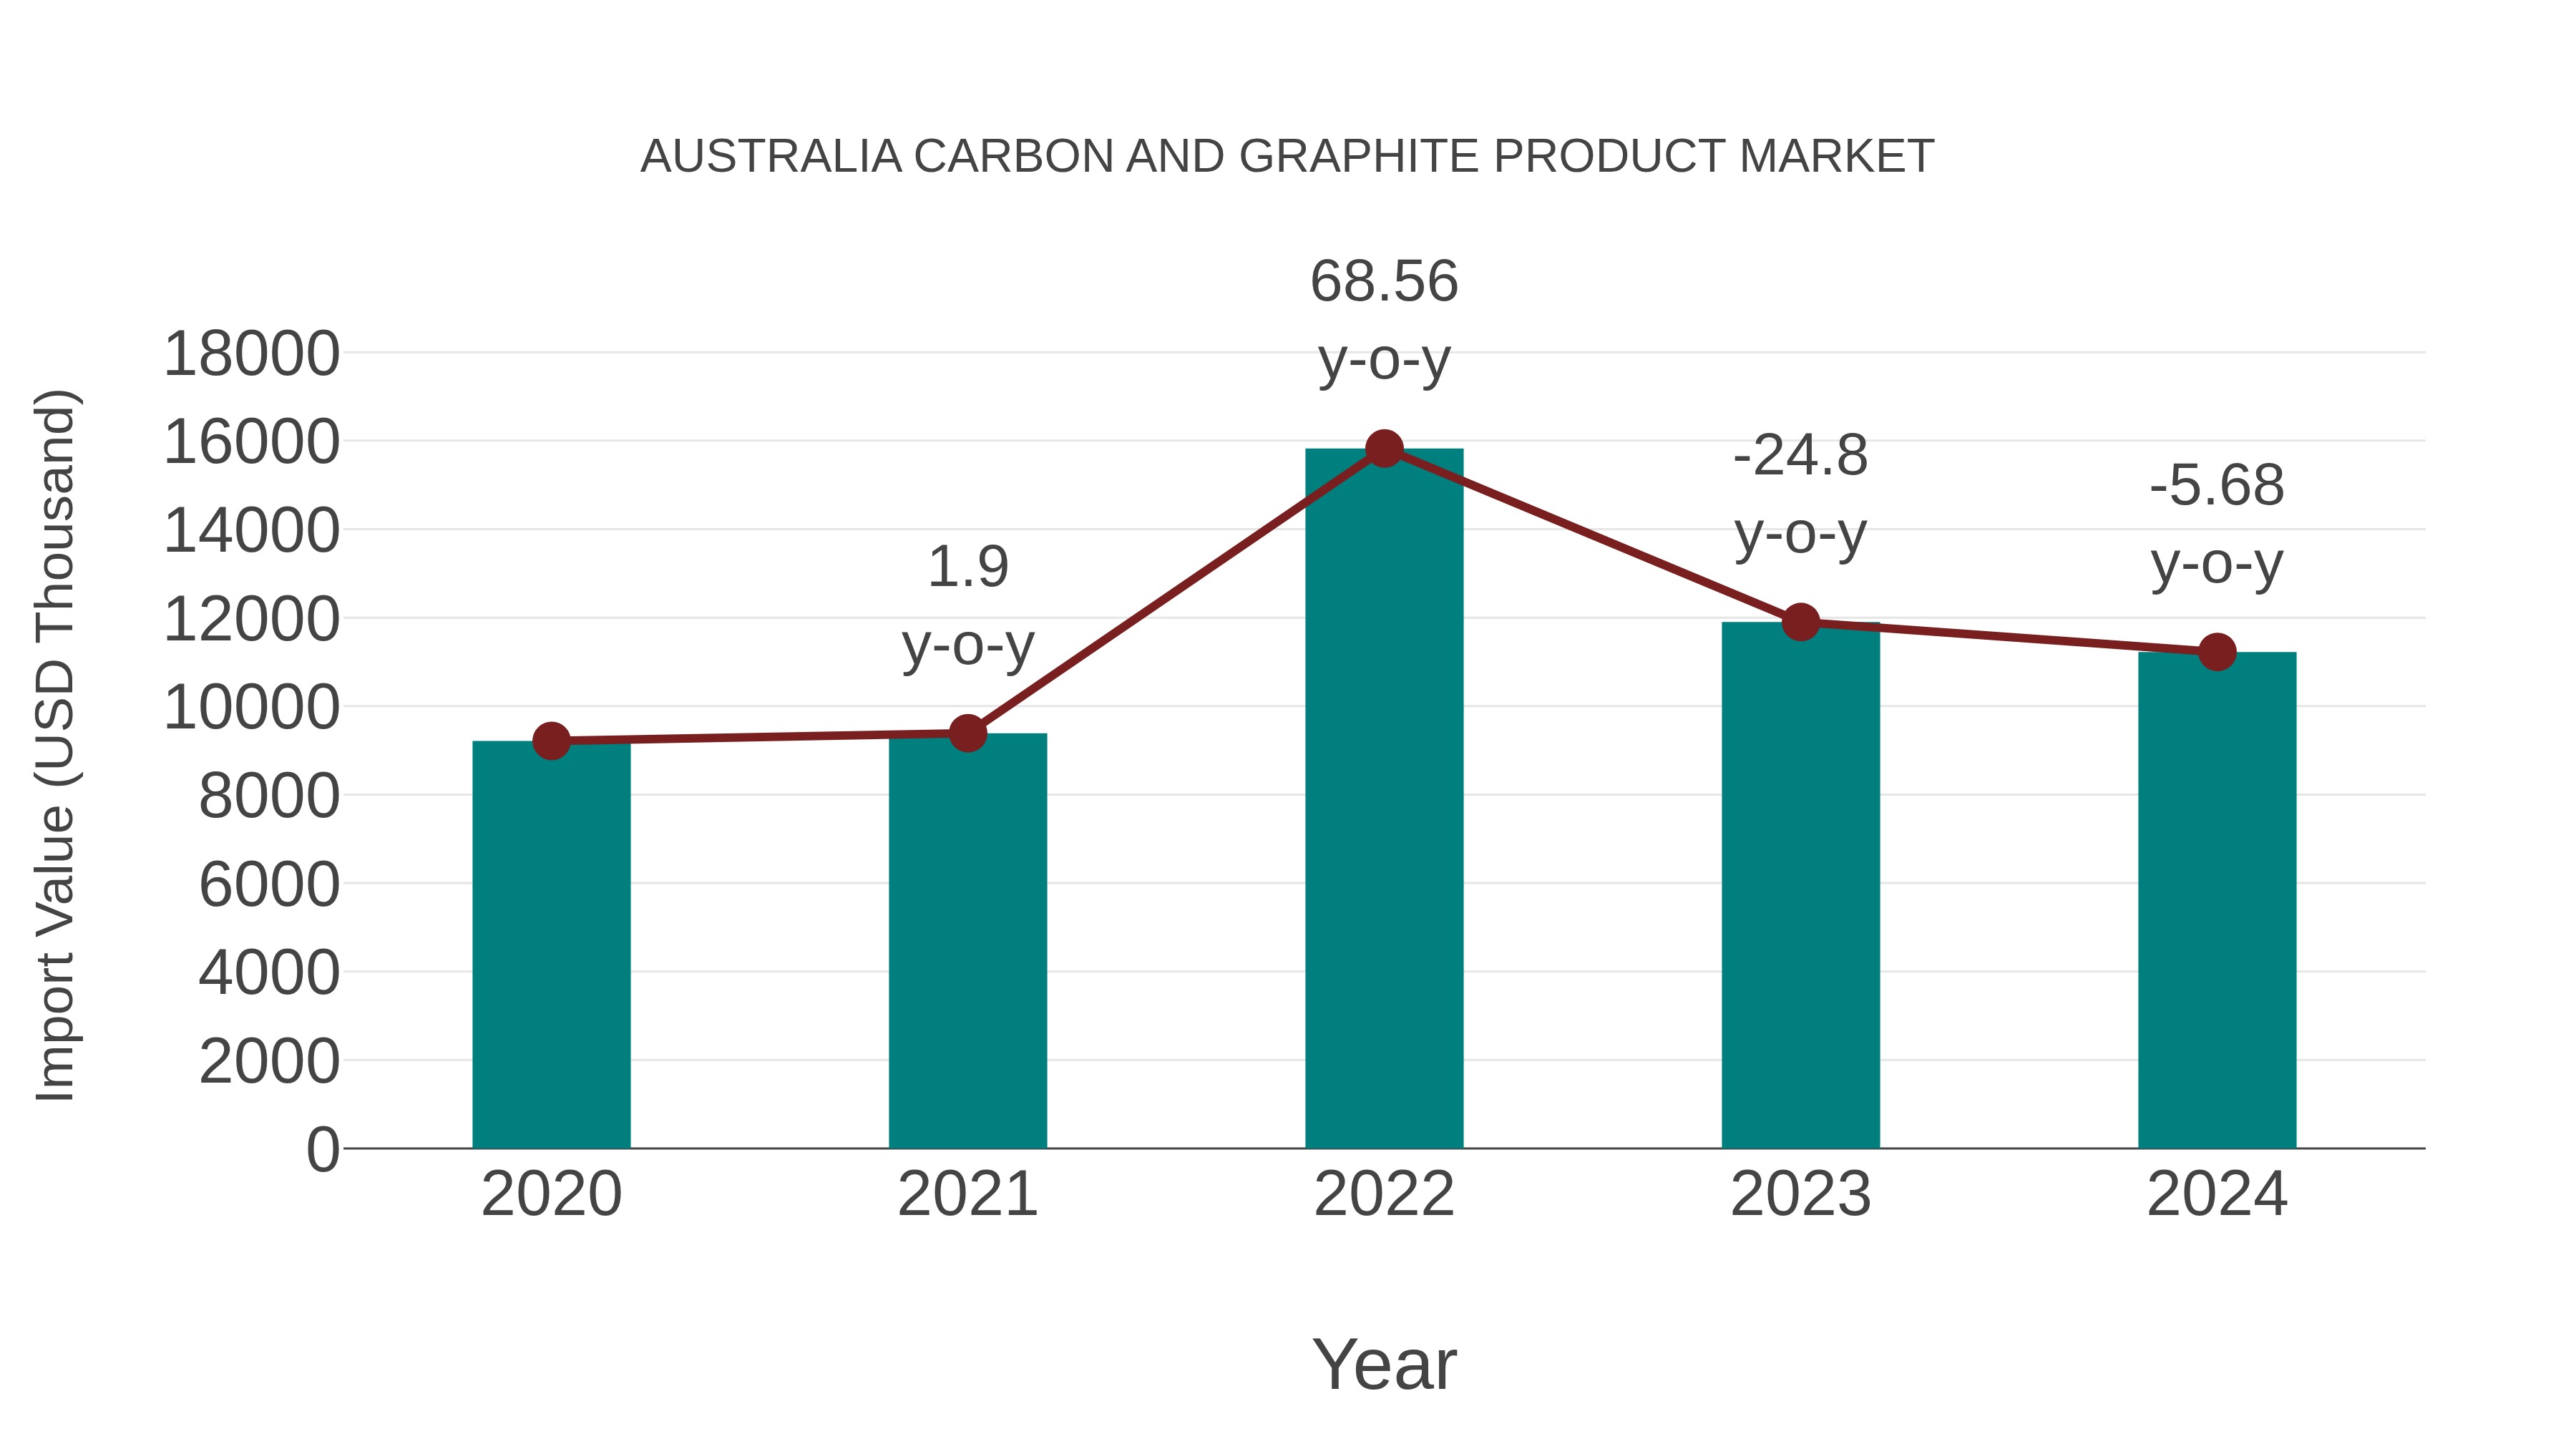
Australia Carbon and Graphite Product Market: Import Trend Analysis
Australia`s import trend for carbon and graphite products experienced a decline from 2023 to 2024, with a growth rate of -5.68%. However, the compound annual growth rate (CAGR) for the period of 2020-2024 stood at 5.06%. This decline in 2024 could be attributed to a temporary demand shift or changes in global trade dynamics impacting market stability.
Australia Carbon and Graphite Product Market Overview
Australia carbon and graphite product market encompasses a wide range of industrial applications, including metallurgy, electronics, energy storage, and aerospace. Carbon and graphite products, such as electrodes, crucibles, heat exchangers, and carbon fibers, are valued for their high thermal conductivity, electrical conductivity, and mechanical strength. Market growth is driven by factors such as increasing demand for lightweight and high-performance materials, advancements in carbon composite technology, and the adoption of sustainable manufacturing practices. Additionally, the market benefits from Australia abundant graphite resources and its growing prominence as a supplier of high-quality carbon and graphite products.
Drivers of the market
Australia carbon and graphite product market is driven by the country`s mining and manufacturing industries, as well as emerging applications in renewable energy and advanced materials. Carbon and graphite products, including electrodes, carbon fibers, and graphite components, are used in various industrial processes and applications. Factors such as demand for lightweight materials, advancements in carbon composite technology, and environmental regulations drive market dynamics. Moreover, innovations in carbon and graphite product design, recycling initiatives, and sustainable manufacturing practices contribute to market growth in Australia.
Challenges of the market
Challenges in the Australia market for carbon and graphite products include sourcing raw materials, ensuring product quality and consistency, and addressing environmental concerns related to carbon emissions and waste disposal in manufacturing processes.
Government Policy of the market
Government policies concerning Australia carbon and graphite product market may include regulations related to manufacturing processes, emissions control, and product quality standards. Regulations may also address sustainability initiatives and support research and development in carbon and graphite technologies.
Key Highlights of the Report:
- Australia Carbon And Graphite Product Market Outlook
- Market Size of Australia Carbon And Graphite Product Market, 2025
- Forecast of Australia Carbon And Graphite Product Market, 2032
- Historical Data and Forecast of Australia Carbon And Graphite Product Revenues & Volume for the Period 2022-2032F
- Australia Carbon And Graphite Product Market Trend Evolution
- Australia Carbon And Graphite Product Market Drivers and Challenges
- Australia Carbon And Graphite Product Price Trends
- Australia Carbon And Graphite Product Porter's Five Forces
- Australia Carbon And Graphite Product Industry Life Cycle
- Historical Data and Forecast of Australia Carbon And Graphite Product Market Revenues & Volume By Product for the Period 2022-2032F
- Historical Data and Forecast of Australia Carbon And Graphite Product Market Revenues & Volume By Carbon and Graphite Electrodes for the Period 2022-2032F
- Historical Data and Forecast of Australia Carbon And Graphite Product Market Revenues & Volume By Carbon and Graphite Fibers for the Period 2022-2032F
- Historical Data and Forecast of Australia Carbon And Graphite Product Market Revenues & Volume By Carbon and Graphite Powder for the Period 2022-2032F
- Historical Data and Forecast of Australia Carbon And Graphite Product Market Revenues & Volume By Others for the Period 2022-2032F
- Historical Data and Forecast of Australia Carbon And Graphite Product Market Revenues & Volume By End-User for the Period 2022-2032F
- Historical Data and Forecast of Australia Carbon And Graphite Product Market Revenues & Volume By Industrial Applications for the Period 2022-2032F
- Historical Data and Forecast of Australia Carbon And Graphite Product Market Revenues & Volume By Aerospace Applications for the Period 2022-2032F
- Historical Data and Forecast of Australia Carbon And Graphite Product Market Revenues & Volume By Others for the Period 2022-2032F
- Historical Data and Forecast of Australia Carbon And Graphite Product Market Revenues & Volume By Application for the Period 2022-2032F
- Historical Data and Forecast of Australia Carbon And Graphite Product Market Revenues & Volume By Logistics for the Period 2022-2032F
- Historical Data and Forecast of Australia Carbon And Graphite Product Market Revenues & Volume By Chemical for the Period 2022-2032F
- Historical Data and Forecast of Australia Carbon And Graphite Product Market Revenues & Volume By Food and Beverages for the Period 2022-2032F
- Historical Data and Forecast of Australia Carbon And Graphite Product Market Revenues & Volume By Others for the Period 2022-2032F
- Australia Carbon And Graphite Product Import Export Trade Statistics
- Market Opportunity Assessment By Product
- Market Opportunity Assessment By End-User
- Market Opportunity Assessment By Application
- Australia Carbon And Graphite Product Top Companies Market Share
- Australia Carbon And Graphite Product Competitive Benchmarking By Technical and Operational Parameters
- Australia Carbon And Graphite Product Company Profiles
- Australia Carbon And Graphite Product Key Strategic Recommendations
Australia Carbon And Graphite Product Market (2026-2032): FAQs
6Wresearch actively monitors the Australia Carbon And Graphite Product Market and publishes its comprehensive annual report, highlighting emerging trends, growth drivers, revenue analysis, and forecast outlook. Our insights help businesses to make data-backed strategic decisions with ongoing market dynamics. Our analysts track relevent industries related to the Australia Carbon And Graphite Product Market, allowing our clients with actionable intelligence and reliable forecasts tailored to emerging regional needs.
Yes, we provide customisation as per your requirements. To learn more, feel free to contact us on sales@6wresearch.com
1 Executive Summary |
2 Introduction |
2.1 Key Highlights of the Report |
2.2 Report Description |
2.3 Market Scope & Segmentation |
2.4 Research Methodology |
2.5 Assumptions |
3 Australia Carbon And Graphite Product Market Overview |
3.1 Australia Country Macro Economic Indicators |
3.2 Australia Carbon And Graphite Product Market Revenues & Volume, 2022 & 2032F |
3.3 Australia Carbon And Graphite Product Market - Industry Life Cycle |
3.4 Australia Carbon And Graphite Product Market - Porter's Five Forces |
3.5 Australia Carbon And Graphite Product Market Revenues & Volume Share, By Product, 2022 & 2032F |
3.6 Australia Carbon And Graphite Product Market Revenues & Volume Share, By End-User, 2022 & 2032F |
3.7 Australia Carbon And Graphite Product Market Revenues & Volume Share, By Application, 2022 & 2032F |
4 Australia Carbon And Graphite Product Market Dynamics |
4.1 Impact Analysis |
4.2 Market Drivers |
4.2.1 Increasing demand for carbon and graphite products in industries such as aerospace, automotive, and electronics. |
4.2.2 Growing focus on sustainable and eco-friendly materials, driving the adoption of carbon and graphite products. |
4.2.3 Technological advancements leading to the development of new applications for carbon and graphite products. |
4.3 Market Restraints |
4.3.1 Fluctuating prices of raw materials such as petroleum coke and coal tar pitch impacting the production costs of carbon and graphite products. |
4.3.2 Intense competition from substitutes like fiberglass, steel, and aluminum in certain applications. |
4.3.3 Environmental regulations and concerns regarding the production processes of carbon and graphite products. |
5 Australia Carbon And Graphite Product Market Trends |
6 Australia Carbon And Graphite Product Market, By Types |
6.1 Australia Carbon And Graphite Product Market, By Product |
6.1.1 Overview and Analysis |
6.1.2 Australia Carbon And Graphite Product Market Revenues & Volume, By Product, 2022-2032F |
6.1.3 Australia Carbon And Graphite Product Market Revenues & Volume, By Carbon and Graphite Electrodes, 2022-2032F |
6.1.4 Australia Carbon And Graphite Product Market Revenues & Volume, By Carbon and Graphite Fibers, 2022-2032F |
6.1.5 Australia Carbon And Graphite Product Market Revenues & Volume, By Carbon and Graphite Powder, 2022-2032F |
6.1.6 Australia Carbon And Graphite Product Market Revenues & Volume, By Others, 2022-2032F |
6.2 Australia Carbon And Graphite Product Market, By End-User |
6.2.1 Overview and Analysis |
6.2.2 Australia Carbon And Graphite Product Market Revenues & Volume, By Industrial Applications, 2022-2032F |
6.2.3 Australia Carbon And Graphite Product Market Revenues & Volume, By Aerospace Applications, 2022-2032F |
6.2.4 Australia Carbon And Graphite Product Market Revenues & Volume, By Others, 2022-2032F |
6.3 Australia Carbon And Graphite Product Market, By Application |
6.3.1 Overview and Analysis |
6.3.2 Australia Carbon And Graphite Product Market Revenues & Volume, By Logistics, 2022-2032F |
6.3.3 Australia Carbon And Graphite Product Market Revenues & Volume, By Chemical, 2022-2032F |
6.3.4 Australia Carbon And Graphite Product Market Revenues & Volume, By Food and Beverages, 2022-2032F |
6.3.5 Australia Carbon And Graphite Product Market Revenues & Volume, By Others, 2022-2032F |
7 Australia Carbon And Graphite Product Market Import-Export Trade Statistics |
7.1 Australia Carbon And Graphite Product Market Export to Major Countries |
7.2 Australia Carbon And Graphite Product Market Imports from Major Countries |
8 Australia Carbon And Graphite Product Market Key Performance Indicators |
8.1 Research and development investment in carbon and graphite product innovations. |
8.2 Adoption rate of carbon and graphite products in emerging industries. |
8.3 Sustainability initiatives and certifications obtained by companies in the carbon and graphite product market. |
9 Australia Carbon And Graphite Product Market - Opportunity Assessment |
9.1 Australia Carbon And Graphite Product Market Opportunity Assessment, By Product, 2022 & 2032F |
9.2 Australia Carbon And Graphite Product Market Opportunity Assessment, By End-User, 2022 & 2032F |
9.3 Australia Carbon And Graphite Product Market Opportunity Assessment, By Application, 2022 & 2032F |
10 Australia Carbon And Graphite Product Market - Competitive Landscape |
10.1 Australia Carbon And Graphite Product Market Revenue Share, By Companies, 2025 |
10.2 Australia Carbon And Graphite Product Market Competitive Benchmarking, By Operating and Technical Parameters |
11 Company Profiles |
12 Recommendations |
13 Disclaimer |
Global Go To Market Strategy - 2030
Export potential enables firms to identify high-growth global markets with greater confidence by combining advanced trade intelligence with a structured quantitative methodology. The framework analyzes emerging demand trends and country-level import patterns while integrating macroeconomic and trade datasets such as GDP and population forecasts, bilateral import–export flows, tariff structures, elasticity differentials between developed and developing economies, geographic distance, and import demand projections. Using weighted trade values from 2020–2024 as the base period to project country-to-country export potential for 2030, these inputs are operationalized through calculated drivers such as gravity model parameters, tariff impact factors, and projected GDP per-capita growth. Through an analysis of hidden potentials, demand hotspots, and market conditions that are most favorable to success, this method enables firms to focus on target countries, maximize returns, and global expansion with data, backed by accuracy.
By factoring in the projected importer demand gap that is currently unmet and could be potential opportunity, it identifies the potential for the Exporter (Country) among 190 countries, against the general trade analysis, which identifies the biggest importer or exporter.
To discover high-growth global markets and optimize your business strategy:
Click Here
Pricing
- Single User License$ 1,995
- Department License$ 2,400
- Site License$ 3,120
- Global License$ 3,795

Leadership Perspectives from Industry Events
Search
Thought Leadership and Analyst Meet


Our Clients
6WResearch In News
- India Air Conditioner Market Set for Strong Rebound in 2026 After Weather-Led Correction and GST-Driven Recovery: 6Wresearch
- ADAS in India: How Automatic Emergency Braking, Blind Spot Detection & Driver Monitoring are Transforming Road Safety
- Doha a strategic location for EV manufacturing hub: IPA Qatar
- Demand for luxury TVs surging in the GCC, says Samsung
- Empowering Growth: The Thriving Journey of Bangladesh’s Cable Industry
- Demand for luxury TVs surging in the GCC, says Samsung
Latest Reports
- Nicaragua RPG Gaming Market (2026-2032)
- New Zealand RPG Gaming Market (2026-2032)
- Netherlands RPG Gaming Market (2026-2032)
- Nauru RPG Gaming Market (2026-2032)
- Namibia RPG Gaming Market (2026-2032)
- Mozambique RPG Gaming Market (2026-2032)
- Montenegro RPG Gaming Market (2026-2032)
- Mongolia RPG Gaming Market (2026-2032)
- Monaco RPG Gaming Market (2026-2032)
- Micronesia RPG Gaming Market (2026-2032)
Industry Events and Analyst Meet

HIMTEX 2026

India Refining Summit 2026

India EV Show 2026

EV tech India Expo 2026

Auto Tech Asia 2026
Whitepaper
- Middle East & Africa Commercial Security Market Click here to view more.
- Middle East & Africa Fire Safety Systems & Equipment Market Click here to view more.
- GCC Drone Market Click here to view more.
- Middle East Lighting Fixture Market Click here to view more.
- GCC Physical & Perimeter Security Market Click here to view more.