Australia Chloromethanes Market (2026-2032) Outlook | Value, Industry, Analysis, Forecast, Revenue, Companies, Size, Share, Trends & Growth
Market Forecast By Type (Methyl Chloride, Methylene Chloride, Chloroform, Carbon Tetrachloride) And Competitive Landscape
| Product Code: ETC4484916 | Publication Date: Jul 2023 | Updated Date: Mar 2026 | Product Type: Report | |
| Publisher: 6Wresearch | Author: Dhaval Chaurasia | No. of Pages: 85 | No. of Figures: 45 | No. of Tables: 25 |
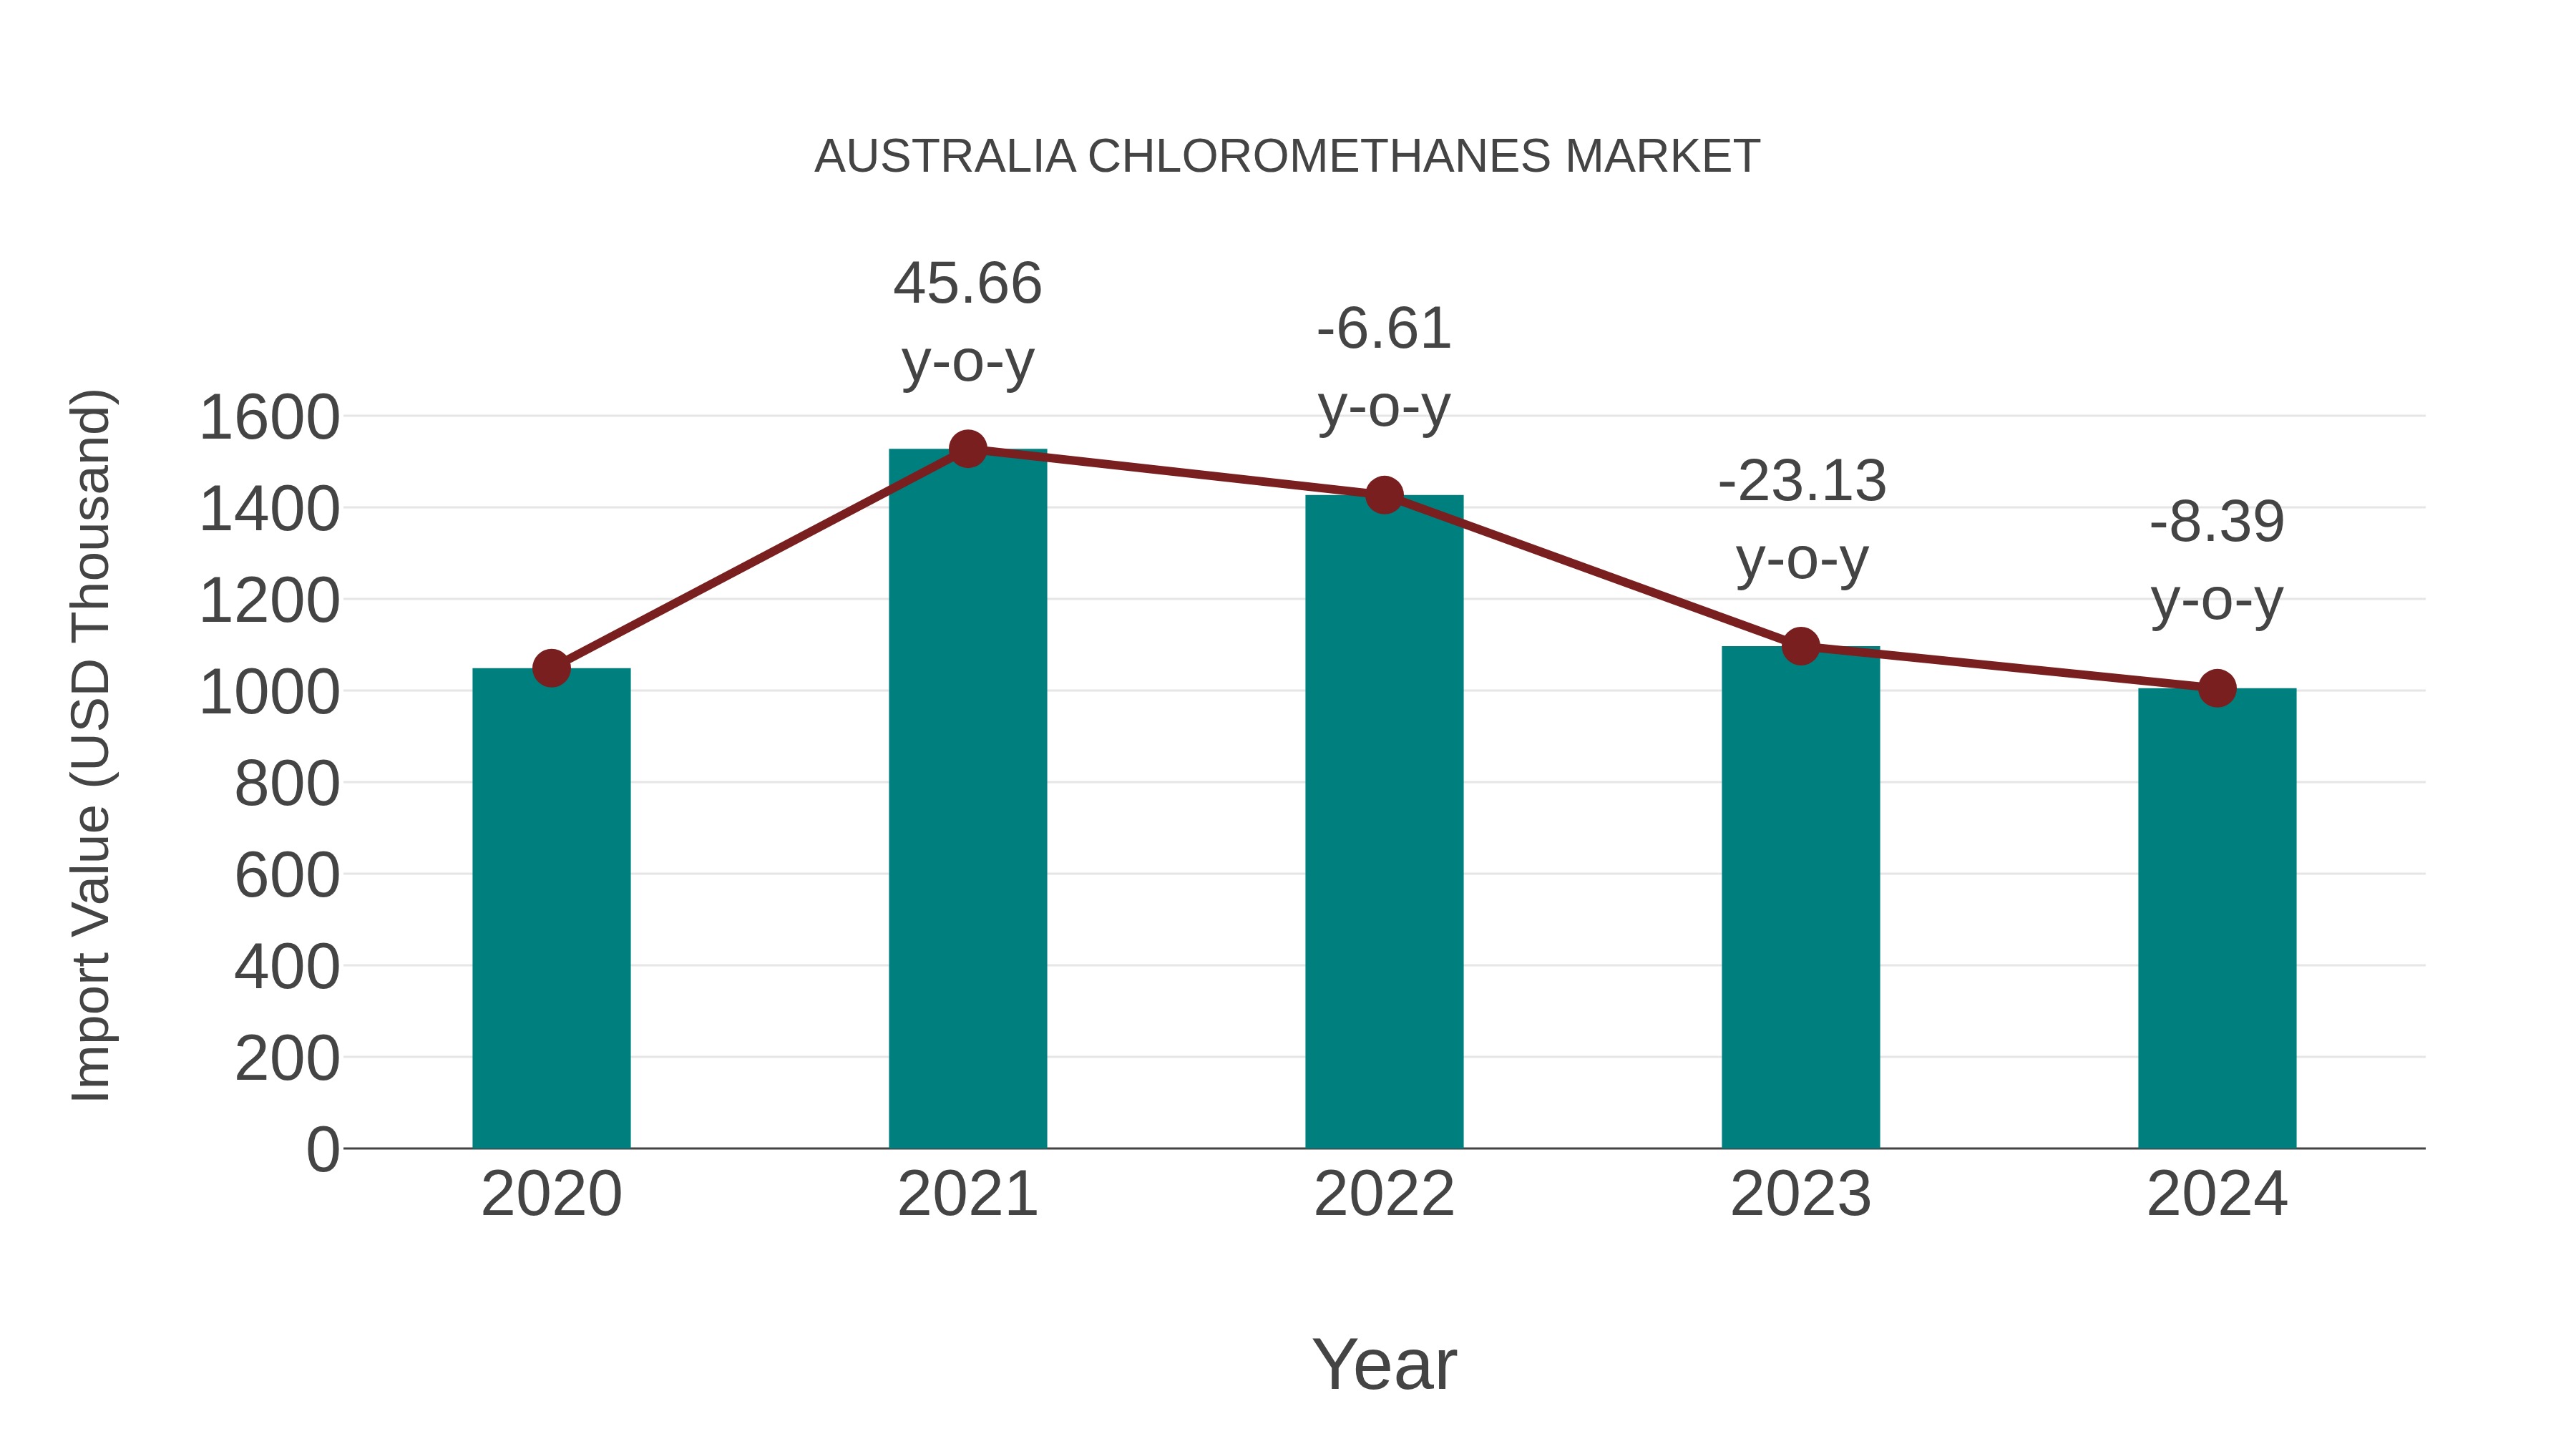
Australia Chloromethanes Market: Import Trend Analysis
Australia`s import trend for chloromethanes in 2024 experienced a decline, with a growth rate of -8.39% compared to the previous year. The compound annual growth rate (CAGR) for the period 2020-2024 stood at -1.07%. This negative momentum could be attributed to shifts in demand dynamics or evolving trade policies impacting market stability.
Australia Chloromethanes Market Overview
The chloromethanes market in Australia encompasses various chlorinated derivatives of methane, including chloromethane, dichloromethane, chloroform, and carbon tetrachloride. Chloromethanes have industrial applications in solvent extraction, chemical synthesis, refrigeration, and aerosol propellants, but their usage is regulated due to environmental and health concerns, including ozone depletion and toxicity. In Australia, chloromethanes are subject to regulatory controls to minimize emissions and promote safer alternatives in industrial processes and consumer products.
Drivers of the market
The Australia chloromethanes market experiences demand driven by factors affecting the chemical industry and various downstream applications. Chloromethanes refer to a group of compounds including methyl chloride, methylene chloride, chloroform, and carbon tetrachloride, each with distinct uses. Market dynamics are influenced by factors such as demand from sectors including pharmaceuticals, agrochemicals, and industrial solvents. Additionally, regulatory standards governing chemical usage, technological advancements in production processes, and environmental concerns impact market trends.
Challenges of the market
Challenges in the Australia chloromethanes market involve balancing demand for chloromethane derivatives in diverse industries such as pharmaceuticals, agrochemicals, and silicone production, addressing regulatory restrictions on hazardous chemicals, and ensuring safe handling and transportation throughout the supply chain.
Government Policy of the market
Government regulations in Australia govern the production, importation, and use of chloropicrin, a chemical compound used primarily as a soil fumigant in agriculture. Regulatory requirements address safety, environmental protection, and occupational health standards to minimize risks associated with chloropicrin exposure and handling. Compliance measures may include permits, licensing requirements, and monitoring of application methods and concentrations to prevent adverse effects on human health and the environment. Regulatory agencies such as the Australia Pesticides and Veterinary Medicines Authority (APVMA) oversee compliance with regulations to ensure responsible use of chloropicrin in agricultural practices.
Key Highlights of the Report:
- Australia Chloromethanes Market Outlook
- Market Size of Australia Chloromethanes Market, 2025
- Forecast of Australia Chloromethanes Market, 2032
- Historical Data and Forecast of Australia Chloromethanes Revenues & Volume for the Period 2022-2032F
- Australia Chloromethanes Market Trend Evolution
- Australia Chloromethanes Market Drivers and Challenges
- Australia Chloromethanes Price Trends
- Australia Chloromethanes Porter's Five Forces
- Australia Chloromethanes Industry Life Cycle
- Historical Data and Forecast of Australia Chloromethanes Market Revenues & Volume By Type for the Period 2022-2032F
- Historical Data and Forecast of Australia Chloromethanes Market Revenues & Volume By Methyl Chloride for the Period 2022-2032F
- Historical Data and Forecast of Australia Chloromethanes Market Revenues & Volume By Methylene Chloride for the Period 2022-2032F
- Historical Data and Forecast of Australia Chloromethanes Market Revenues & Volume By Chloroform for the Period 2022-2032F
- Historical Data and Forecast of Australia Chloromethanes Market Revenues & Volume By Carbon Tetrachloride for the Period 2022-2032F
- Australia Chloromethanes Import Export Trade Statistics
- Market Opportunity Assessment By Type
- Australia Chloromethanes Top Companies Market Share
- Australia Chloromethanes Competitive Benchmarking By Technical and Operational Parameters
- Australia Chloromethanes Company Profiles
- Australia Chloromethanes Key Strategic Recommendations
Australia Chloromethanes Market (2026-2032): FAQs
6Wresearch actively monitors the Australia Chloromethanes Market and publishes its comprehensive annual report, highlighting emerging trends, growth drivers, revenue analysis, and forecast outlook. Our insights help businesses to make data-backed strategic decisions with ongoing market dynamics. Our analysts track relevent industries related to the Australia Chloromethanes Market, allowing our clients with actionable intelligence and reliable forecasts tailored to emerging regional needs.
Yes, we provide customisation as per your requirements. To learn more, feel free to contact us on sales@6wresearch.com
1 Executive Summary |
2 Introduction |
2.1 Key Highlights of the Report |
2.2 Report Description |
2.3 Market Scope & Segmentation |
2.4 Research Methodology |
2.5 Assumptions |
3 Australia Chloromethanes Market Overview |
3.1 Australia Country Macro Economic Indicators |
3.2 Australia Chloromethanes Market Revenues & Volume, 2022 & 2032F |
3.3 Australia Chloromethanes Market - Industry Life Cycle |
3.4 Australia Chloromethanes Market - Porter's Five Forces |
3.5 Australia Chloromethanes Market Revenues & Volume Share, By Type, 2022 & 2032F |
4 Australia Chloromethanes Market Dynamics |
4.1 Impact Analysis |
4.2 Market Drivers |
4.2.1 Increasing demand for chloromethanes in the pharmaceutical industry for manufacturing pharmaceuticals and agrochemicals. |
4.2.2 Growing application of chloromethanes in the manufacturing of silicone polymers and elastomers. |
4.2.3 Rising demand for refrigerants and solvents in various industries driving the chloromethanes market. |
4.3 Market Restraints |
4.3.1 Stringent regulations on the use of chloromethanes due to environmental concerns. |
4.3.2 Fluctuating raw material prices impacting the production cost of chloromethanes. |
4.3.3 Competition from alternative products and technologies affecting the market growth. |
5 Australia Chloromethanes Market Trends |
6 Australia Chloromethanes Market, By Types |
6.1 Australia Chloromethanes Market, By Type |
6.1.1 Overview and Analysis |
6.1.2 Australia Chloromethanes Market Revenues & Volume, By Type, 2022-2032F |
6.1.3 Australia Chloromethanes Market Revenues & Volume, By Methyl Chloride, 2022-2032F |
6.1.4 Australia Chloromethanes Market Revenues & Volume, By Methylene Chloride, 2022-2032F |
6.1.5 Australia Chloromethanes Market Revenues & Volume, By Chloroform, 2022-2032F |
6.1.6 Australia Chloromethanes Market Revenues & Volume, By Carbon Tetrachloride, 2022-2032F |
7 Australia Chloromethanes Market Import-Export Trade Statistics |
7.1 Australia Chloromethanes Market Export to Major Countries |
7.2 Australia Chloromethanes Market Imports from Major Countries |
8 Australia Chloromethanes Market Key Performance Indicators |
8.1 Number of new applications for chloromethanes in different industries. |
8.2 Investment in research and development for new chloromethanes products. |
8.3 Adoption rate of chloromethanes in emerging industries such as electronics and automotive sectors. |
9 Australia Chloromethanes Market - Opportunity Assessment |
9.1 Australia Chloromethanes Market Opportunity Assessment, By Type, 2022 & 2032F |
10 Australia Chloromethanes Market - Competitive Landscape |
10.1 Australia Chloromethanes Market Revenue Share, By Companies, 2025 |
10.2 Australia Chloromethanes Market Competitive Benchmarking, By Operating and Technical Parameters |
11 Company Profiles |
12 Recommendations |
13 Disclaimer |
Global Go To Market Strategy - 2030
Export potential enables firms to identify high-growth global markets with greater confidence by combining advanced trade intelligence with a structured quantitative methodology. The framework analyzes emerging demand trends and country-level import patterns while integrating macroeconomic and trade datasets such as GDP and population forecasts, bilateral import–export flows, tariff structures, elasticity differentials between developed and developing economies, geographic distance, and import demand projections. Using weighted trade values from 2020–2024 as the base period to project country-to-country export potential for 2030, these inputs are operationalized through calculated drivers such as gravity model parameters, tariff impact factors, and projected GDP per-capita growth. Through an analysis of hidden potentials, demand hotspots, and market conditions that are most favorable to success, this method enables firms to focus on target countries, maximize returns, and global expansion with data, backed by accuracy.
By factoring in the projected importer demand gap that is currently unmet and could be potential opportunity, it identifies the potential for the Exporter (Country) among 190 countries, against the general trade analysis, which identifies the biggest importer or exporter.
To discover high-growth global markets and optimize your business strategy:
Click Here
Pricing
- Single User License$ 1,995
- Department License$ 2,400
- Site License$ 3,120
- Global License$ 3,795

Leadership Perspectives from Industry Events
Search
Thought Leadership and Analyst Meet


Our Clients
6WResearch In News
- India Export Attractiveness Tracker 2026
- India Air Conditioner Market Set for Strong Rebound in 2026 After Weather-Led Correction and GST-Driven Recovery: 6Wresearch
- ADAS in India: How Automatic Emergency Braking, Blind Spot Detection & Driver Monitoring are Transforming Road Safety
- Doha a strategic location for EV manufacturing hub: IPA Qatar
- Demand for luxury TVs surging in the GCC, says Samsung
- Empowering Growth: The Thriving Journey of Bangladesh’s Cable Industry
Latest Reports
- Nicaragua RPG Gaming Market (2026-2032)
- New Zealand RPG Gaming Market (2026-2032)
- Netherlands RPG Gaming Market (2026-2032)
- Nauru RPG Gaming Market (2026-2032)
- Namibia RPG Gaming Market (2026-2032)
- Mozambique RPG Gaming Market (2026-2032)
- Montenegro RPG Gaming Market (2026-2032)
- Mongolia RPG Gaming Market (2026-2032)
- Monaco RPG Gaming Market (2026-2032)
- Micronesia RPG Gaming Market (2026-2032)
Industry Events and Analyst Meet

EV India Expo 2026

HIMTEX 2026

India Refining Summit 2026

India EV Show 2026

EV tech India Expo 2026
Whitepaper
- Middle East & Africa Commercial Security Market Click here to view more.
- Middle East & Africa Fire Safety Systems & Equipment Market Click here to view more.
- GCC Drone Market Click here to view more.
- Middle East Lighting Fixture Market Click here to view more.
- GCC Physical & Perimeter Security Market Click here to view more.