Australia Contactor Market (2026-2032) | Outlook, Share, Companies, Industry, COVID-19 IMPACT, Forecast, Trends, Value, Growth, Analysis, Revenue & Size
Market Forecast By Type (Solid-State Contactor, Magnetic Contactor, Vacuum Contactor, Lighting Contactor), By Product (DC Contactor, AC Contactor), By Poles (2-Pole, 3-Pole, 4-Pole, Others), By Voltage (Low Voltage (Up To 1 KV), Medium Voltage (1 KV – 7.2 KV), High Voltage (Above 7.2 KV)), By End-users (Automotive, Power, Oil & Gas, Food & Beverage, Construction, Data Centers, FA Robots , Others) And Competitive Landscape
| Product Code: ETC014035 | Publication Date: Jun 2023 | Updated Date: Jun 2026 | Product Type: Report | |
| Publisher: 6Wresearch | Author: Ravi Bhandari | No. of Pages: 70 | No. of Figures: 35 | No. of Tables: 5 |
Australia Contactor Market Summary
The australia contactor market was estimated at USD 189 Million in 2025 and is projected to reach USD 224 Million by 2032, growing at a CAGR of 2.6% from 2026 to 2032.
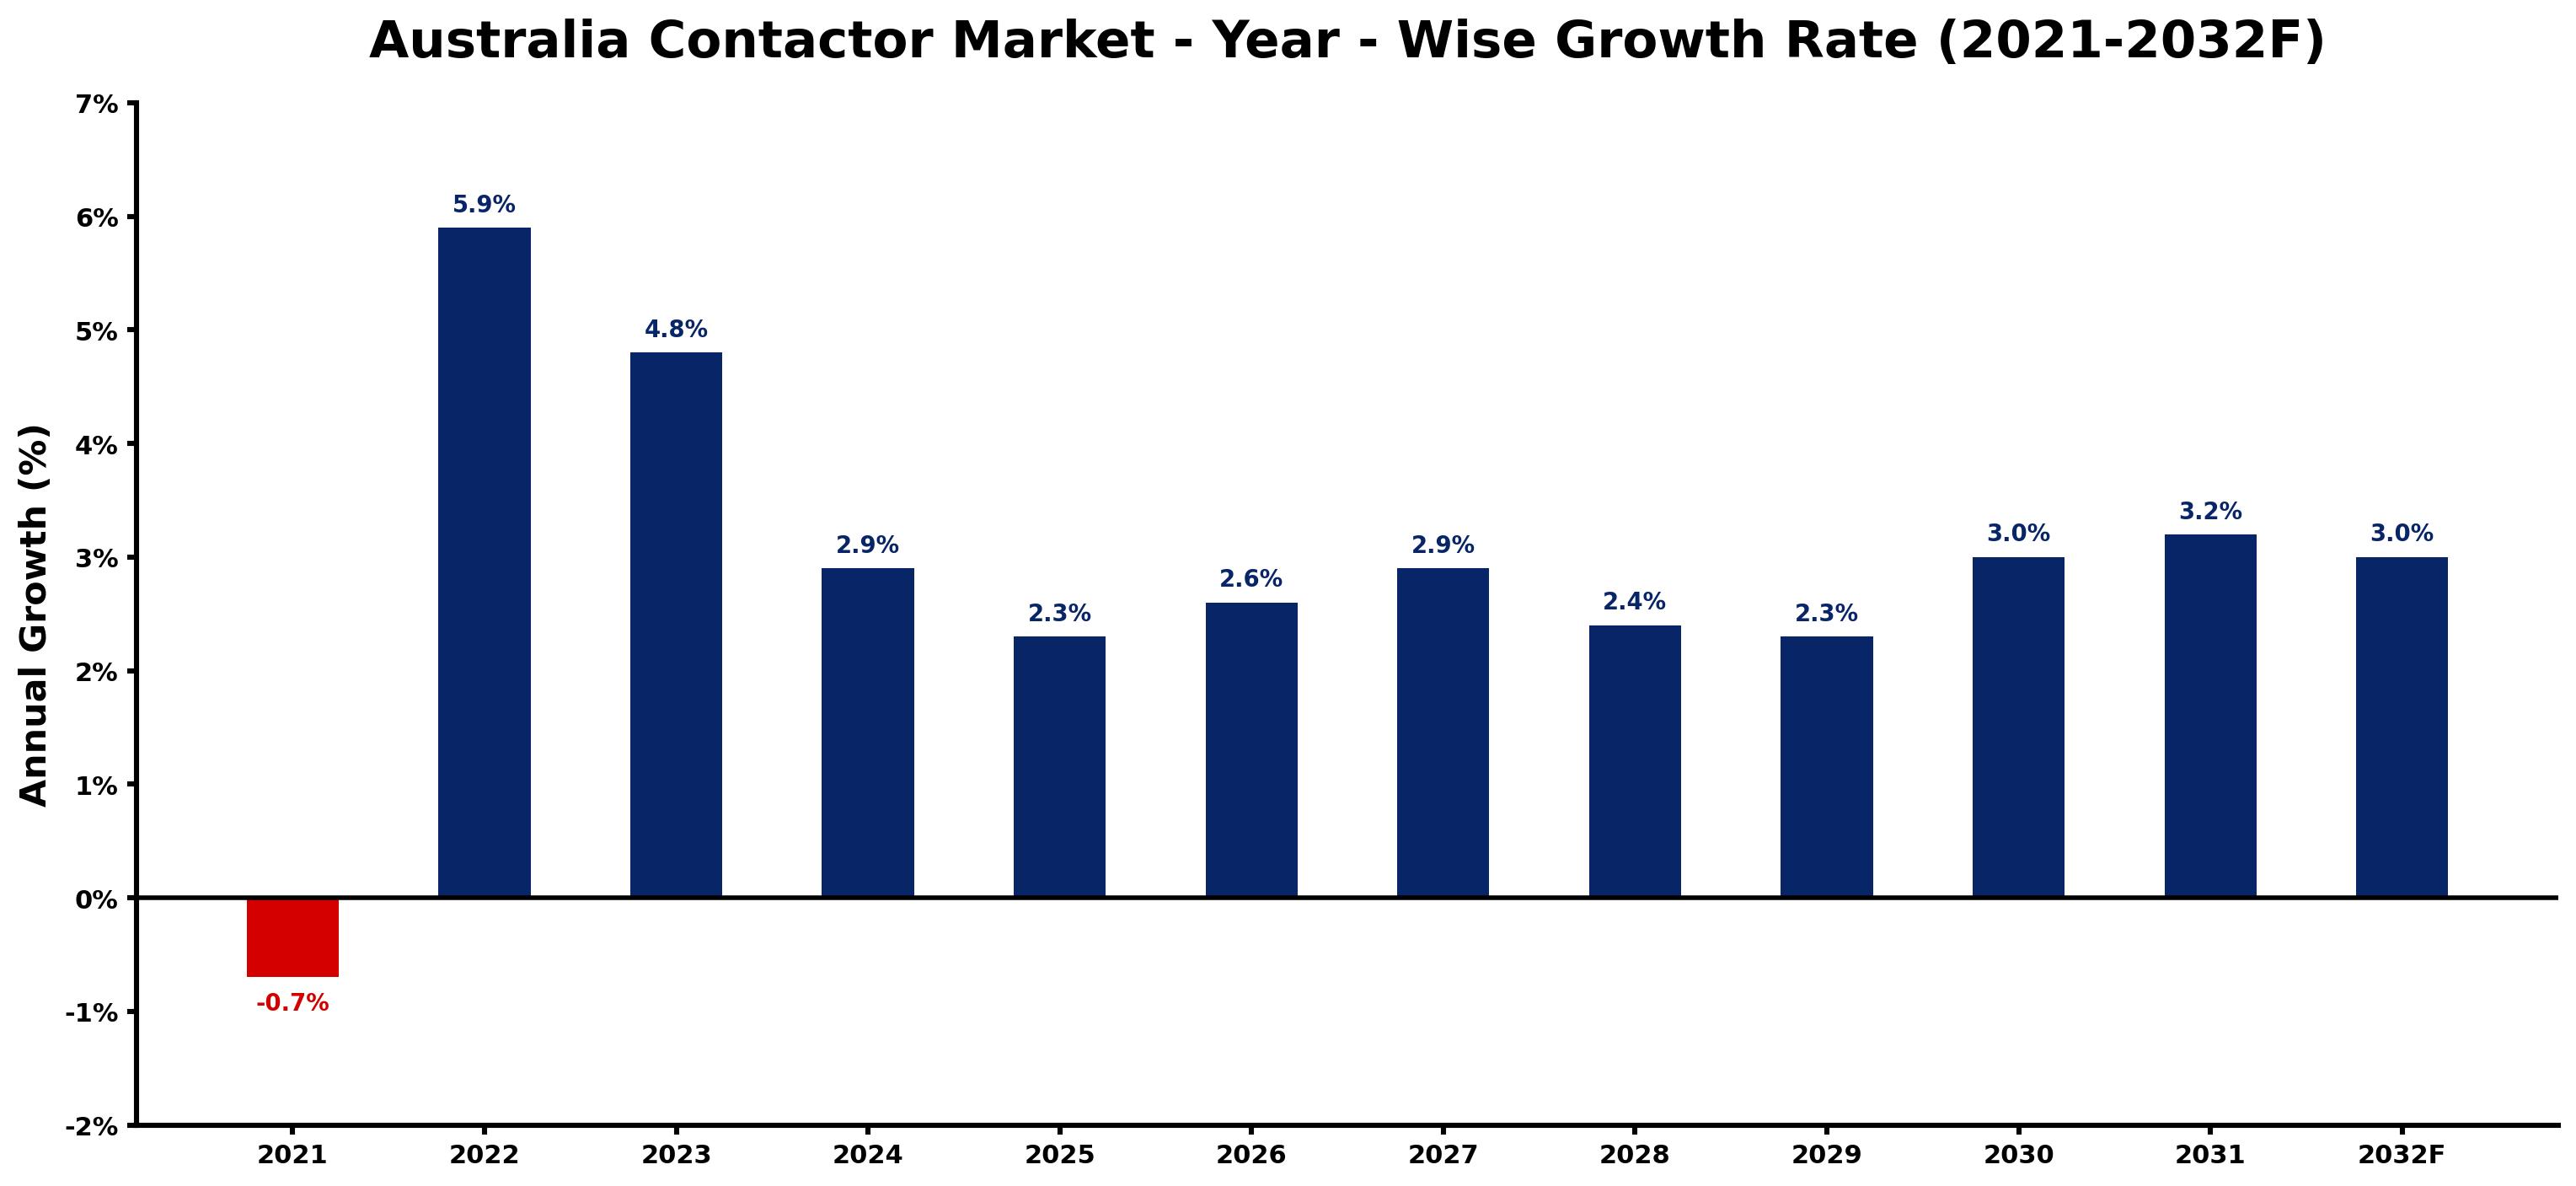
Australia Contactor Market Growth Rate Analysis (2021-2032)
The Australia contractor market has exhibited notable fluctuations in growth rates over recent years. After experiencing a decline of 0.7% in 2021, the market rebounded effectively with a substantial 5.9% growth in 2022, fueled by increased infrastructure investments and a surge in energy transition initiatives. Growth continued at 4.8% in 2023, driven by heightened consumer demand for efficient electrical solutions and digitalization in various sectors. Looking ahead, although the growth is expected to moderate to around 2.9% by 2024 and stabilize around 2.3% to 3.2% through 2032, ongoing advancements in technology and robust government policies will likely sustain a favorable environment for market expansion.
Australia Contactor Market Year-wise Growth Rate and Key Drivers
This graph highlights how the Australia Contactor Market has steadily grown over the past five years, supported by major growth factors.
The table below presents the year wise growth rates along with the key drivers influencing the market
| Year | Growth Rate | Major Drivers |
| 2021 | -0.7% | Labor shortages and project delays led to reduced activities and diminishing project completion rates in the construction sector. |
| 2022 | 5.9% | Technological integration in construction processes began improving efficiency and project timelines significantly. |
| 2023 | 4.8% | Emerging trends towards sustainable building practices influenced contractor strategies across the sector. |
| 2024 | 2.9% | A strong housing market combined with low-interest rates stimulated residential construction activities. |
| 2025 | 2.3% | Corporate investments in infrastructure projects reflected a commitment to long-term economic growth. |
| 2026 | 2.6% | Diverse urbanization initiatives in major cities prompted increased contractor collaboration and innovation. |
| 2027 | 2.9% | Infrastructure projects linked to climate resilience gained attention and spurred new funding avenues. |
| 2028 | 2.4% | Challenges in labor availability led to investments in skilled trades training programs nationwide. |
| 2029 | 2.3% | Urban renewal efforts gained momentum, reshaping existing neighborhoods and contractor opportunities. |
| 2030 | 3.0% | The integration of smart technology into buildings attracted interest from various stakeholders. |
| 2031 | 3.2% | Environmental sustainability considerations became essential in project planning for contractors. |
| 2032 | 3.0% | Evolving consumer expectations towards energy efficiency transformed contractor offerings and market strategies. |
Note - Market size estimations and growth projections presented in this report are based on 6Wresearch's advanced forecasting approach, validated with industry datasets as of June 2026.
Australia Contactor Market Synopsis
The Australia Contactor Market is projected to reach 2.6% and witness significant growth during the forecast period (2026-2032). This market, which was valued at USD 1.2 billion in 2019, is expected to increase to USD 1.7 billion by 2026, reflecting a compound annual growth rate (CAGR) of 5.3%. The expansion is driven by various factors including rising energy efficiency demands from both industrial and residential sectors, technological advancements, and proactive government regulations aimed at promoting high-efficiency devices.
Australia Contactor Market Growth Drivers
Several key drivers are influencing the growth of the Australia Contactor Market. Firstly, the increasing emphasis on energy-saving solutions is compelling industrial customers as well as residential users to adopt advanced contactor technologies. Secondly, technological advancements are enhancing the operational efficiency and safety of contactors, thus broadening their application scope. Additionally, government initiatives, including mandatory supply chain standards for energy-efficient equipment, are creating a more favorable environment for market growth. This proactive stance from authorities can be seen as a commitment to improving energy consumption and reducing environmental impact.
- The industrial sector is increasingly investing in energy-efficient technologies, leading to greater demand for modern contactors.
- Residential users are also becoming more aware of energy consumption, contributing to the demand for efficient contactor solutions.
- Technological innovations are making contactors safer and more reliable, which is essential for their adoption across various applications.
- Government mandates are pushing manufacturers toward higher efficiency standards, thus stimulating market growth.
- The automation trend across industries is further driving the need for advanced contactor solutions, as automation systems rely heavily on these devices for operational continuity.
Australia Contactor Market Trends and Opportunities
Current trends indicate a growing integration of automation technologies within the Australia Contactor Market. As industries strive for greater efficiency, the incorporation of automated systems is becoming increasingly prevalent, leading to heightened demand for contactor solutions. Another trend is the evolving design and functionality of contactors, with an increasing number of manufacturers developing smart contactors equipped with IoT capabilities. This technology enables remote monitoring and control, aligning with the broader trends of digital transformation in industrial setups.
- The trend toward IoT-enabled devices is creating opportunities for manufacturers to innovate in the contactor segment.
- As industries prioritize sustainability, manufacturers of contactors are focusing on developing products that support energy conservation initiatives.
- Customization is becoming a significant market demand, as end-users seek tailored solutions that meet specific operational needs.
- The growth of renewable energy sources is generating opportunities for contactor applications in solar power and wind energy sectors.
- Industry 4.0 is influencing contactor design, with more emphasis on connectivity and real-time data analytics for operational efficiency.
Australia Contactor Market Challenges and Restraints
Despite the positive growth outlook, several challenges persist in the Australia Contactor Market. The main challenge is the high competition and price sensitivity amongst manufacturers, which can impact profit margins. Furthermore, the rapid pace of technological change poses a continual challenge for manufacturers to keep up-to-date with advancements, as failing to do so can result in outdated product offerings. Additionally, the regulatory landscape can be complex, requiring manufacturers to navigate stringent compliance standards which can strain resources and increase operational costs.
- Intense competition among manufacturers can lead to price wars, impacting profitability.
- The rapid evolution of technology necessitates ongoing investment in research and development to remain relevant.
- Compliance with government regulations can be resource-intensive, creating burdens for smaller manufacturers.
- Supply chain disruptions can impact the availability of components necessary for manufacturing contactors.
- The increasing complexity of customer demands requires manufacturers to be agile and responsive, which can be challenging to implement across broader operations.
Australia Contactor Market Government Investment and Initiatives
Government investment and initiatives play a critical role in shaping the Australia Contactor Market. Authorities are actively promoting energy efficiency through various programs aimed at incentivizing the adoption of high-efficiency contactors. These initiatives include grants and subsidies for industries that incorporate energy-saving technologies and programs that focus on educating both consumers and manufacturers about the benefits of upgrading to modern, efficient contactor solutions. Additionally, mandatory regulations regarding energy performance standards are being enforced, compelling manufacturers to improve product offerings. This government support catalyzes technological advancements while positioning Australia as a leader in energy-efficient industrial practices.
Australia Contactor Market Latest Developments (May 2025 - June 2026)
Between May 2025 and June 2026, the Australia Contactor Market has witnessed significant shifts aimed at modernization and energy efficiency. Industry stakeholders have increasingly adopted smart technologies within contactor systems, with an emphasis on reducing energy consumption and improving operational reliability. Furthermore, there has been a noticeable trend towards developing contactors that can easily integrate into automated systems. This period has also seen an increase in collaborative efforts among manufacturers to innovate and bring to market more efficient electrical components. Regulatory bodies have reinforced their commitment to enforcing energy efficiency standards, further fostering a landscape conducive to growth and advancement in the market.
Australia Contactor Market - Key Attractiveness of the Report
- 10 Years of Market Numbers
- Historical Data Starting from 2022 to 2025
- Base Year: 2025
- Forecast Data until 2032
- Key Performance Indicators Impacting the Market
- Major Upcoming Developments and Projects
Key Highlights of the Report:
- Australia Contactor Market Outlook
- Market Size of Australia Contactor Market, 2025
- Forecast of Australia Contactor Market, 2032F
- Historical Data and Forecast of Australia Contactor Revenues & Volume for the Period 2022-2032F
- Australia Contactor Market Trend Evolution
- Australia Contactor Market Drivers and Challenges
- Australia Contactor Price Trends
- Australia Contactor Porter's Five Forces
- Australia Contactor Industry Life Cycle
- Historical Data and Forecast of Australia Contactor Market Revenues & Volume By Type for the Period 2022-2032F
- Historical Data and Forecast of Australia Contactor Market Revenues & Volume By Solid-State Contactor for the Period 2022-2032F
- Historical Data and Forecast of Australia Contactor Market Revenues & Volume By Magnetic Contactor for the Period 2022-2032F
- Historical Data and Forecast of Australia Contactor Market Revenues & Volume By Vacuum Contactor for the Period 2022-2032F
- Historical Data and Forecast of Australia Contactor Market Revenues & Volume By Lighting Contactor for the Period 2022-2032F
- Historical Data and Forecast of Australia Contactor Market Revenues & Volume By Product for the Period 2022-2032F
- Historical Data and Forecast of Australia Contactor Market Revenues & Volume By DC Contactor for the Period 2022-2032F
- Historical Data and Forecast of Australia Contactor Market Revenues & Volume By AC Contactor for the Period 2022-2032F
- Historical Data and Forecast of Australia Contactor Market Revenues & Volume By Poles for the Period 2022-2032F
- Historical Data and Forecast of Australia Contactor Market Revenues & Volume By 2-Pole for the Period 2022-2032F
- Historical Data and Forecast of Australia Contactor Market Revenues & Volume By 3-Pole for the Period 2022-2032F
- Historical Data and Forecast of Australia Contactor Market Revenues & Volume By 4-Pole for the Period 2022-2032F
- Historical Data and Forecast of Australia Contactor Market Revenues & Volume By Others for the Period 2022-2032F
- Historical Data and Forecast of Australia Contactor Market Revenues & Volume By Voltage for the Period 2022-2032F
- Historical Data and Forecast of Australia Contactor Market Revenues & Volume By Low Voltage (Up To 1 KV) for the Period 2022-2032F
- Historical Data and Forecast of Australia Contactor Market Revenues & Volume By Medium Voltage (1 KV ? 7.2 KV) for the Period 2022-2032F
- Historical Data and Forecast of Australia Contactor Market Revenues & Volume By High Voltage (Above 7.2 KV) for the Period 2022-2032F
- Historical Data and Forecast of Australia Contactor Market Revenues & Volume By End-users for the Period 2022-2032F
- Historical Data and Forecast of Australia Contactor Market Revenues & Volume By Automotive for the Period 2022-2032F
- Historical Data and Forecast of Australia Contactor Market Revenues & Volume By Power for the Period 2022-2032F
- Historical Data and Forecast of Australia Contactor Market Revenues & Volume By Oil & Gas for the Period 2022-2032F
- Historical Data and Forecast of Australia Contactor Market Revenues & Volume By Food & Beverage for the Period 2022-2032F
- Historical Data and Forecast of Australia Contactor Market Revenues & Volume By Construction for the Period 2022-2032F
- Historical Data and Forecast of Australia Contactor Market Revenues & Volume By Data Centers for the Period 2022-2032F
- Historical Data and Forecast of Australia Contactor Market Revenues & Volume By FA Robots for the Period 2022-2032F
- Historical Data and Forecast of Australia Contactor Market Revenues & Volume By Others for the Period 2022-2032F
- Australia Contactor Import Export Trade Statistics
- Market Opportunity Assessment By Type
- Market Opportunity Assessment By Product
- Market Opportunity Assessment By Poles
- Market Opportunity Assessment By Voltage
- Market Opportunity Assessment By End-users
- Australia Contactor Top Companies Market Share
- Australia Contactor Competitive Benchmarking By Technical and Operational Parameters
- Australia Contactor Company Profiles
- Australia Contactor Key Strategic Recommendations
Frequently Asked Questions About the Market Study (FAQs):
The Australia Contactor Market is projected to grow at a CAGR of 5.3% from 2026 to 2032.
Key drivers include increasing demands for energy efficiency, technological advancements, and government regulations promoting high-efficiency contactors.
Government policies are encouraging the adoption of high-efficiency contactors through incentives and strict compliance standards aimed at improving energy usage in various sectors.
Recent trends include the integration of automation technologies and the development of IoT-enabled contactors that enhance operational efficiency and monitoring capabilities.
6Wresearch actively monitors the Australia Contactor Market and publishes its comprehensive annual report, highlighting emerging trends, growth drivers, revenue analysis, and forecast outlook. Our insights help businesses to make data-backed strategic decisions with ongoing market dynamics. Our analysts track relevent industries related to the Australia Contactor Market, allowing our clients with actionable intelligence and reliable forecasts tailored to emerging regional needs.
Yes, we provide customisation as per your requirements. To learn more, feel free to contact us on sales@6wresearch.com
1 Executive Summary |
2 Introduction |
2.1 Key Highlights of the Report |
2.2 Report Description |
2.3 Market Scope & Segmentation |
2.4 Research Methodology |
2.5 Assumptions |
3 Australia Contactor Market Overview |
3.1 Australia Country Macro Economic Indicators |
3.2 Australia Contactor Market Revenues & Volume, 2022 & 2032F |
3.3 Australia Contactor Market - Industry Life Cycle |
3.4 Australia Contactor Market - Porter's Five Forces |
3.5 Australia Contactor Market Revenues & Volume Share, By Type, 2022 & 2032F |
3.6 Australia Contactor Market Revenues & Volume Share, By Product, 2022 & 2032F |
3.7 Australia Contactor Market Revenues & Volume Share, By Poles, 2022 & 2032F |
3.8 Australia Contactor Market Revenues & Volume Share, By Voltage, 2022 & 2032F |
3.9 Australia Contactor Market Revenues & Volume Share, By End-users, 2022 & 2032F |
4 Australia Contactor Market Dynamics |
4.1 Impact Analysis |
4.2 Market Drivers |
4.3 Market Restraints |
5 Australia Contactor Market Trends |
6 Australia Contactor Market, By Types |
6.1 Australia Contactor Market, By Type |
6.1.1 Overview and Analysis |
6.1.2 Australia Contactor Market Revenues & Volume, By Type, 2022-2032F |
6.1.3 Australia Contactor Market Revenues & Volume, By Solid-State Contactor, 2022-2032F |
6.1.4 Australia Contactor Market Revenues & Volume, By Magnetic Contactor, 2022-2032F |
6.1.5 Australia Contactor Market Revenues & Volume, By Vacuum Contactor, 2022-2032F |
6.1.6 Australia Contactor Market Revenues & Volume, By Lighting Contactor, 2022-2032F |
6.2 Australia Contactor Market, By Product |
6.2.1 Overview and Analysis |
6.2.2 Australia Contactor Market Revenues & Volume, By DC Contactor, 2022-2032F |
6.2.3 Australia Contactor Market Revenues & Volume, By AC Contactor, 2022-2032F |
6.3 Australia Contactor Market, By Poles |
6.3.1 Overview and Analysis |
6.3.2 Australia Contactor Market Revenues & Volume, By 2-Pole, 2022-2032F |
6.3.3 Australia Contactor Market Revenues & Volume, By 3-Pole, 2022-2032F |
6.3.4 Australia Contactor Market Revenues & Volume, By 4-Pole, 2022-2032F |
6.3.5 Australia Contactor Market Revenues & Volume, By Others, 2022-2032F |
6.4 Australia Contactor Market, By Voltage |
6.4.1 Overview and Analysis |
6.4.2 Australia Contactor Market Revenues & Volume, By Low Voltage (Up To 1 KV), 2022-2032F |
6.4.3 Australia Contactor Market Revenues & Volume, By Medium Voltage (1 KV ? 7.2 KV), 2022-2032F |
6.4.4 Australia Contactor Market Revenues & Volume, By High Voltage (Above 7.2 KV), 2022-2032F |
6.5 Australia Contactor Market, By End-users |
6.5.1 Overview and Analysis |
6.5.2 Australia Contactor Market Revenues & Volume, By Automotive, 2022-2032F |
6.5.3 Australia Contactor Market Revenues & Volume, By Power, 2022-2032F |
6.5.4 Australia Contactor Market Revenues & Volume, By Oil & Gas, 2022-2032F |
6.5.5 Australia Contactor Market Revenues & Volume, By Food & Beverage, 2022-2032F |
6.5.6 Australia Contactor Market Revenues & Volume, By Construction, 2022-2032F |
6.5.7 Australia Contactor Market Revenues & Volume, By Data Centers, 2022-2032F |
6.5.8 Australia Contactor Market Revenues & Volume, By Others, 2022-2032F |
6.5.9 Australia Contactor Market Revenues & Volume, By Others, 2022-2032F |
7 Australia Contactor Market Import-Export Trade Statistics |
7.1 Australia Contactor Market Export to Major Countries |
7.2 Australia Contactor Market Imports from Major Countries |
8 Australia Contactor Market Key Performance Indicators |
9 Australia Contactor Market - Opportunity Assessment |
9.1 Australia Contactor Market Opportunity Assessment, By Type, 2022 & 2032F |
9.2 Australia Contactor Market Opportunity Assessment, By Product, 2022 & 2032F |
9.3 Australia Contactor Market Opportunity Assessment, By Poles, 2022 & 2032F |
9.4 Australia Contactor Market Opportunity Assessment, By Voltage, 2022 & 2032F |
9.5 Australia Contactor Market Opportunity Assessment, By End-users, 2022 & 2032F |
10 Australia Contactor Market - Competitive Landscape |
10.1 Australia Contactor Market Revenue Share, By Companies, 2025 |
10.2 Australia Contactor Market Competitive Benchmarking, By Operating and Technical Parameters |
11 Company Profiles |
12 Recommendations |
13 Disclaimer |
Global Go To Market Strategy - 2030
Export potential enables firms to identify high-growth global markets with greater confidence by combining advanced trade intelligence with a structured quantitative methodology. The framework analyzes emerging demand trends and country-level import patterns while integrating macroeconomic and trade datasets such as GDP and population forecasts, bilateral import–export flows, tariff structures, elasticity differentials between developed and developing economies, geographic distance, and import demand projections. Using weighted trade values from 2020–2024 as the base period to project country-to-country export potential for 2030, these inputs are operationalized through calculated drivers such as gravity model parameters, tariff impact factors, and projected GDP per-capita growth. Through an analysis of hidden potentials, demand hotspots, and market conditions that are most favorable to success, this method enables firms to focus on target countries, maximize returns, and global expansion with data, backed by accuracy.
By factoring in the projected importer demand gap that is currently unmet and could be potential opportunity, it identifies the potential for the Exporter (Country) among 190 countries, against the general trade analysis, which identifies the biggest importer or exporter.
To discover high-growth global markets and optimize your business strategy:
Click Here
Pricing
- Single User License$ 1,995
- Department License$ 2,400
- Site License$ 3,120
- Global License$ 3,795

Leadership Perspectives from Industry Events
Search
Thought Leadership and Analyst Meet


Our Clients
6WResearch In News
- India Air Conditioner Market Set for Strong Rebound in 2026 After Weather-Led Correction and GST-Driven Recovery: 6Wresearch
- ADAS in India: How Automatic Emergency Braking, Blind Spot Detection & Driver Monitoring are Transforming Road Safety
- Doha a strategic location for EV manufacturing hub: IPA Qatar
- Demand for luxury TVs surging in the GCC, says Samsung
- Empowering Growth: The Thriving Journey of Bangladesh’s Cable Industry
- Demand for luxury TVs surging in the GCC, says Samsung
Latest Reports
- Nicaragua RPG Gaming Market (2026-2032)
- New Zealand RPG Gaming Market (2026-2032)
- Netherlands RPG Gaming Market (2026-2032)
- Nauru RPG Gaming Market (2026-2032)
- Namibia RPG Gaming Market (2026-2032)
- Mozambique RPG Gaming Market (2026-2032)
- Montenegro RPG Gaming Market (2026-2032)
- Mongolia RPG Gaming Market (2026-2032)
- Monaco RPG Gaming Market (2026-2032)
- Micronesia RPG Gaming Market (2026-2032)
Industry Events and Analyst Meet

HIMTEX 2026

India Refining Summit 2026

India EV Show 2026

EV tech India Expo 2026

Auto Tech Asia 2026
Whitepaper
- Middle East & Africa Commercial Security Market Click here to view more.
- Middle East & Africa Fire Safety Systems & Equipment Market Click here to view more.
- GCC Drone Market Click here to view more.
- Middle East Lighting Fixture Market Click here to view more.
- GCC Physical & Perimeter Security Market Click here to view more.