Australia Converted Paper Products Market (2026-2032) | Companies, Analysis, Value, Size, Trends, Growth, Outlook, Forecast, Industry, Revenue & Share
Market Forecast By Type (Paperboard Container, Sanitary Paper Product, Stationery Product, Paper Bag And Coated And Treated Paper, Other), By End-Users (Packaging & Wrapping, Food Service, Printing, Others) And Competitive Landscape
| Product Code: ETC039136 | Publication Date: Jan 2021 | Updated Date: Jun 2026 | Product Type: Report | |
| Publisher: 6Wresearch | Author: Ravi Bhandari | No. of Pages: 70 | No. of Figures: 35 | No. of Tables: 5 |
Australia Converted Paper Products Market Summary
The australia converted paper products market was estimated at USD 118 Million in 2025 and is projected to reach USD 138 Million by 2032, growing at a CAGR of 2.6% from 2026 to 2032.
Australia Converted Paper Products Market Growth Rate Analysis (2021-2032)
The Australian converted paper products market has experienced notable fluctuations in growth over the past few years. Following a decline of 0.7% in 2021, driven by pandemic-related disruptions and shifts towards digital alternatives, the market rebounded strongly in 2022, posting a growth rate of 5.4%. This resurgence can be attributed to increased consumer demand as businesses adjusted operations and consumers returned to traditional paper products. Growth continued at 5.0% in 2023, supported by investments in sustainable production technologies and enhanced infrastructure. As we look ahead, a more moderate growth trajectory is projected, with estimated rates around 2.4% to 3.1% from 2024 to 2032, reflecting emerging trends in environmental consciousness and steady industrial advancements.
Australia Converted Paper Products Market Year-wise Growth Rate and Key Drivers
This graph highlights how the Australia Converted Paper Products Market has steadily grown over the past five years, supported by major growth factors.
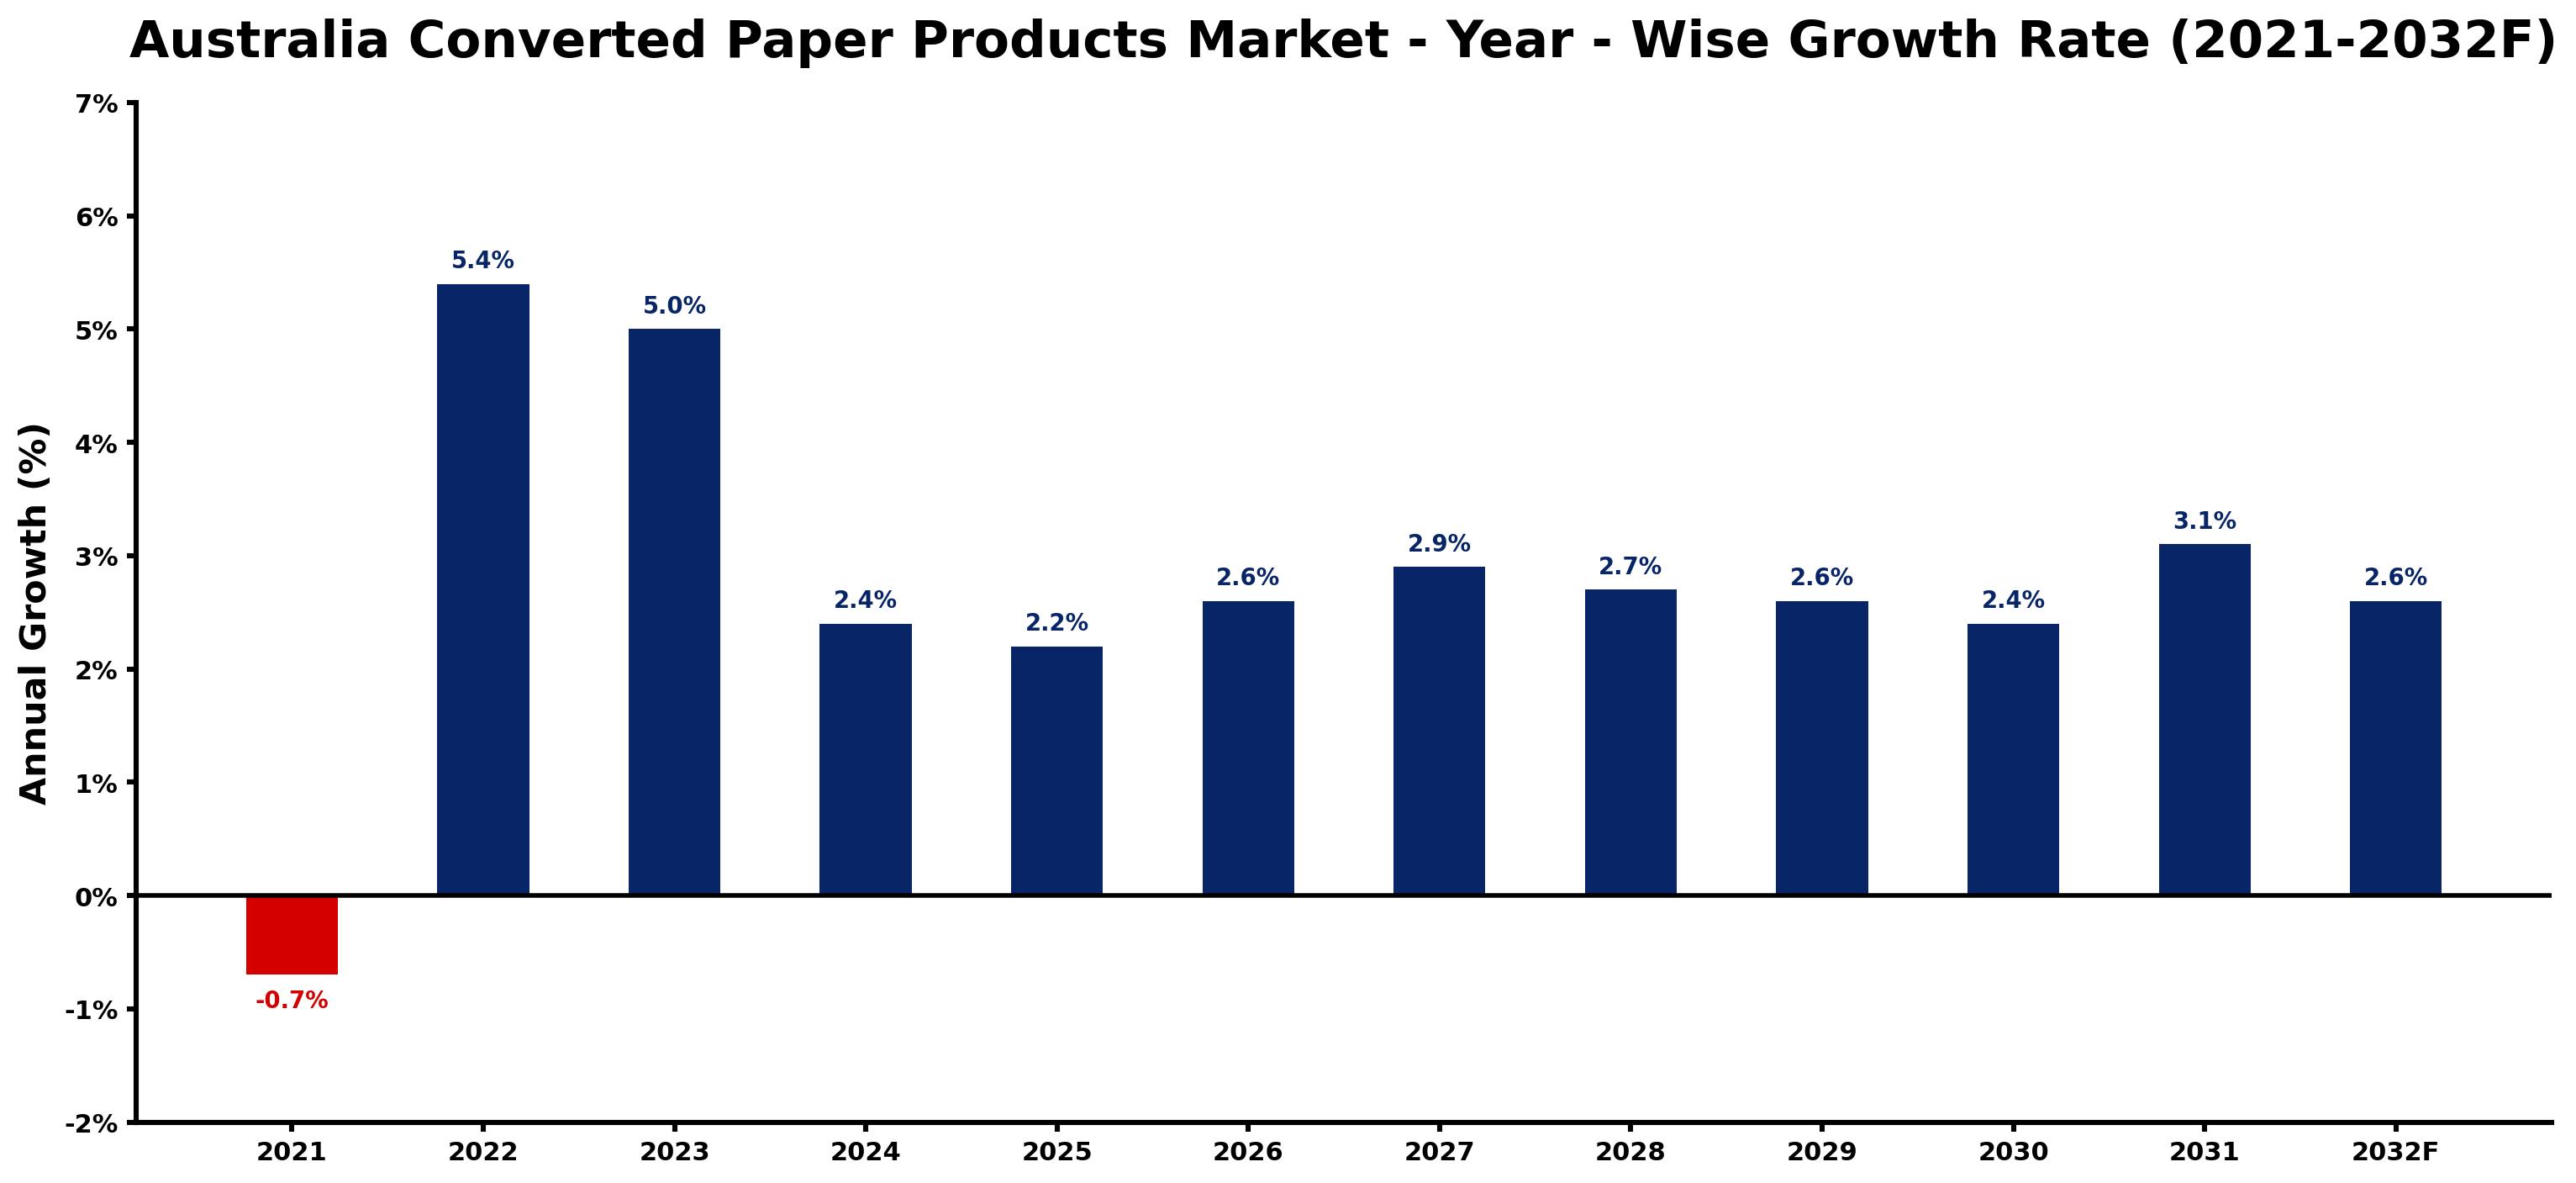
The table below presents the year wise growth rates along with the key drivers influencing the market
| Year | Growth Rate | Major Drivers |
| 2021 | -0.7% | Growing environmental concerns led to reduced demand for singleuse paper products in various sectors. |
| 2022 | 5.4% | Consumer preferences increasingly align with environmental consciousness in product packaging choices. |
| 2023 | 5.0% | Major retailers commence phasing out single-use plastics, boosting demand for paper alternatives. |
| 2024 | 2.4% | Local startups emerge, innovating in biodegradable paper products for eco-friendly packaging. |
| 2025 | 2.2% | Corporate social responsibility becomes a key focus, influencing packaging material decisions. |
| 2026 | 2.6% | E-commerce growth necessitates innovative packaging solutions, enhancing paper product market potential. |
| 2027 | 2.9% | Market competition drives advancements in recycled paper product technologies and production efficiency. |
| 2028 | 2.7% | Consumer education campaigns highlight benefits of paper products, shaping purchasing behaviors significantly. |
| 2029 | 2.6% | Collaborations between manufacturers and environmental organizations promote sustainable practices in the industry. |
| 2030 | 2.4% | Technological advancements streamline production processes, reducing costs and environmental impacts drastically. |
| 2031 | 3.1% | Increased awareness of waste management issues prompts shifts to sustainable paper packaging solutions. |
| 2032 | 2.6% | Market forecasts indicate a stable growth trajectory, aligning with global sustainability trends. |
Note - Market size estimations and growth projections presented in this report are based on 6Wresearch's advanced forecasting approach, validated with industry datasets as of June 2026.
Australia Converted Paper Products Market Synopsis
The Australia Converted Paper Products Market is projected to reach 2.6% and witness significant growth during the forecast period (2026-2032). This dynamic market encompasses a diverse range of paper-based products that have undergone various conversion processes such as cutting, folding, and printing, tailored to meet specific end-user requirements. Key products in this market include packaging materials, stationery items, and specialty papers utilized across numerous industries.
Australia Converted Paper Products Market Growth Drivers
The Australia Converted Paper Products market is poised for steady growth, driven by several pivotal factors. Firstly, the increasing focus on sustainable packaging solutions has markedly influenced consumer preferences and business practices. Eco-friendly converted paper products, including recyclable packaging materials, tissue paper, and paperboard products, are gaining traction in both retail and industrial sectors. Secondly, the burgeoning e-commerce sector has significantly escalated the demand for packaging materials. As online shopping continues to rise, companies are seeking efficient, sustainable packaging options to meet customer expectations.
- The trend towards sustainability is reshaping product development and manufacturing processes within the market.
- Technological advancements in printing and converting equipment are enabling the production of innovative and customizable paper products.
- Consumer awareness regarding environmental impact is encouraging the switch from plastic to paper-based solutions.
- The push for biodegradability and recyclability is compelling manufacturers to invest in green technologies.
- Furthermore, the increasing trend of personalized products in packaging is fostering creativity and innovation in product design.
Australia Converted Paper Products Market Challenges and Restraints
Despite the promising growth landscape, the Australia Converted Paper Products market faces several challenges. A primary concern revolves around sustainability and environmental compliance. Manufacturers must navigate stringent regulations while satisfying consumer demands for eco-friendly products without compromising cost-effectiveness. Additionally, raw material price volatility poses a significant risk to profit margins, making it vital for companies to strategize their sourcing effectively.
- Supply chain disruptions, particularly in raw material procurement, can adversely affect production schedules and costs.
- The rise of alternative packaging materials, such as bioplastics, presents stiff competition to traditional paper products.
- Digitalization in communication is shifting demand away from physical paper products, impacting specific market segments.
- Maintaining a balance between production scale and sustainability objectives remains a persistent challenge.
- Lastly, increased competition amongst manufacturers may lead to price wars, affecting overall market stability.
Australia Converted Paper Products Market Government Investment and Initiatives
Government policies play a crucial role in shaping the Australia Converted Paper Products market. The Australian government has implemented a range of regulations aimed at promoting environmental sustainability and encouraging the transition towards recyclable materials. Initiatives focused on reducing single-use plastics are influencing manufacturers to adopt eco-friendly practices. Moreover, public spending on waste management infrastructure is expected to enhance recycling capabilities across the sector.
- The government actively promotes the use of recycled materials in packaging and paper products through various incentives.
- Regulatory frameworks favoring products with eco-labels and certifications further stimulate market growth.
- Collaborative efforts between government, industry stakeholders, and environmental organizations are pivotal in market development.
- Public awareness campaigns targeting sustainability are increasing consumer demand for eco-friendly products.
- Investment in research and development to innovate sustainable materials is a key focus area for government funding.
Australia Converted Paper Products Market Latest Developments (May 2025 - June 2026)
The period from May 2025 to June 2026 has seen a notable shift in the Australia Converted Paper Products market landscape. Recent industry movements emphasize the continual push for sustainability and innovation in product offerings. Manufacturers are increasingly adopting advanced technologies to enhance the efficiency of converting processes and reduce environmental impact. There has also been a significant surge in collaborations among businesses aimed at developing sustainable packaging solutions. Additionally, consumer demand for customizable paper products is driving market players to focus on innovative designs, further solidifying the trend towards personalization in packaging.
Australia Converted Paper Products Market - Key Attractiveness of the Report
- 10 Years of Market Numbers
- Historical Data Starting from 2022 to 2025
- Base Year: 2025
- Forecast Data until 2032
- Key Performance Indicators Impacting the Market
- Major Upcoming Developments and Projects
Key Highlights of the Report:
- Australia Converted Paper Products Market Outlook
- Market Size of Australia Converted Paper Products Market, 2025
- Forecast of Australia Converted Paper Products Market, 2032
- Historical Data and Forecast of Australia Converted Paper Products Revenues & Volume for the Period 2022-2032F
- Australia Converted Paper Products Market Trend Evolution
- Australia Converted Paper Products Market Drivers and Challenges
- Australia Converted Paper Products Price Trends
- Australia Converted Paper Products Porter's Five Forces
- Australia Converted Paper Products Industry Life Cycle
- Historical Data and Forecast of Australia Converted Paper Products Market Revenues & Volume By Type for the Period 2022-2032F
- Historical Data and Forecast of Australia Converted Paper Products Market Revenues & Volume By Paperboard Container for the Period 2022-2032F
- Historical Data and Forecast of Australia Converted Paper Products Market Revenues & Volume By Sanitary Paper Product for the Period 2022-2032F
- Historical Data and Forecast of Australia Converted Paper Products Market Revenues & Volume By Stationery Product for the Period 2022-2032F
- Historical Data and Forecast of Australia Converted Paper Products Market Revenues & Volume By Paper Bag And Coated And Treated Paper for the Period 2022-2032F
- Historical Data and Forecast of Australia Converted Paper Products Market Revenues & Volume By Other for the Period 2022-2032F
- Historical Data and Forecast of Australia Converted Paper Products Market Revenues & Volume By End-Users for the Period 2022-2032F
- Historical Data and Forecast of Australia Converted Paper Products Market Revenues & Volume By Packaging & Wrapping for the Period 2022-2032F
- Historical Data and Forecast of Australia Converted Paper Products Market Revenues & Volume By Food Service for the Period 2022-2032F
- Historical Data and Forecast of Australia Converted Paper Products Market Revenues & Volume By Printing for the Period 2022-2032F
- Historical Data and Forecast of Australia Converted Paper Products Market Revenues & Volume By Others for the Period 2022-2032F
- Australia Converted Paper Products Import Export Trade Statistics
- Market Opportunity Assessment By Type
- Market Opportunity Assessment By End-Users
- Australia Converted Paper Products Top Companies Market Share
- Australia Converted Paper Products Competitive Benchmarking By Technical and Operational Parameters
- Australia Converted Paper Products Company Profiles
- Australia Converted Paper Products Key Strategic Recommendations
Frequently Asked Questions About the Market Study (FAQs):
The market is primarily driven by the increasing demand for sustainable packaging, growth in the e-commerce sector, and advancements in printing and converting technologies.
Manufacturers need to navigate stringent regulations while managing costs, overcoming raw material price volatility, and competing against alternative materials.
The Australian government supports the market through regulations promoting recyclable materials, public spending on waste management, and incentives for eco-labeled products.
Trends include a focus on innovation, increased consumer demand for personalized products, and a strong push towards sustainability and eco-friendly packaging solutions.
6Wresearch actively monitors the Australia Converted Paper Products Market and publishes its comprehensive annual report, highlighting emerging trends, growth drivers, revenue analysis, and forecast outlook. Our insights help businesses to make data-backed strategic decisions with ongoing market dynamics. Our analysts track relevent industries related to the Australia Converted Paper Products Market, allowing our clients with actionable intelligence and reliable forecasts tailored to emerging regional needs.
Yes, we provide customisation as per your requirements. To learn more, feel free to contact us on sales@6wresearch.com
1 Executive Summary |
2 Introduction |
2.1 Key Highlights of the Report |
2.2 Report Description |
2.3 Market Scope & Segmentation |
2.4 Research Methodology |
2.5 Assumptions |
3 Australia Converted Paper Products Market Overview |
3.1 Australia Country Macro Economic Indicators |
3.2 Australia Converted Paper Products Market Revenues & Volume, 2022 & 2032F |
3.3 Australia Converted Paper Products Market - Industry Life Cycle |
3.4 Australia Converted Paper Products Market - Porter's Five Forces |
3.5 Australia Converted Paper Products Market Revenues & Volume Share, By Type, 2022 & 2032F |
3.6 Australia Converted Paper Products Market Revenues & Volume Share, By End-Users, 2022 & 2032F |
4 Australia Converted Paper Products Market Dynamics |
4.1 Impact Analysis |
4.2 Market Drivers |
4.2.1 Growing emphasis on sustainable packaging solutions |
4.2.2 Increasing demand for eco-friendly and recyclable paper products |
4.2.3 Technological advancements in paper converting processes |
4.3 Market Restraints |
4.3.1 Fluctuating raw material prices |
4.3.2 Intense competition from alternative packaging materials |
4.3.3 Regulatory challenges related to environmental standards |
5 Australia Converted Paper Products Market Trends |
6 Australia Converted Paper Products Market, By Types |
6.1 Australia Converted Paper Products Market, By Type |
6.1.1 Overview and Analysis |
6.1.2 Australia Converted Paper Products Market Revenues & Volume, By Type, 2022-2032F |
6.1.3 Australia Converted Paper Products Market Revenues & Volume, By Paperboard Container, 2022-2032F |
6.1.4 Australia Converted Paper Products Market Revenues & Volume, By Sanitary Paper Product, 2022-2032F |
6.1.5 Australia Converted Paper Products Market Revenues & Volume, By Stationery Product, 2022-2032F |
6.1.6 Australia Converted Paper Products Market Revenues & Volume, By Paper Bag And Coated And Treated Paper, 2022-2032F |
6.1.7 Australia Converted Paper Products Market Revenues & Volume, By Other, 2022-2032F |
6.2 Australia Converted Paper Products Market, By End-Users |
6.2.1 Overview and Analysis |
6.2.2 Australia Converted Paper Products Market Revenues & Volume, By Packaging & Wrapping, 2022-2032F |
6.2.3 Australia Converted Paper Products Market Revenues & Volume, By Food Service, 2022-2032F |
6.2.4 Australia Converted Paper Products Market Revenues & Volume, By Printing, 2022-2032F |
6.2.5 Australia Converted Paper Products Market Revenues & Volume, By Others, 2022-2032F |
7 Australia Converted Paper Products Market Import-Export Trade Statistics |
7.1 Australia Converted Paper Products Market Export to Major Countries |
7.2 Australia Converted Paper Products Market Imports from Major Countries |
8 Australia Converted Paper Products Market Key Performance Indicators |
8.1 Percentage of recycled content in converted paper products |
8.2 Energy efficiency improvements in paper converting operations |
8.3 Adoption rate of innovative paper converting technologies |
8.4 Customer satisfaction with the eco-friendliness of paper products |
8.5 Number of new product introductions in the converted paper products market |
9 Australia Converted Paper Products Market - Opportunity Assessment |
9.1 Australia Converted Paper Products Market Opportunity Assessment, By Type, 2022 & 2032F |
9.2 Australia Converted Paper Products Market Opportunity Assessment, By End-Users, 2022 & 2032F |
10 Australia Converted Paper Products Market - Competitive Landscape |
10.1 Australia Converted Paper Products Market Revenue Share, By Companies, 2025 |
10.2 Australia Converted Paper Products Market Competitive Benchmarking, By Operating and Technical Parameters |
11 Company Profiles |
12 Recommendations |
13 Disclaimer |
Global Go To Market Strategy - 2030
Export potential enables firms to identify high-growth global markets with greater confidence by combining advanced trade intelligence with a structured quantitative methodology. The framework analyzes emerging demand trends and country-level import patterns while integrating macroeconomic and trade datasets such as GDP and population forecasts, bilateral import–export flows, tariff structures, elasticity differentials between developed and developing economies, geographic distance, and import demand projections. Using weighted trade values from 2020–2024 as the base period to project country-to-country export potential for 2030, these inputs are operationalized through calculated drivers such as gravity model parameters, tariff impact factors, and projected GDP per-capita growth. Through an analysis of hidden potentials, demand hotspots, and market conditions that are most favorable to success, this method enables firms to focus on target countries, maximize returns, and global expansion with data, backed by accuracy.
By factoring in the projected importer demand gap that is currently unmet and could be potential opportunity, it identifies the potential for the Exporter (Country) among 190 countries, against the general trade analysis, which identifies the biggest importer or exporter.
To discover high-growth global markets and optimize your business strategy:
Click Here
Pricing
- Single User License$ 1,995
- Department License$ 2,400
- Site License$ 3,120
- Global License$ 3,795

Leadership Perspectives from Industry Events
Search
Thought Leadership and Analyst Meet


Our Clients
6WResearch In News
- India Air Conditioner Market Set for Strong Rebound in 2026 After Weather-Led Correction and GST-Driven Recovery: 6Wresearch
- ADAS in India: How Automatic Emergency Braking, Blind Spot Detection & Driver Monitoring are Transforming Road Safety
- Doha a strategic location for EV manufacturing hub: IPA Qatar
- Demand for luxury TVs surging in the GCC, says Samsung
- Empowering Growth: The Thriving Journey of Bangladesh’s Cable Industry
- Demand for luxury TVs surging in the GCC, says Samsung
Latest Reports
- Nicaragua RPG Gaming Market (2026-2032)
- New Zealand RPG Gaming Market (2026-2032)
- Netherlands RPG Gaming Market (2026-2032)
- Nauru RPG Gaming Market (2026-2032)
- Namibia RPG Gaming Market (2026-2032)
- Mozambique RPG Gaming Market (2026-2032)
- Montenegro RPG Gaming Market (2026-2032)
- Mongolia RPG Gaming Market (2026-2032)
- Monaco RPG Gaming Market (2026-2032)
- Micronesia RPG Gaming Market (2026-2032)
Industry Events and Analyst Meet

HIMTEX 2026

India Refining Summit 2026

India EV Show 2026

EV tech India Expo 2026

Auto Tech Asia 2026
Whitepaper
- Middle East & Africa Commercial Security Market Click here to view more.
- Middle East & Africa Fire Safety Systems & Equipment Market Click here to view more.
- GCC Drone Market Click here to view more.
- Middle East Lighting Fixture Market Click here to view more.
- GCC Physical & Perimeter Security Market Click here to view more.