Australia Copper Oxide Market (2026-2032) Outlook | Growth, Value, Industry, Trends, Companies, Forecast, Share, Analysis, Revenue & Size
Market Forecast By End User (Electricals & Electronics, Paints & Coatings, Catalysts, Energy Storage, Others) And Competitive Landscape
| Product Code: ETC194687 | Publication Date: May 2022 | Updated Date: Mar 2026 | Product Type: Market Research Report | |
| Publisher: 6Wresearch | Author: Ravi Bhandari | No. of Pages: 60 | No. of Figures: 40 | No. of Tables: 7 |
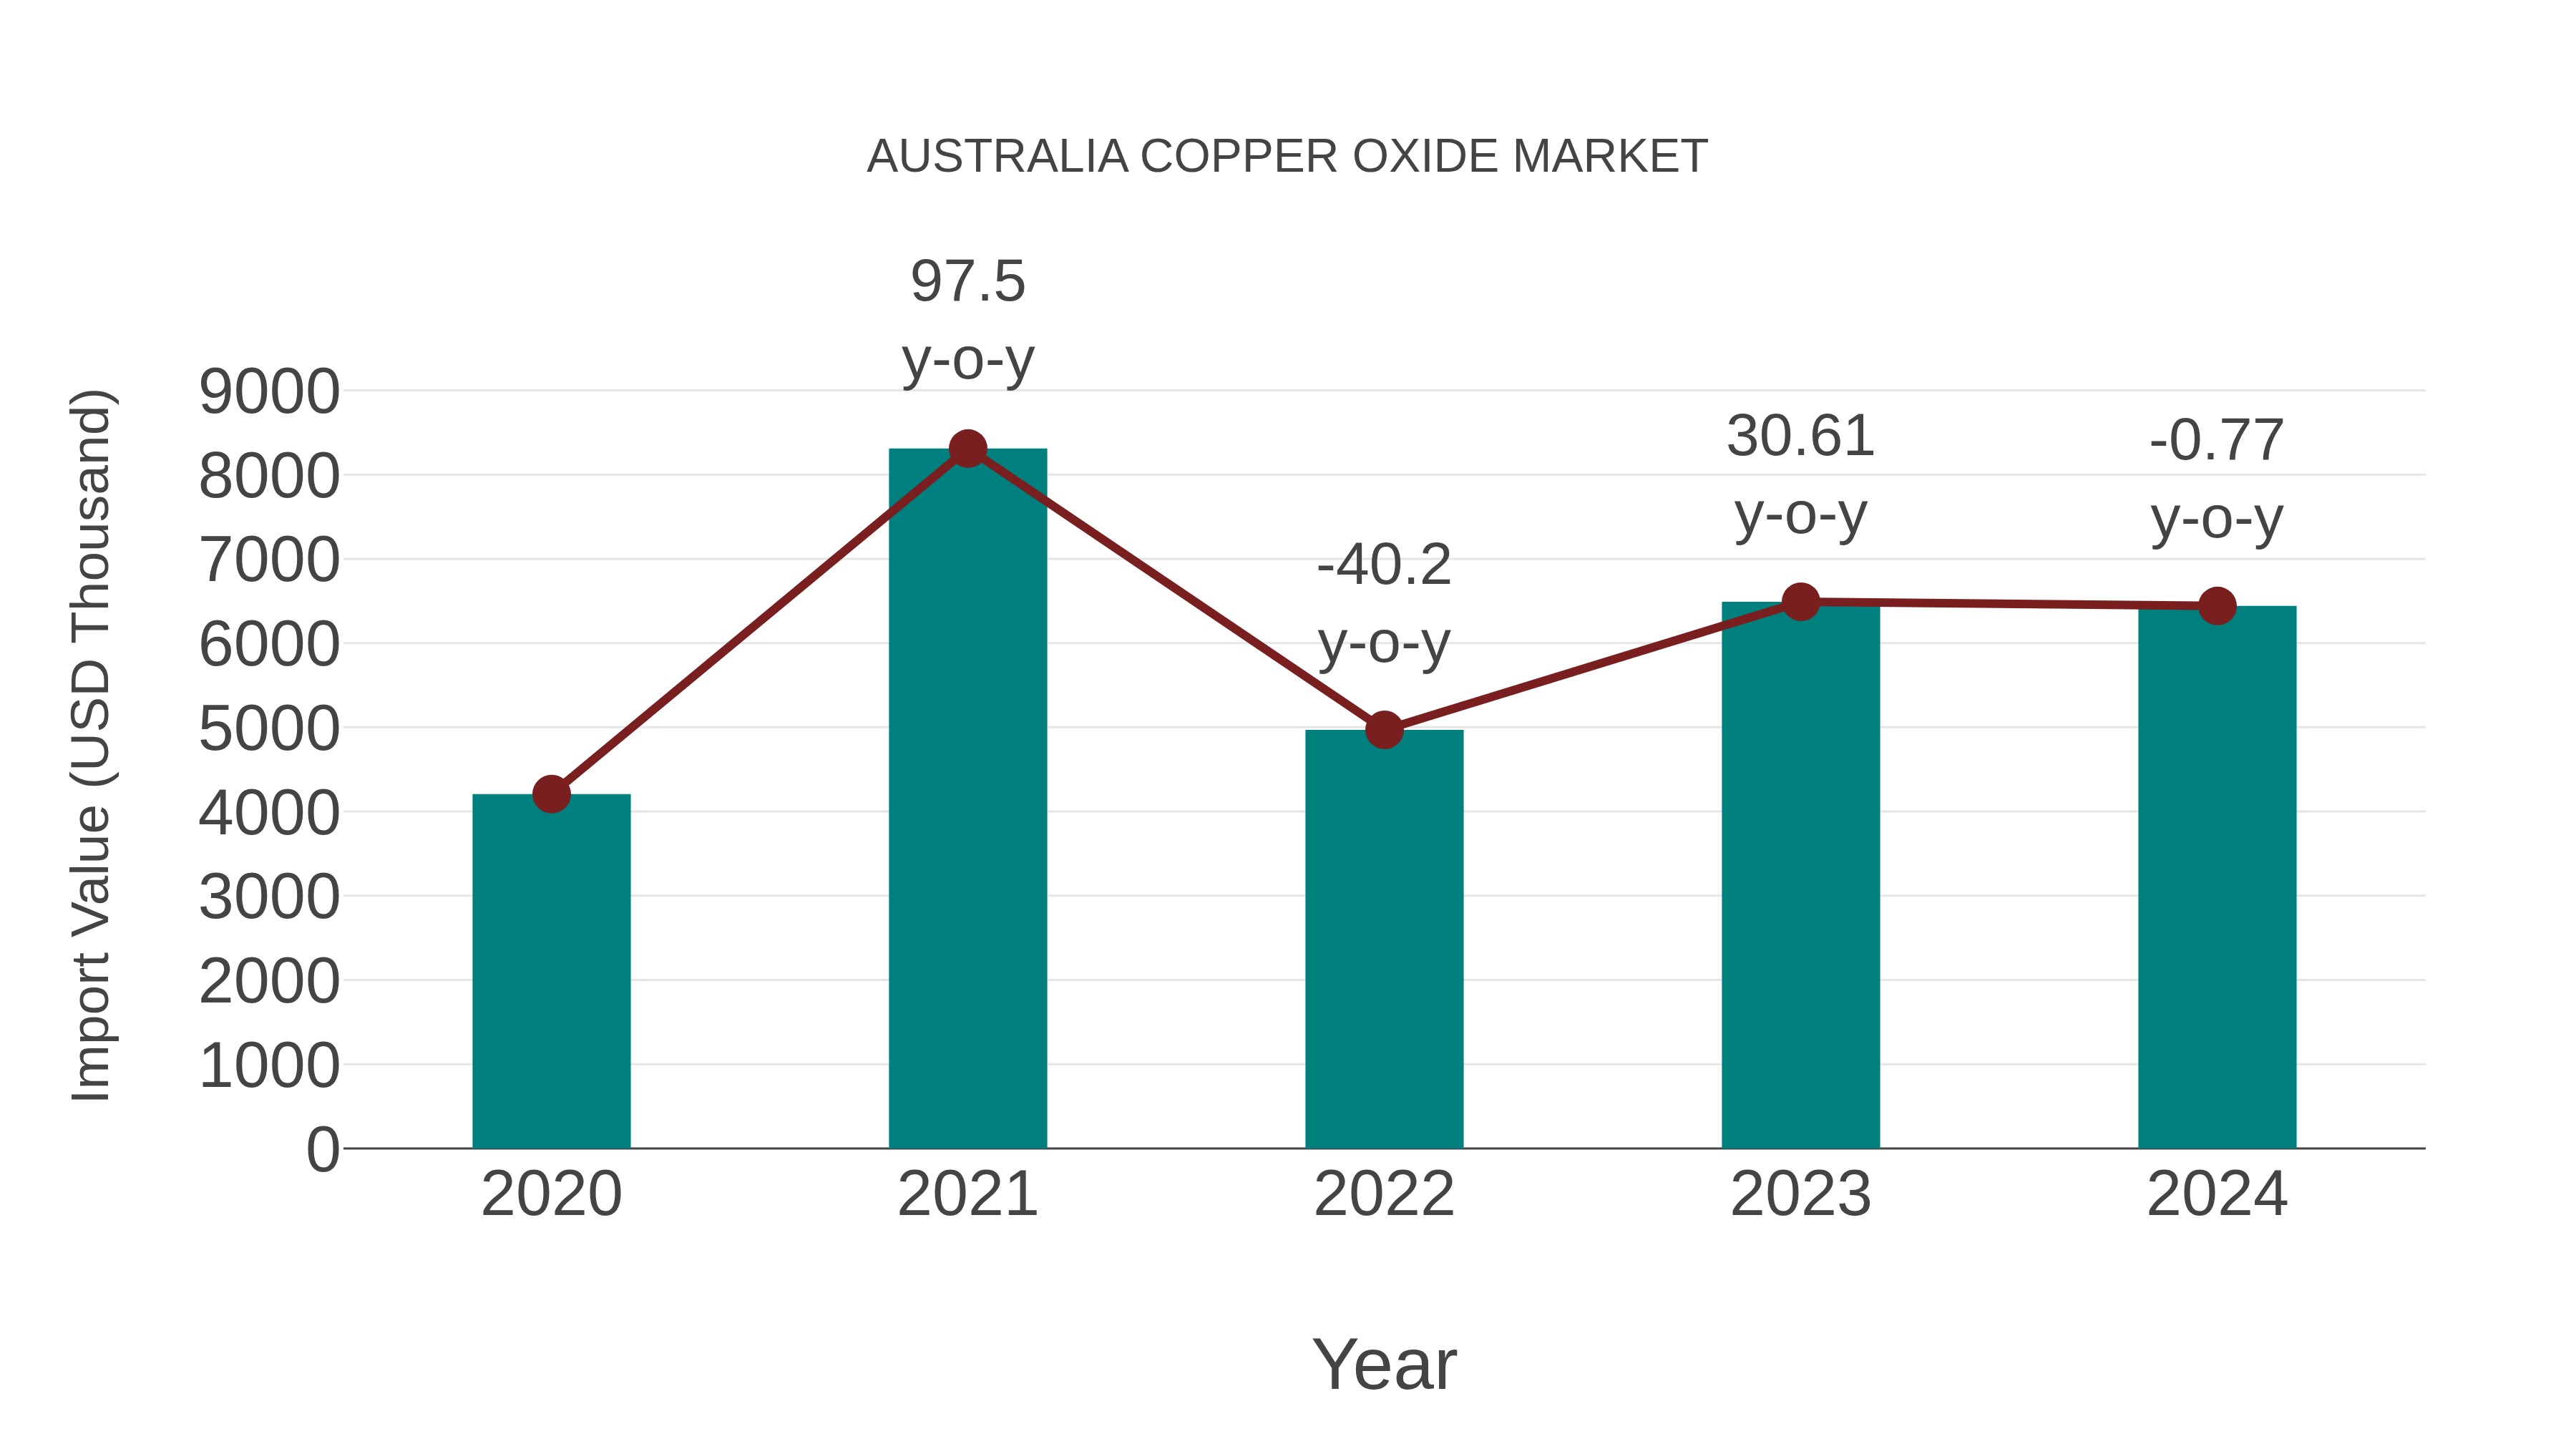
Australia Copper Oxide Market: Import Trend Analysis
In the Australia copper oxide market, the import trend showed a slight decline from 2023 to 2024, with a growth rate of -0.77%. However, the compound annual growth rate (CAGR) between 2020 and 2024 stood at a notable 11.23%. This decline in import momentum could be attributed to shifts in demand dynamics or changes in trade policies impacting market stability.
Australia Copper Oxide Market Overview
The Australia Copper Oxide market encompasses the production and distribution of copper oxide, a chemical compound with various industrial applications. Copper oxide is used as a pigment in ceramics, glass, and paints, as well as a catalyst in chemical reactions and a component in batteries and electronic devices. In Australia, copper oxide production is primarily derived from copper mining and refining processes. Factors such as industrial demand, technological advancements, regulatory requirements, and market trends influence the dynamics of the copper oxide market in Australia.
Drivers of the market
The Australia Copper Oxide market is driven by several factors contributing to its growth. One significant driver is the increasing demand for copper oxide in various industrial applications, including ceramics, pigments, and catalysts. Copper oxide is valued for its unique properties such as high thermal stability, catalytic activity, and coloration capabilities, driving its adoption across diverse industries. Moreover, technological advancements in manufacturing processes and the development of novel applications for copper oxide are expanding market opportunities in Australia. Additionally, the growing emphasis on sustainable manufacturing practices and the recyclability of copper are driving market growth.
Challenges of the market
In the copper oxide market, challenges stem from the limited applications and competition from alternative compounds. While copper oxide is used in various industries, including electronics and ceramics, its market growth is restricted by the availability of substitutes and the development of alternative technologies. Additionally, concerns about the environmental and health impacts of copper oxide can influence regulatory restrictions, affecting market demand.
Government Policy of the market
In Australia, the Copper Oxide market operates within a regulatory framework ensuring chemical safety, environmental protection, and product quality standards. Government agencies may establish guidelines for the manufacturing, storage, and use of copper oxide in various industrial applications, including electronics, ceramics, and agriculture. Regulatory bodies may also monitor compliance with safety regulations and environmental impact assessments to prevent pollution and health hazards. Government policies promoting clean energy technologies and sustainable manufacturing practices may also influence market dynamics by driving demand for copper oxide in renewable energy and environmental remediation projects.
Key Highlights of the Report:
- Australia Copper Oxide Market Outlook
- Market Size of Australia Copper Oxide Market, 2025
- Forecast of Australia Copper Oxide Market, 2032
- Historical Data and Forecast of Australia Copper Oxide Revenues & Volume for the Period 2022-2032F
- Australia Copper Oxide Market Trend Evolution
- Australia Copper Oxide Market Drivers and Challenges
- Australia Copper Oxide Price Trends
- Australia Copper Oxide Porter's Five Forces
- Australia Copper Oxide Industry Life Cycle
- Historical Data and Forecast of Australia Copper Oxide Market Revenues & Volume By End User for the Period 2022-2032F
- Historical Data and Forecast of Australia Copper Oxide Market Revenues & Volume By Electricals & Electronics for the Period 2022-2032F
- Historical Data and Forecast of Australia Copper Oxide Market Revenues & Volume By Paints & Coatings for the Period 2022-2032F
- Historical Data and Forecast of Australia Copper Oxide Market Revenues & Volume By Catalysts for the Period 2022-2032F
- Historical Data and Forecast of Australia Copper Oxide Market Revenues & Volume By Energy Storage for the Period 2022-2032F
- Historical Data and Forecast of Australia Copper Oxide Market Revenues & Volume By Others for the Period 2022-2032F
- Australia Copper Oxide Import Export Trade Statistics
- Market Opportunity Assessment By End User
- Australia Copper Oxide Top Companies Market Share
- Australia Copper Oxide Competitive Benchmarking By Technical and Operational Parameters
- Australia Copper Oxide Company Profiles
- Australia Copper Oxide Key Strategic Recommendations
Australia Copper Oxide Market (2026-2032): FAQs
6Wresearch actively monitors the Australia Copper Oxide Market and publishes its comprehensive annual report, highlighting emerging trends, growth drivers, revenue analysis, and forecast outlook. Our insights help businesses to make data-backed strategic decisions with ongoing market dynamics. Our analysts track relevent industries related to the Australia Copper Oxide Market, allowing our clients with actionable intelligence and reliable forecasts tailored to emerging regional needs.
Yes, we provide customisation as per your requirements. To learn more, feel free to contact us on sales@6wresearch.com
1 Executive Summary |
2 Introduction |
2.1 Key Highlights of the Report |
2.2 Report Description |
2.3 Market Scope & Segmentation |
2.4 Research Methodology |
2.5 Assumptions |
3 Australia Copper Oxide Market Overview |
3.1 Australia Country Macro Economic Indicators |
3.2 Australia Copper Oxide Market Revenues & Volume, 2022 & 2032F |
3.3 Australia Copper Oxide Market - Industry Life Cycle |
3.4 Australia Copper Oxide Market - Porter's Five Forces |
3.5 Australia Copper Oxide Market Revenues & Volume Share, By End User, 2022 & 2032F |
4 Australia Copper Oxide Market Dynamics |
4.1 Impact Analysis |
4.2 Market Drivers |
4.2.1 Increasing demand for copper oxide in various industries such as electronics, construction, and automotive |
4.2.2 Growing emphasis on sustainable practices leading to higher adoption of copper oxide due to its eco-friendly properties |
4.3 Market Restraints |
4.3.1 Volatility in copper prices affecting the overall cost of production and pricing of copper oxide products |
4.3.2 Intense competition from alternative materials impacting the market share of copper oxide in certain applications |
5 Australia Copper Oxide Market Trends |
6 Australia Copper Oxide Market, By Types |
6.1 Australia Copper Oxide Market, By End User |
6.1.1 Overview and Analysis |
6.1.2 Australia Copper Oxide Market Revenues & Volume, By End User, 2022-2032F |
6.1.3 Australia Copper Oxide Market Revenues & Volume, By Electricals & Electronics, 2022-2032F |
6.1.4 Australia Copper Oxide Market Revenues & Volume, By Paints & Coatings, 2022-2032F |
6.1.5 Australia Copper Oxide Market Revenues & Volume, By Catalysts, 2022-2032F |
6.1.6 Australia Copper Oxide Market Revenues & Volume, By Energy Storage, 2022-2032F |
6.1.7 Australia Copper Oxide Market Revenues & Volume, By Others, 2022-2032F |
7 Australia Copper Oxide Market Import-Export Trade Statistics |
7.1 Australia Copper Oxide Market Export to Major Countries |
7.2 Australia Copper Oxide Market Imports from Major Countries |
8 Australia Copper Oxide Market Key Performance Indicators |
8.1 Adoption rate of copper oxide in emerging industries |
8.2 Research and development investments in new applications of copper oxide |
8.3 Environmental regulations compliance related to the use of copper oxide in manufacturing processes |
9 Australia Copper Oxide Market - Opportunity Assessment |
9.1 Australia Copper Oxide Market Opportunity Assessment, By End User, 2022 & 2032F |
10 Australia Copper Oxide Market - Competitive Landscape |
10.1 Australia Copper Oxide Market Revenue Share, By Companies, 2025 |
10.2 Australia Copper Oxide Market Competitive Benchmarking, By Operating and Technical Parameters |
11 Company Profiles |
12 Recommendations |
13 Disclaimer |
Global Go To Market Strategy - 2030
Export potential enables firms to identify high-growth global markets with greater confidence by combining advanced trade intelligence with a structured quantitative methodology. The framework analyzes emerging demand trends and country-level import patterns while integrating macroeconomic and trade datasets such as GDP and population forecasts, bilateral import–export flows, tariff structures, elasticity differentials between developed and developing economies, geographic distance, and import demand projections. Using weighted trade values from 2020–2024 as the base period to project country-to-country export potential for 2030, these inputs are operationalized through calculated drivers such as gravity model parameters, tariff impact factors, and projected GDP per-capita growth. Through an analysis of hidden potentials, demand hotspots, and market conditions that are most favorable to success, this method enables firms to focus on target countries, maximize returns, and global expansion with data, backed by accuracy.
By factoring in the projected importer demand gap that is currently unmet and could be potential opportunity, it identifies the potential for the Exporter (Country) among 190 countries, against the general trade analysis, which identifies the biggest importer or exporter.
To discover high-growth global markets and optimize your business strategy:
Click Here
Pricing
- Single User License$ 1,995
- Department License$ 2,400
- Site License$ 3,120
- Global License$ 3,795

Leadership Perspectives from Industry Events
Search
Thought Leadership and Analyst Meet


Our Clients
6WResearch In News
- India Air Conditioner Market Set for Strong Rebound in 2026 After Weather-Led Correction and GST-Driven Recovery: 6Wresearch
- ADAS in India: How Automatic Emergency Braking, Blind Spot Detection & Driver Monitoring are Transforming Road Safety
- Doha a strategic location for EV manufacturing hub: IPA Qatar
- Demand for luxury TVs surging in the GCC, says Samsung
- Empowering Growth: The Thriving Journey of Bangladesh’s Cable Industry
- Demand for luxury TVs surging in the GCC, says Samsung
Latest Reports
- Poland Fire Protection Systems Market (2026-2032)
- Cape Verde Portable Hand-Thrown Extinguisher Market (2026-2032)
- Canada Portable Hand-Thrown Extinguisher Market (2026-2032)
- Cameroon Portable Hand-Thrown Extinguisher Market (2026-2032)
- Burundi Portable Hand-Thrown Extinguisher Market (2026-2032)
- Burkina Faso Portable Hand-Thrown Extinguisher Market (2026-2032)
- Bulgaria Portable Hand-Thrown Extinguisher Market (2026-2032)
- Brunei Portable Hand-Thrown Extinguisher Market (2026-2032)
- Botswana Portable Hand-Thrown Extinguisher Market (2026-2032)
- Bosnia and Herzegovina Portable Hand-Thrown Extinguisher Market (2026-2032)
Industry Events and Analyst Meet

HIMTEX 2026

India Refining Summit 2026

India EV Show 2026

EV tech India Expo 2026

Auto Tech Asia 2026
Whitepaper
- Middle East & Africa Commercial Security Market Click here to view more.
- Middle East & Africa Fire Safety Systems & Equipment Market Click here to view more.
- GCC Drone Market Click here to view more.
- Middle East Lighting Fixture Market Click here to view more.
- GCC Physical & Perimeter Security Market Click here to view more.