Australia Cork Products Market (2026-2032) | Trends, Analysis, Companies, Forecast, Value, Share, Revenue, Outlook, Size, Growth & Industry
Market Forecast By Type (Natural Cork, Colorful Cork), By Applications (Commercial, Residential, Industrial, Consumer Goods) And Competitive Landscape
| Product Code: ETC029095 | Publication Date: Oct 2020 | Updated Date: Jun 2026 | Product Type: Report | |
| Publisher: 6Wresearch | Author: Ravi Bhandari | No. of Pages: 70 | No. of Figures: 35 | No. of Tables: 5 |
Australia Cork Products Market Summary
The australia cork products market was estimated at USD 151 Million in 2025 and is projected to reach USD 178 Million by 2032, growing at a CAGR of 3.0% from 2026 to 2032.
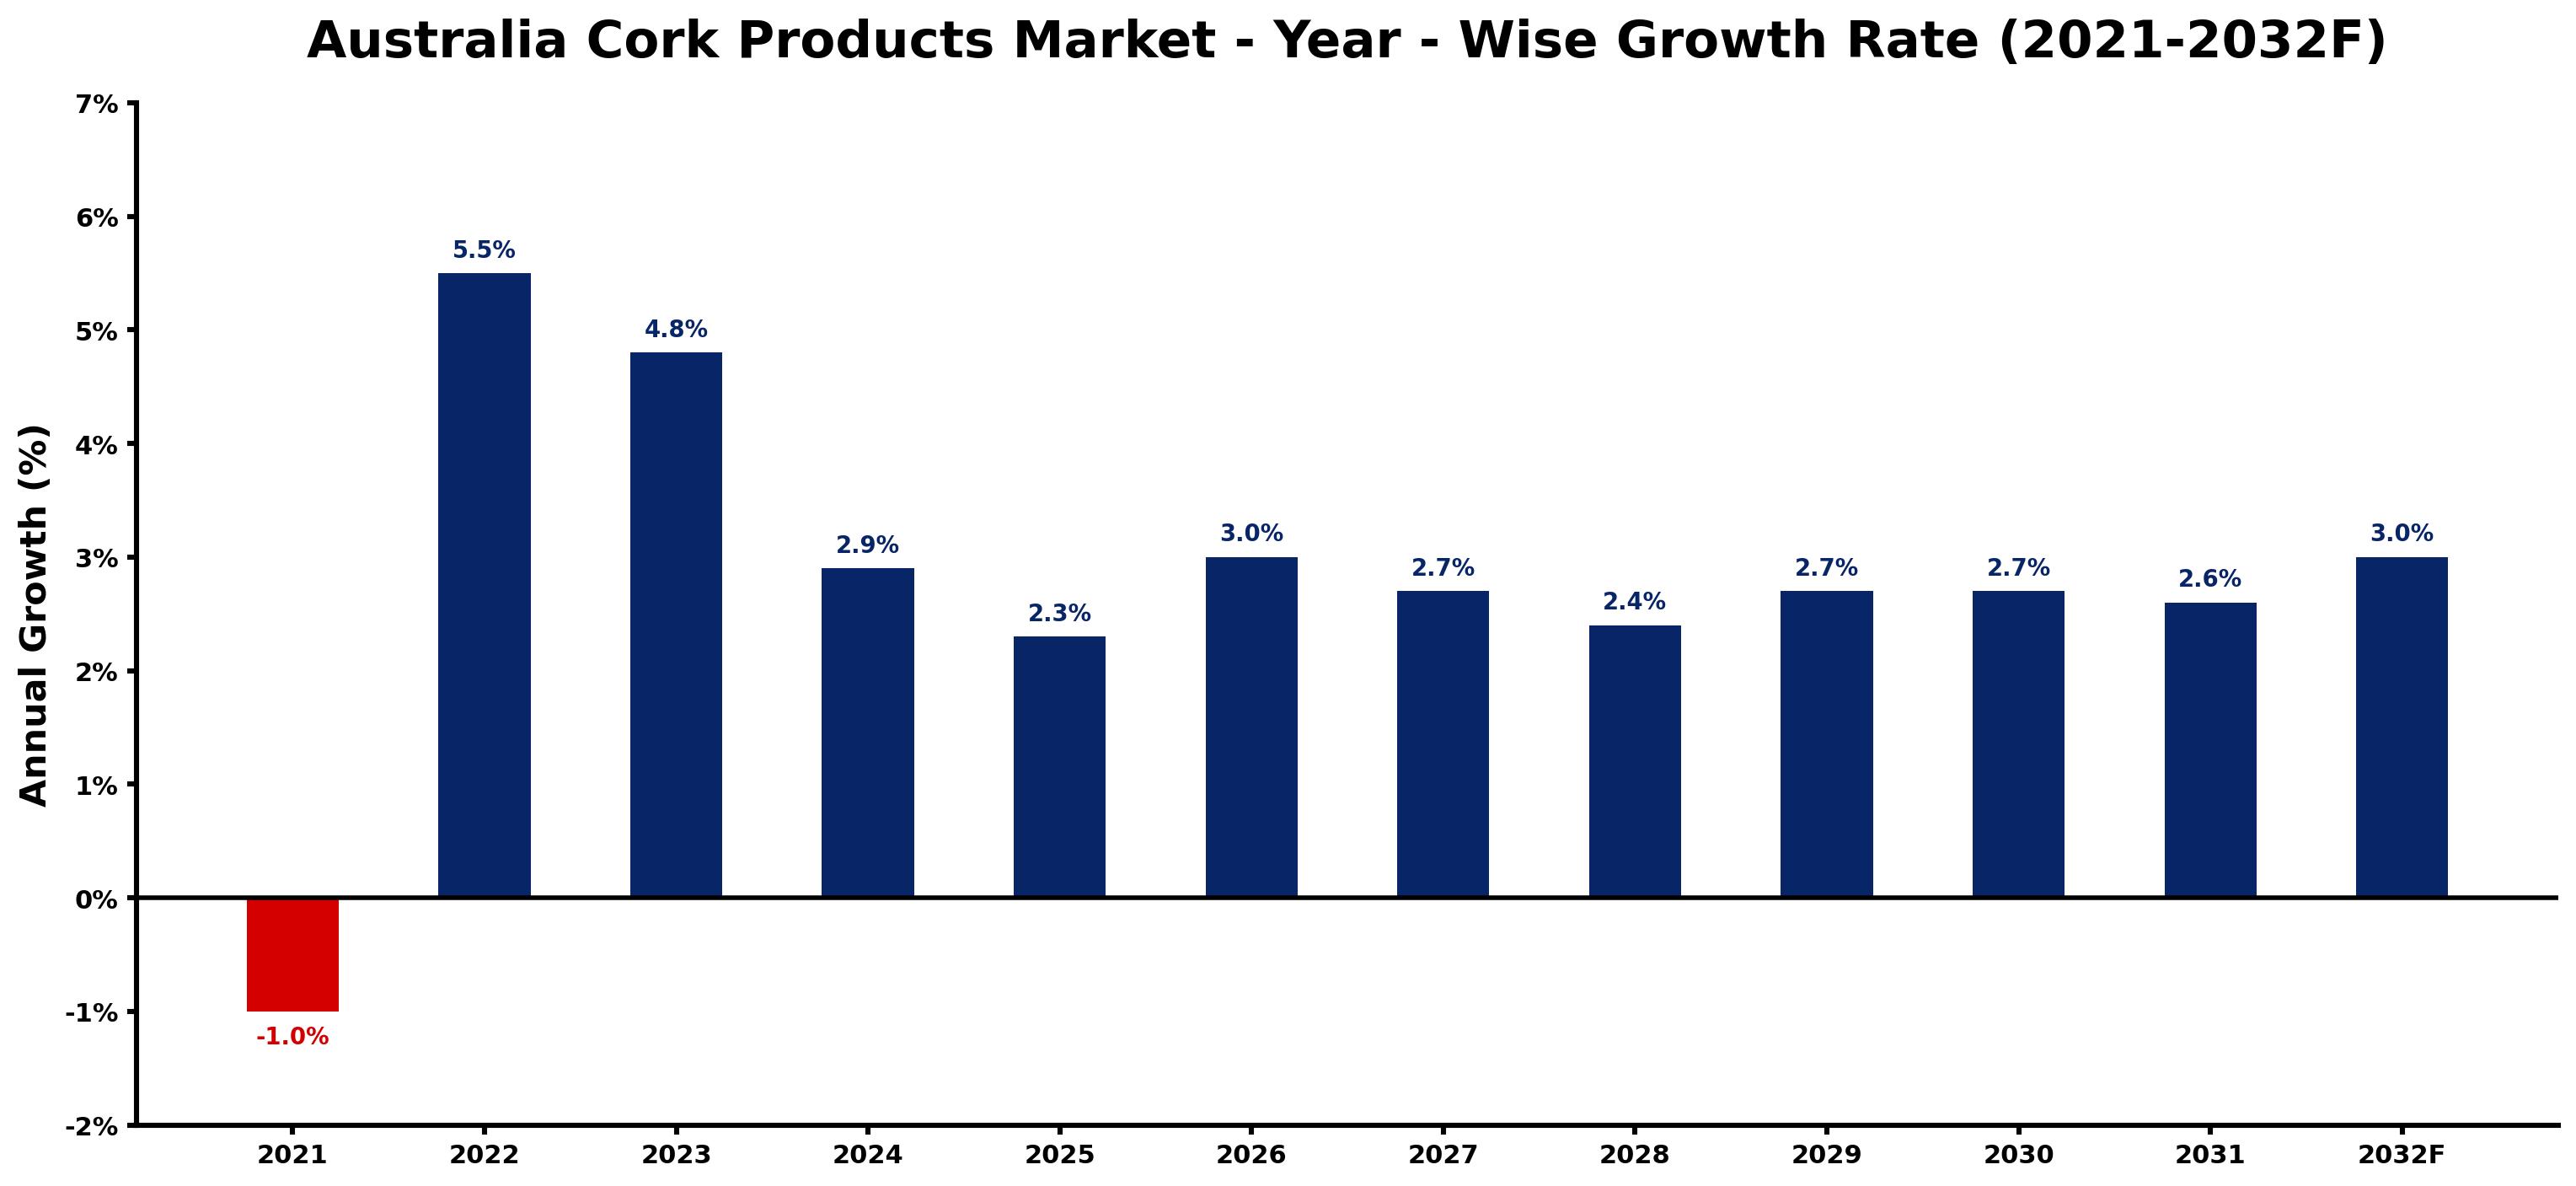
Australia Cork Products Market Growth Rate Analysis (2021-2032)
The Australian cork products market has shown a remarkable recovery since a decline of 1.0% in 2021. Driven by a surge in consumer demand for sustainable and eco-friendly materials, the market rebounded to a growth of 5.5% in 2022. Continued investment in infrastructure and heightened awareness of environmental issues are propelling growth forward, albeit at a moderated pace of 4.8% in 2023 and projections of around 2.9% in 2024. While growth stabilizes to between 2.4% and 3.0% by 2032, the positive trend reflects rising applications in the building and construction sectors, buoyed by technological advancements and the ongoing energy transition in Australia.
Australia Cork Products Market Year-wise Growth Rate and Key Drivers
This graph highlights how the Australia Cork Products Market has steadily grown over the past five years, supported by major growth factors.
The table below presents the year wise growth rates along with the key drivers influencing the market
| Year | Growth Rate | Major Drivers |
| 2021 | -1.0% | Heightened environmental concerns led to reduced demand for natural cork materials in packaging solutions. |
| 2022 | 5.5% | Local manufacturing partnerships emerged, boosting supply chain resilience across Australia. |
| 2023 | 4.8% | Sustainable building practices gained traction, favoring cork over traditional materials significantly. |
| 2024 | 2.9% | E-commerce platforms expanded, making cork products more accessible to urban consumers. |
| 2025 | 2.3% | Construction sector recovery highlighted the benefits of lightweight cork insulation materials. |
| 2026 | 3.0% | Innovations in cork design attracted attention in home decor and furniture markets. |
| 2027 | 2.7% | Health and wellness trends drove interest in cork's natural antimicrobial properties among buyers. |
| 2028 | 2.4% | Increased awareness of plastic pollution transformed consumer preferences toward sustainable alternatives. |
| 2029 | 2.7% | Collaborations between designers and cork producers sparked creative, eye-catching product lines. |
| 2030 | 2.7% | Circular economy principles began influencing manufacturers, promoting cork recycling initiatives. |
| 2031 | 2.6% | Investments in sustainable forestry practices enhanced brand trust and consumer loyalty. |
| 2032 | 3.0% | Emerging technologies for cork processing improved efficiency, reducing production costs significantly. |
Note - Market size estimations and growth projections presented in this report are based on 6Wresearch's advanced forecasting approach, validated with industry datasets as of June 2026.
Australia Cork Products Market Synopsis
The Australia Cork Products Market is projected to reach 3.0% and witness significant growth during the forecast period (2026-2032). This market represents a diverse array of products made from cork, a natural and sustainable material derived from the bark of cork oak trees. Key products within this sector include wine stoppers, flooring, wall tiles, insulation materials, and an assortment of fashion accessories. The increasing demand for eco-friendly materials, driven by heightened environmental awareness, is a primary catalyst for expansion in this segment.
Australia Cork Products Market Growth Drivers
Several key drivers are propelling the growth of the Australia Cork Products Market. The emphasis on sustainable practices has led to an escalation in the demand for cork-based products, which are recognized for their renewable properties. Notable growth drivers include:
- The rising consumer consciousness regarding environmentally sustainable products enhances the attractiveness of cork as a choice for packaging and home décor.
- Advancements in cork processing technologies improve the quality and range of cork products available to consumers, increasing market appeal.
- The versatility of cork allows its use in various applications, from traditional wine stoppers to modern fashion accessories, broadening its market reach.
- Corporate sustainability initiatives have prompted businesses to adopt cork as a viable alternative to synthetic materials, bolstering demand.
- Initiatives to reduce plastic usage contribute to a growing preference for cork products, which naturally align with eco-conscious consumer behavior.
Australia Cork Products Market Trends and Opportunities
The Australia Cork Products Market is witnessing specific trends that present extensive opportunities. An increase in the popularity of cork flooring and wall tiles reflects changing consumer preferences towards natural aesthetics in interior design. Noteworthy trends include:
- The growing trend towards minimalism and sustainability in home design encourages the adoption of cork as a stylish and eco-friendly flooring option.
- Innovations in product design and functionality of cork accessories cater to a broader demographic, promoting cork as a fashionable choice.
- Consumer education about the environmental benefits of cork leads to an increase in demand for cork-based alternatives across various sectors.
- Partnerships between environmental organizations and businesses advocating for sustainable materials further emphasize cork's role in promoting ecological conservation.
- The expansion of e-commerce platforms provides increased accessibility to cork products, facilitating market growth and reaching untapped customer segments.
Australia Cork Products Market Challenges and Restraints
Despite the promising growth of the Australia Cork Products Market, several challenges and restraints must be acknowledged. These include:
- Competition from synthetic alternatives, such as plastics and aluminum, often present lower manufacturing costs, thereby impacting cork's market share.
- Consumer preferences shifting towards high-performance materials can challenge the position of cork in certain applications where alternatives may offer better durability or functionality.
- Environmental concerns regarding deforestation and habitat preservation continue to pose challenges; sustainable harvesting practices must be prioritized.
- Market players need to continuously innovate to meet evolving consumer preferences and trends, necessitating ongoing investment in research and development.
- Fluctuations in the availability of cork due to climate conditions and its sustainable harvesting can restrict supply, impacting market dynamics.
Australia Cork Products Market Government Investment and Initiatives
Government policies play a crucial role in shaping the Australia Cork Products Market. Several initiatives focus on sustainable forestry management and conservation efforts that directly impact this market. Significant aspects include:
- Regulations governing the harvesting of cork oak trees ensure sustainable practices, balancing economic interests with environmental conservation.
- Government initiatives promoting eco-friendly materials contribute to increased research and development funding for cork processing technologies.
- Support for public awareness campaigns regarding the benefits of cork aligns with national strategies aiming to reduce plastic waste and promote renewable resources.
- Investment in the development of infrastructure to facilitate the processing and distribution of cork products enhances market accessibility.
- Collaboration between government bodies and industry stakeholders focuses on creating standards that bolster the quality and sustainability of cork products.
Australia Cork Products Market Latest Developments (May 2025 - June 2026)
Recent developments in the Australia Cork Products Market highlight a trend towards innovation and increased consumer awareness. Industry stakeholders are focusing on expanding their product lines to meet growing demand for sustainable options. Notable movements during this period include:
- Emerging collaborations between companies and research institutions aim to enhance cork processing capabilities, leading to improved product quality and diversification.
- The market has seen rising consumer interest in cork-based home décor, with several brands launching eco-friendly furniture and accessories that leverage the natural appeal of cork.
- Regulatory changes advocating for sustainable packaging solutions have prompted more businesses to incorporate cork into their product offerings.
- Heightened educational campaigns aimed at informing consumers about the benefits of cork have been evident, bolstering market demand.
- Investment initiatives targeted toward sustainable forestry practices have gained traction, promoting a shift towards more responsible sourcing of cork materials.
Australia Cork Products Market - Key Attractiveness of the Report
- 10 Years of Market Numbers
- Historical Data Starting from 2022 to 2025
- Base Year: 2025
- Forecast Data until 2032
- Key Performance Indicators Impacting the Market
- Major Upcoming Developments and Projects
Key Highlights of the Report:
- Australia Cork Products Market Outlook
- Market Size of Australia Cork Products Market, 2025
- Forecast of Australia Cork Products Market, 2032
- Historical Data and Forecast of Australia Cork Products Revenues & Volume for the Period 2022-2032F
- Australia Cork Products Market Trend Evolution
- Australia Cork Products Market Drivers and Challenges
- Australia Cork Products Price Trends
- Australia Cork Products Porter's Five Forces
- Australia Cork Products Industry Life Cycle
- Historical Data and Forecast of Australia Cork Products Market Revenues & Volume By Type for the Period 2022-2032F
- Historical Data and Forecast of Australia Cork Products Market Revenues & Volume By Natural Cork for the Period 2022-2032F
- Historical Data and Forecast of Australia Cork Products Market Revenues & Volume By Colorful Cork for the Period 2022-2032F
- Historical Data and Forecast of Australia Cork Products Market Revenues & Volume By Applications for the Period 2022-2032F
- Historical Data and Forecast of Australia Cork Products Market Revenues & Volume By Commercial for the Period 2022-2032F
- Historical Data and Forecast of Australia Cork Products Market Revenues & Volume By Residential for the Period 2022-2032F
- Historical Data and Forecast of Australia Cork Products Market Revenues & Volume By Industrial for the Period 2022-2032F
- Historical Data and Forecast of Australia Cork Products Market Revenues & Volume By Consumer Goods for the Period 2022-2032F
- Australia Cork Products Import Export Trade Statistics
- Market Opportunity Assessment By Type
- Market Opportunity Assessment By Applications
- Australia Cork Products Top Companies Market Share
- Australia Cork Products Competitive Benchmarking By Technical and Operational Parameters
- Australia Cork Products Company Profiles
- Australia Cork Products Key Strategic Recommendations
Frequently Asked Questions About the Market Study (FAQs):
The growth is primarily driven by an increasing demand for eco-friendly materials, advancements in cork processing technologies, and a shift towards sustainable practices among consumers and businesses.
Government policy influences the market through regulations promoting sustainable harvesting, public awareness initiatives advocating for cork's environmental benefits, and support for research and development in cork processing technologies.
The market faces challenges from competition with synthetic materials, variations in consumer preferences, and the necessity for ongoing innovation to remain relevant in a changing landscape.
Recent trends include a growing demand for cork-based home décor products, increased consumer education about sustainability, and investments in processing and infrastructure to enhance product availability.
6Wresearch actively monitors the Australia Cork Products Market and publishes its comprehensive annual report, highlighting emerging trends, growth drivers, revenue analysis, and forecast outlook. Our insights help businesses to make data-backed strategic decisions with ongoing market dynamics. Our analysts track relevent industries related to the Australia Cork Products Market, allowing our clients with actionable intelligence and reliable forecasts tailored to emerging regional needs.
Yes, we provide customisation as per your requirements. To learn more, feel free to contact us on sales@6wresearch.com
1 Executive Summary |
2 Introduction |
2.1 Key Highlights of the Report |
2.2 Report Description |
2.3 Market Scope & Segmentation |
2.4 Research Methodology |
2.5 Assumptions |
3 Australia Cork Products Market Overview |
3.1 Australia Country Macro Economic Indicators |
3.2 Australia Cork Products Market Revenues & Volume, 2022 & 2032F |
3.3 Australia Cork Products Market - Industry Life Cycle |
3.4 Australia Cork Products Market - Porter's Five Forces |
3.5 Australia Cork Products Market Revenues & Volume Share, By Type, 2022 & 2032F |
3.6 Australia Cork Products Market Revenues & Volume Share, By Applications, 2022 & 2032F |
4 Australia Cork Products Market Dynamics |
4.1 Impact Analysis |
4.2 Market Drivers |
4.2.1 Increasing consumer awareness about sustainable and eco-friendly products |
4.2.2 Growing demand for renewable and biodegradable materials in various industries |
4.2.3 Rising focus on reducing carbon footprint and environmental impact |
4.3 Market Restraints |
4.3.1 Competition from alternative materials such as plastic, metal, and synthetic materials |
4.3.2 Fluctuations in raw material prices impacting production costs |
4.3.3 Limited availability of cork forests and potential environmental concerns related to deforestation |
5 Australia Cork Products Market Trends |
6 Australia Cork Products Market, By Types |
6.1 Australia Cork Products Market, By Type |
6.1.1 Overview and Analysis |
6.1.2 Australia Cork Products Market Revenues & Volume, By Type, 2022-2032F |
6.1.3 Australia Cork Products Market Revenues & Volume, By Natural Cork, 2022-2032F |
6.1.4 Australia Cork Products Market Revenues & Volume, By Colorful Cork, 2022-2032F |
6.2 Australia Cork Products Market, By Applications |
6.2.1 Overview and Analysis |
6.2.2 Australia Cork Products Market Revenues & Volume, By Commercial, 2022-2032F |
6.2.3 Australia Cork Products Market Revenues & Volume, By Residential, 2022-2032F |
6.2.4 Australia Cork Products Market Revenues & Volume, By Industrial, 2022-2032F |
6.2.5 Australia Cork Products Market Revenues & Volume, By Consumer Goods, 2022-2032F |
7 Australia Cork Products Market Import-Export Trade Statistics |
7.1 Australia Cork Products Market Export to Major Countries |
7.2 Australia Cork Products Market Imports from Major Countries |
8 Australia Cork Products Market Key Performance Indicators |
8.1 Percentage of product offerings using cork material in different industries |
8.2 Number of partnerships with sustainability-focused brands or organizations |
8.3 Percentage of consumers willing to pay a premium for eco-friendly products |
9 Australia Cork Products Market - Opportunity Assessment |
9.1 Australia Cork Products Market Opportunity Assessment, By Type, 2022 & 2032F |
9.2 Australia Cork Products Market Opportunity Assessment, By Applications, 2022 & 2032F |
10 Australia Cork Products Market - Competitive Landscape |
10.1 Australia Cork Products Market Revenue Share, By Companies, 2025 |
10.2 Australia Cork Products Market Competitive Benchmarking, By Operating and Technical Parameters |
11 Company Profiles |
12 Recommendations |
13 Disclaimer |
Global Go To Market Strategy - 2030
Export potential enables firms to identify high-growth global markets with greater confidence by combining advanced trade intelligence with a structured quantitative methodology. The framework analyzes emerging demand trends and country-level import patterns while integrating macroeconomic and trade datasets such as GDP and population forecasts, bilateral import–export flows, tariff structures, elasticity differentials between developed and developing economies, geographic distance, and import demand projections. Using weighted trade values from 2020–2024 as the base period to project country-to-country export potential for 2030, these inputs are operationalized through calculated drivers such as gravity model parameters, tariff impact factors, and projected GDP per-capita growth. Through an analysis of hidden potentials, demand hotspots, and market conditions that are most favorable to success, this method enables firms to focus on target countries, maximize returns, and global expansion with data, backed by accuracy.
By factoring in the projected importer demand gap that is currently unmet and could be potential opportunity, it identifies the potential for the Exporter (Country) among 190 countries, against the general trade analysis, which identifies the biggest importer or exporter.
To discover high-growth global markets and optimize your business strategy:
Click Here
Pricing
- Single User License$ 1,995
- Department License$ 2,400
- Site License$ 3,120
- Global License$ 3,795

Leadership Perspectives from Industry Events
Search
Thought Leadership and Analyst Meet


Our Clients
6WResearch In News
- India Air Conditioner Market Set for Strong Rebound in 2026 After Weather-Led Correction and GST-Driven Recovery: 6Wresearch
- ADAS in India: How Automatic Emergency Braking, Blind Spot Detection & Driver Monitoring are Transforming Road Safety
- Doha a strategic location for EV manufacturing hub: IPA Qatar
- Demand for luxury TVs surging in the GCC, says Samsung
- Empowering Growth: The Thriving Journey of Bangladesh’s Cable Industry
- Demand for luxury TVs surging in the GCC, says Samsung
Latest Reports
- Nicaragua RPG Gaming Market (2026-2032)
- New Zealand RPG Gaming Market (2026-2032)
- Netherlands RPG Gaming Market (2026-2032)
- Nauru RPG Gaming Market (2026-2032)
- Namibia RPG Gaming Market (2026-2032)
- Mozambique RPG Gaming Market (2026-2032)
- Montenegro RPG Gaming Market (2026-2032)
- Mongolia RPG Gaming Market (2026-2032)
- Monaco RPG Gaming Market (2026-2032)
- Micronesia RPG Gaming Market (2026-2032)
Industry Events and Analyst Meet

HIMTEX 2026

India Refining Summit 2026

India EV Show 2026

EV tech India Expo 2026

Auto Tech Asia 2026
Whitepaper
- Middle East & Africa Commercial Security Market Click here to view more.
- Middle East & Africa Fire Safety Systems & Equipment Market Click here to view more.
- GCC Drone Market Click here to view more.
- Middle East Lighting Fixture Market Click here to view more.
- GCC Physical & Perimeter Security Market Click here to view more.