Australia Edible Beans Market (2026-2032) Outlook | Analysis, Industry, Forecast, Companies, Value, Revenue, Growth, Size, Trends & Share
Market Forecast By Product Type (Pinto Beans, Navy Beans, Great Northern Beans, Red Kidney Beans, Black Beans, Yellow Beans, Others), By Distribution Channel (Supermarket/Hypermarket, Online Stores, Specialty Stores, Other), By Application (Household, Restaurants, Others) And Competitive Landscape
| Product Code: ETC290915 | Publication Date: Aug 2022 | Updated Date: Mar 2026 | Product Type: Market Research Report | |
| Publisher: 6Wresearch | Author: Shubham Padhi | No. of Pages: 75 | No. of Figures: 35 | No. of Tables: 20 |
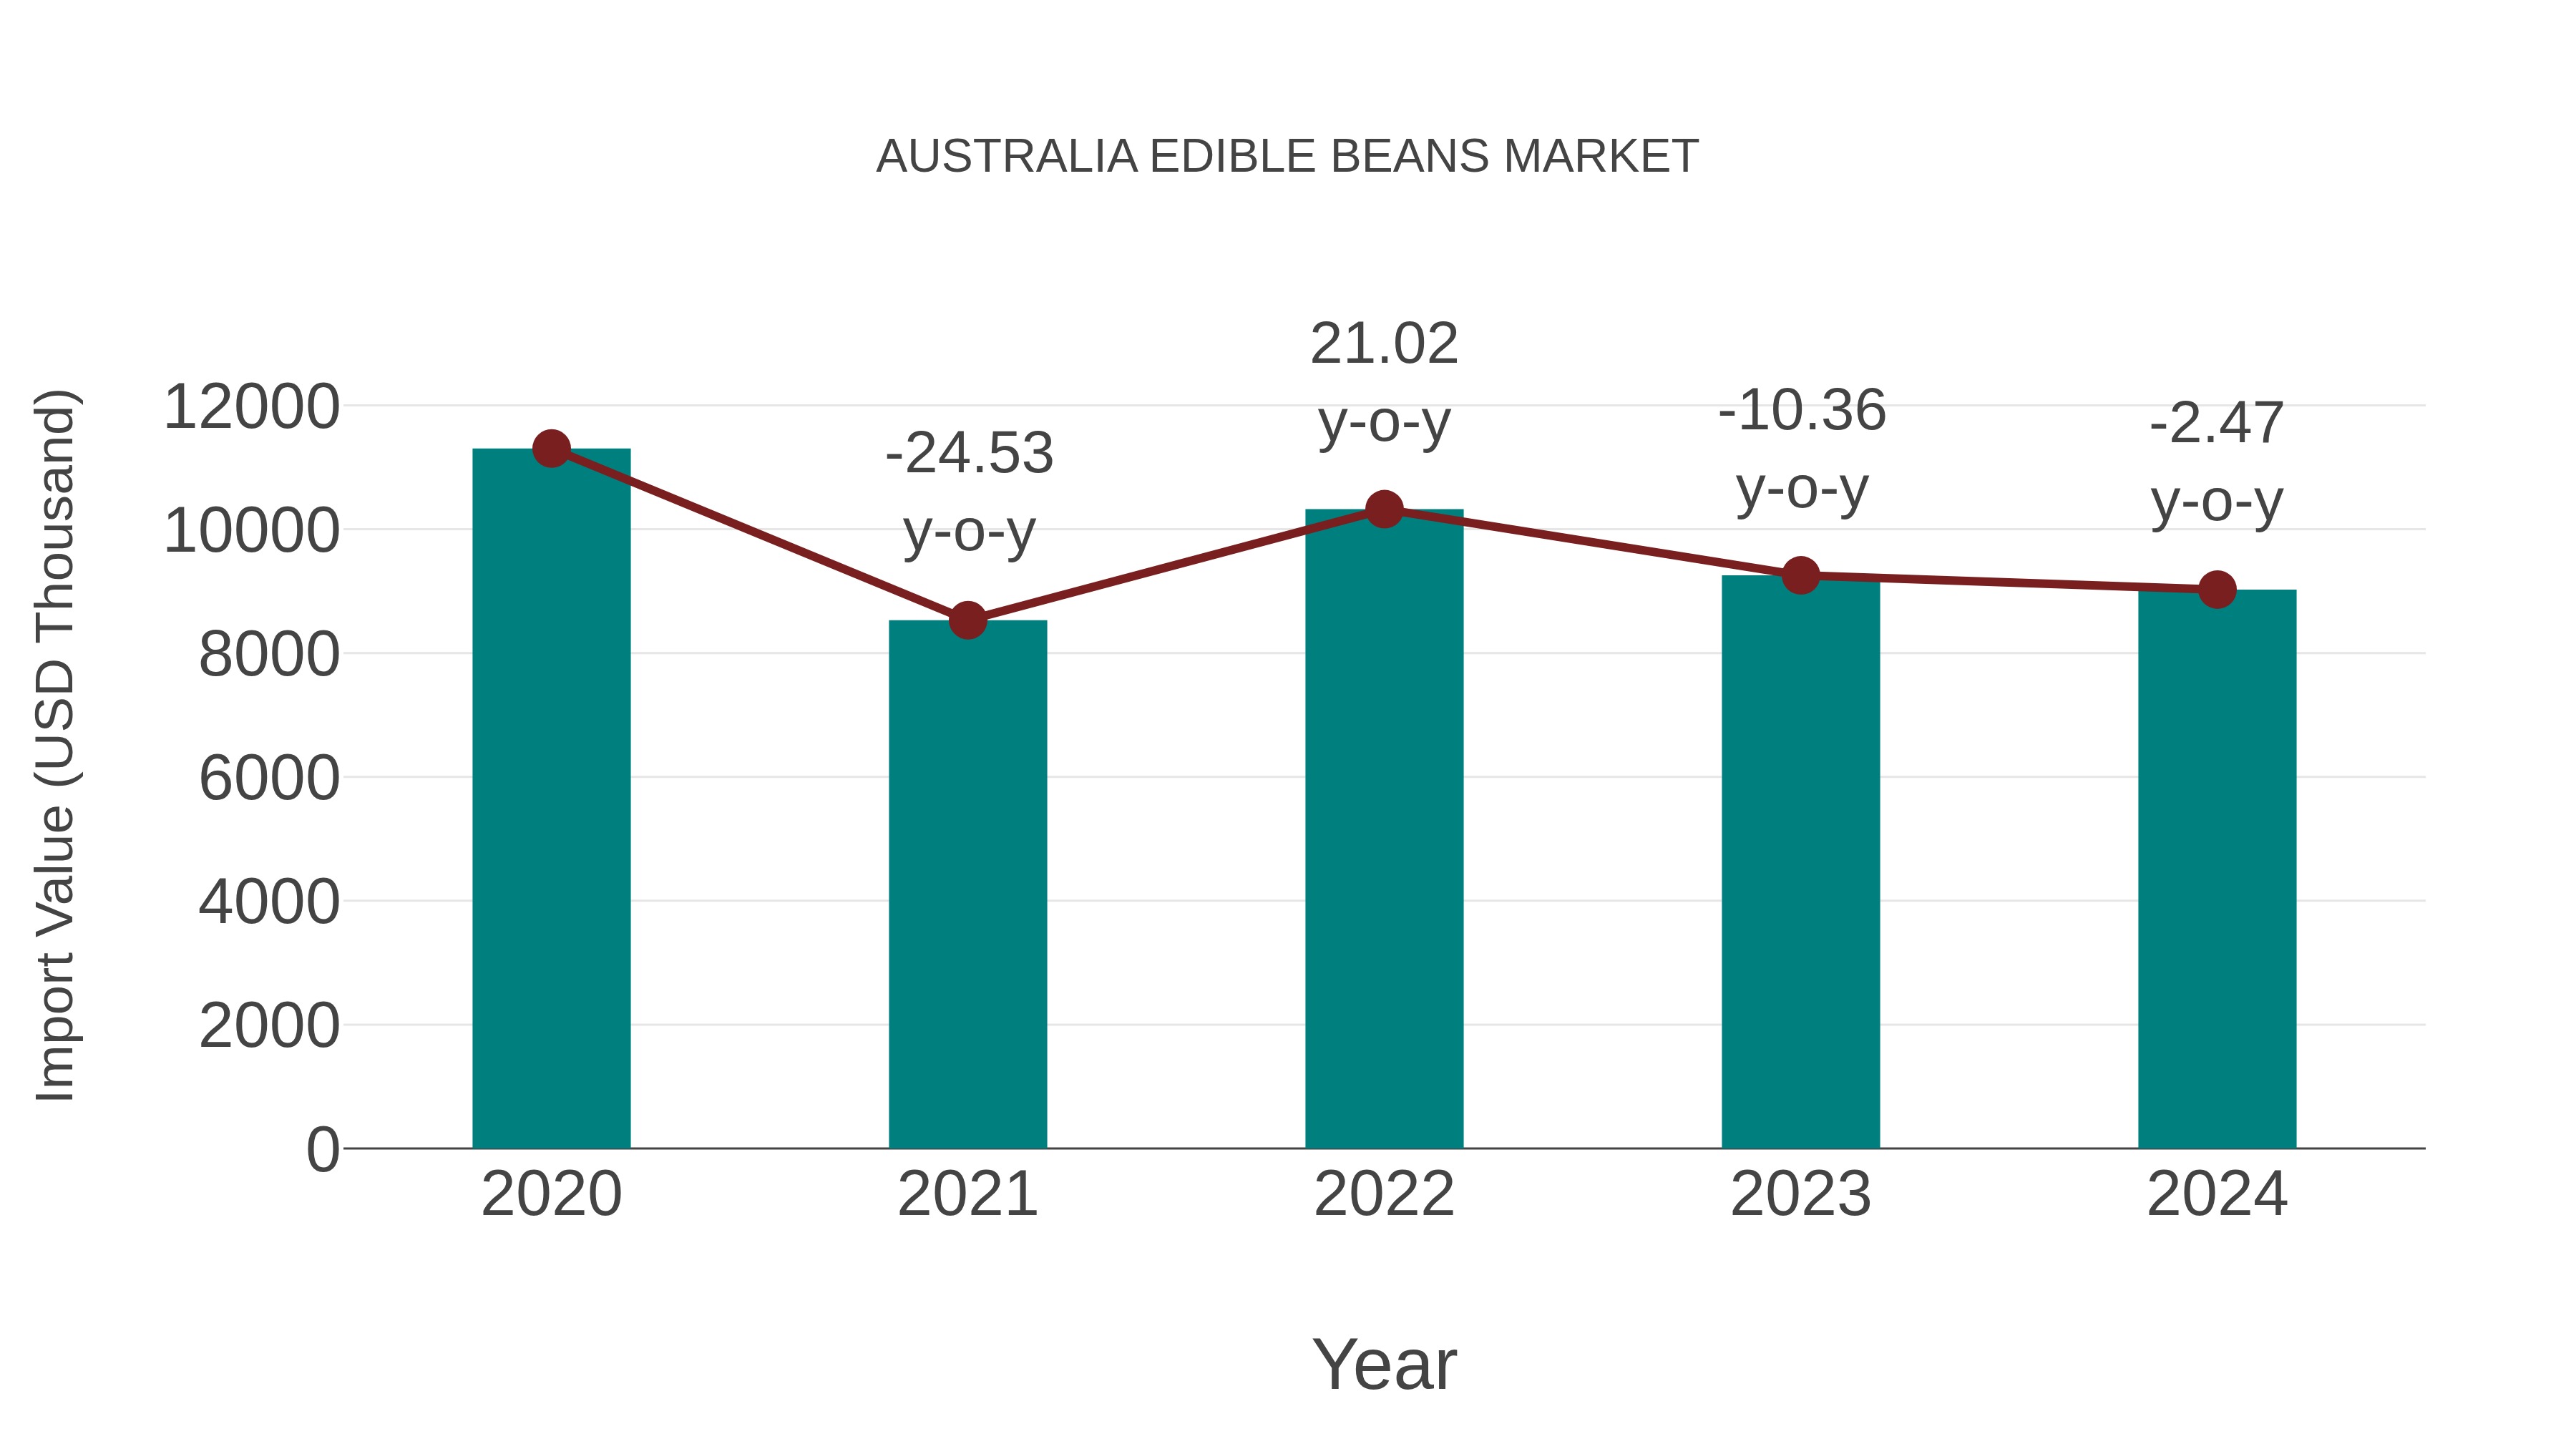
Australia Edible Beans Market: Import Trend Analysis
In the Australia edible beans market, the import trend experienced a decline from 2023 to 2024, with a growth rate of -2.47%. The compound annual growth rate (CAGR) for imports over the period 2020-2024 stood at -5.47%. This decline may be attributed to shifting consumer preferences, changes in trade policies, or market saturation affecting import momentum.
Australia Edible Beans Market Overview
Australia edible beans market encompasses a wide range of legumes that are valued for their nutritional content and culinary versatility. Edible beans such as kidney beans, chickpeas, and lentils are staples in many Australia households and are widely used in diverse cuisines. The market is influenced by factors such as shifting dietary preferences, health consciousness, and the growing popularity of plant-based protein sources. Australia farmers and food manufacturers are capitalizing on the demand for edible beans by expanding cultivation areas, implementing sustainable farming practices, and introducing innovative bean-based food products to cater to evolving consumer tastes.
Drivers of the market
The edible beans market in Australia is experiencing significant growth driven by several factors shaping consumer behavior and industry dynamics. One of the primary drivers is the increasing recognition of beans as a versatile and nutritious food ingredient. Beans are rich in protein, fiber, vitamins, and minerals, making them an essential component of a healthy diet. Moreover, the growing trend towards plant-based diets and vegetarianism is fueling the demand for beans as a meat substitute and protein source among health-conscious consumers. Additionally, the rising awareness of the environmental and sustainability implications of food production is driving consumers to seek out plant-based protein alternatives like beans, which have a lower carbon footprint compared to animal-based proteins. Furthermore, the versatility of beans in culinary applications, ranging from salads and soups to snacks and desserts, is expanding their market appeal and driving innovation in product development and marketing strategies.
Challenges of the market
The Australia edible beans market faces various challenges that impact its competitiveness and growth prospects. One notable challenge is the susceptibility of bean crops to adverse weather conditions, such as droughts, floods, and extreme temperatures, which can significantly affect yield and quality. Mitigating these weather-related risks requires investment in resilient farming practices, irrigation systems, and crop insurance schemes. Additionally, managing market volatility and price fluctuations in response to global supply and demand dynamics poses a challenge for bean growers and traders. Moreover, ensuring consistent quality standards and compliance with food safety regulations throughout the supply chain presents logistical and operational challenges for stakeholders in the edible beans market.
Government Policy of the market
Australia agricultural policies play a significant role in shaping the dynamics of the edible beans market. The government`s support for sustainable farming practices and research and development initiatives has led to advancements in bean cultivation techniques and varietal improvement. Moreover, trade agreements and market access negotiations facilitate the export of Australia beans to international markets, thereby expanding opportunities for domestic producers. The government also provides assistance programs and subsidies to farmers to enhance productivity and mitigate risks associated with bean cultivation. By fostering a conducive regulatory environment and promoting innovation in the agricultural sector, the government aims to strengthen the position of Australia beans in both domestic and global markets.
Key Highlights of the Report:
- Australia Edible Beans Market Outlook
- Market Size of Australia Edible Beans Market, 2025
- Forecast of Australia Edible Beans Market, 2032
- Historical Data and Forecast of Australia Edible Beans Revenues & Volume for the Period 2022-2032F
- Australia Edible Beans Market Trend Evolution
- Australia Edible Beans Market Drivers and Challenges
- Australia Edible Beans Price Trends
- Australia Edible Beans Porter's Five Forces
- Australia Edible Beans Industry Life Cycle
- Historical Data and Forecast of Australia Edible Beans Market Revenues & Volume By Product Type for the Period 2022-2032F
- Historical Data and Forecast of Australia Edible Beans Market Revenues & Volume By Pinto Beans for the Period 2022-2032F
- Historical Data and Forecast of Australia Edible Beans Market Revenues & Volume By Navy Beans for the Period 2022-2032F
- Historical Data and Forecast of Australia Edible Beans Market Revenues & Volume By Great Northern Beans for the Period 2022-2032F
- Historical Data and Forecast of Australia Edible Beans Market Revenues & Volume By Red Kidney Beans for the Period 2022-2032F
- Historical Data and Forecast of Australia Edible Beans Market Revenues & Volume By Black Beans for the Period 2022-2032F
- Historical Data and Forecast of Australia Edible Beans Market Revenues & Volume By Yellow Beans for the Period 2022-2032F
- Historical Data and Forecast of Australia Edible Beans Market Revenues & Volume By Others for the Period 2022-2032F
- Historical Data and Forecast of Australia Edible Beans Market Revenues & Volume By Distribution Channel for the Period 2022-2032F
- Historical Data and Forecast of Australia Edible Beans Market Revenues & Volume By Supermarket/Hypermarket for the Period 2022-2032F
- Historical Data and Forecast of Australia Edible Beans Market Revenues & Volume By Online Stores for the Period 2022-2032F
- Historical Data and Forecast of Australia Edible Beans Market Revenues & Volume By Specialty Stores for the Period 2022-2032F
- Historical Data and Forecast of Australia Edible Beans Market Revenues & Volume By Other for the Period 2022-2032F
- Historical Data and Forecast of Australia Edible Beans Market Revenues & Volume By Application for the Period 2022-2032F
- Historical Data and Forecast of Australia Edible Beans Market Revenues & Volume By Household for the Period 2022-2032F
- Historical Data and Forecast of Australia Edible Beans Market Revenues & Volume By Restaurants for the Period 2022-2032F
- Historical Data and Forecast of Australia Edible Beans Market Revenues & Volume By Others for the Period 2022-2032F
- Australia Edible Beans Import Export Trade Statistics
- Market Opportunity Assessment By Product Type
- Market Opportunity Assessment By Distribution Channel
- Market Opportunity Assessment By Application
- Australia Edible Beans Top Companies Market Share
- Australia Edible Beans Competitive Benchmarking By Technical and Operational Parameters
- Australia Edible Beans Company Profiles
- Australia Edible Beans Key Strategic Recommendations
Australia Edible Beans Market (2026-2032): FAQs
6Wresearch actively monitors the Australia Edible Beans Market and publishes its comprehensive annual report, highlighting emerging trends, growth drivers, revenue analysis, and forecast outlook. Our insights help businesses to make data-backed strategic decisions with ongoing market dynamics. Our analysts track relevent industries related to the Australia Edible Beans Market, allowing our clients with actionable intelligence and reliable forecasts tailored to emerging regional needs.
Yes, we provide customisation as per your requirements. To learn more, feel free to contact us on sales@6wresearch.com
1 Executive Summary |
2 Introduction |
2.1 Key Highlights of the Report |
2.2 Report Description |
2.3 Market Scope & Segmentation |
2.4 Research Methodology |
2.5 Assumptions |
3 Australia Edible Beans Market Overview |
3.1 Australia Country Macro Economic Indicators |
3.2 Australia Edible Beans Market Revenues & Volume, 2022 & 2032F |
3.3 Australia Edible Beans Market - Industry Life Cycle |
3.4 Australia Edible Beans Market - Porter's Five Forces |
3.5 Australia Edible Beans Market Revenues & Volume Share, By Product Type, 2022 & 2032F |
3.6 Australia Edible Beans Market Revenues & Volume Share, By Distribution Channel, 2022 & 2032F |
3.7 Australia Edible Beans Market Revenues & Volume Share, By Application, 2022 & 2032F |
4 Australia Edible Beans Market Dynamics |
4.1 Impact Analysis |
4.2 Market Drivers |
4.2.1 Increasing awareness about health benefits associated with consuming edible beans |
4.2.2 Growing demand for plant-based protein sources |
4.2.3 Rising adoption of vegetarian and vegan diets in Australia |
4.3 Market Restraints |
4.3.1 Fluctuations in crop yields due to weather conditions |
4.3.2 Price volatility in the global edible beans market |
4.3.3 Competition from alternative protein sources such as soybeans and lentils |
5 Australia Edible Beans Market Trends |
6 Australia Edible Beans Market, By Types |
6.1 Australia Edible Beans Market, By Product Type |
6.1.1 Overview and Analysis |
6.1.2 Australia Edible Beans Market Revenues & Volume, By Product Type, 2022-2032F |
6.1.3 Australia Edible Beans Market Revenues & Volume, By Pinto Beans, 2022-2032F |
6.1.4 Australia Edible Beans Market Revenues & Volume, By Navy Beans, 2022-2032F |
6.1.5 Australia Edible Beans Market Revenues & Volume, By Great Northern Beans, 2022-2032F |
6.1.6 Australia Edible Beans Market Revenues & Volume, By Red Kidney Beans, 2022-2032F |
6.1.7 Australia Edible Beans Market Revenues & Volume, By Black Beans, 2022-2032F |
6.1.8 Australia Edible Beans Market Revenues & Volume, By Yellow Beans, 2022-2032F |
6.2 Australia Edible Beans Market, By Distribution Channel |
6.2.1 Overview and Analysis |
6.2.2 Australia Edible Beans Market Revenues & Volume, By Supermarket/Hypermarket, 2022-2032F |
6.2.3 Australia Edible Beans Market Revenues & Volume, By Online Stores, 2022-2032F |
6.2.4 Australia Edible Beans Market Revenues & Volume, By Specialty Stores, 2022-2032F |
6.2.5 Australia Edible Beans Market Revenues & Volume, By Other, 2022-2032F |
6.3 Australia Edible Beans Market, By Application |
6.3.1 Overview and Analysis |
6.3.2 Australia Edible Beans Market Revenues & Volume, By Household, 2022-2032F |
6.3.3 Australia Edible Beans Market Revenues & Volume, By Restaurants, 2022-2032F |
6.3.4 Australia Edible Beans Market Revenues & Volume, By Others, 2022-2032F |
7 Australia Edible Beans Market Import-Export Trade Statistics |
7.1 Australia Edible Beans Market Export to Major Countries |
7.2 Australia Edible Beans Market Imports from Major Countries |
8 Australia Edible Beans Market Key Performance Indicators |
8.1 Average consumption per capita of edible beans in Australia |
8.2 Number of new product launches featuring edible beans |
8.3 Percentage of agricultural land dedicated to edible bean cultivation in Australia |
9 Australia Edible Beans Market - Opportunity Assessment |
9.1 Australia Edible Beans Market Opportunity Assessment, By Product Type, 2022 & 2032F |
9.2 Australia Edible Beans Market Opportunity Assessment, By Distribution Channel, 2022 & 2032F |
9.3 Australia Edible Beans Market Opportunity Assessment, By Application, 2022 & 2032F |
10 Australia Edible Beans Market - Competitive Landscape |
10.1 Australia Edible Beans Market Revenue Share, By Companies, 2025 |
10.2 Australia Edible Beans Market Competitive Benchmarking, By Operating and Technical Parameters |
11 Company Profiles |
12 Recommendations |
13 Disclaimer |
Global Go To Market Strategy - 2030
Export potential enables firms to identify high-growth global markets with greater confidence by combining advanced trade intelligence with a structured quantitative methodology. The framework analyzes emerging demand trends and country-level import patterns while integrating macroeconomic and trade datasets such as GDP and population forecasts, bilateral import–export flows, tariff structures, elasticity differentials between developed and developing economies, geographic distance, and import demand projections. Using weighted trade values from 2020–2024 as the base period to project country-to-country export potential for 2030, these inputs are operationalized through calculated drivers such as gravity model parameters, tariff impact factors, and projected GDP per-capita growth. Through an analysis of hidden potentials, demand hotspots, and market conditions that are most favorable to success, this method enables firms to focus on target countries, maximize returns, and global expansion with data, backed by accuracy.
By factoring in the projected importer demand gap that is currently unmet and could be potential opportunity, it identifies the potential for the Exporter (Country) among 190 countries, against the general trade analysis, which identifies the biggest importer or exporter.
To discover high-growth global markets and optimize your business strategy:
Click Here
Pricing
- Single User License$ 1,995
- Department License$ 2,400
- Site License$ 3,120
- Global License$ 3,795

Leadership Perspectives from Industry Events
Search
Thought Leadership and Analyst Meet


Our Clients
6WResearch In News
- India Air Conditioner Market Set for Strong Rebound in 2026 After Weather-Led Correction and GST-Driven Recovery: 6Wresearch
- ADAS in India: How Automatic Emergency Braking, Blind Spot Detection & Driver Monitoring are Transforming Road Safety
- Doha a strategic location for EV manufacturing hub: IPA Qatar
- Demand for luxury TVs surging in the GCC, says Samsung
- Empowering Growth: The Thriving Journey of Bangladesh’s Cable Industry
- Demand for luxury TVs surging in the GCC, says Samsung
Latest Reports
- Poland Fire Protection Systems Market (2026-2032)
- Cape Verde Portable Hand-Thrown Extinguisher Market (2026-2032)
- Canada Portable Hand-Thrown Extinguisher Market (2026-2032)
- Cameroon Portable Hand-Thrown Extinguisher Market (2026-2032)
- Burundi Portable Hand-Thrown Extinguisher Market (2026-2032)
- Burkina Faso Portable Hand-Thrown Extinguisher Market (2026-2032)
- Bulgaria Portable Hand-Thrown Extinguisher Market (2026-2032)
- Brunei Portable Hand-Thrown Extinguisher Market (2026-2032)
- Botswana Portable Hand-Thrown Extinguisher Market (2026-2032)
- Bosnia and Herzegovina Portable Hand-Thrown Extinguisher Market (2026-2032)
Industry Events and Analyst Meet

HIMTEX 2026

India Refining Summit 2026

India EV Show 2026

EV tech India Expo 2026

Auto Tech Asia 2026
Whitepaper
- Middle East & Africa Commercial Security Market Click here to view more.
- Middle East & Africa Fire Safety Systems & Equipment Market Click here to view more.
- GCC Drone Market Click here to view more.
- Middle East Lighting Fixture Market Click here to view more.
- GCC Physical & Perimeter Security Market Click here to view more.