Australia Electronic parts Market (2026-2032) | Value, Growth, Size, Analysis, Outlook, Revenue, Share, COVID-19 IMPACT, Trends, Industry, Forecast & Companies
Market Forecast By Type (Passive, Active, Electro Mechanic), By Application (Automotive, Communications, Computing Applications, Others) And Competitive Landscape
| Product Code: ETC035575 | Publication Date: Jun 2023 | Updated Date: Jun 2026 | Product Type: Report | |
| Publisher: 6Wresearch | Author: Ravi Bhandari | No. of Pages: 70 | No. of Figures: 35 | No. of Tables: 5 |
Australia Electronic parts Market Summary
The australia electronic parts market was estimated at USD 148 Million in 2025 and is projected to reach USD 172 Million by 2032, growing at a CAGR of 2.3% from 2026 to 2032.
Australia Electronic parts Market Growth Rate Analysis (2021-2032)
The Australian electronic parts market has shown a notable recovery following a slight decline of 0.9% in 2021, rebounding with growth rates of 5.4% in 2022 and 4.6% in 2023. This upward trend is primarily driven by increased consumer demand for advanced technologies, alongside significant investments in infrastructure and digitalization initiatives. As the nation transitions towards renewable energy and smart technologies, growth is projected to stabilize at around 2.5% to 3.0% from 2024 to 2032. Factors such as evolving industry standards and robust policy support are likely to ensure that the market remains resilient, although fluctuations in global supply chains may pose ongoing challenges.
Australia Electronic parts Market Year-wise Growth Rate and Key Drivers
This graph highlights how the Australia Electronic parts Market has steadily grown over the past five years, supported by major growth factors.
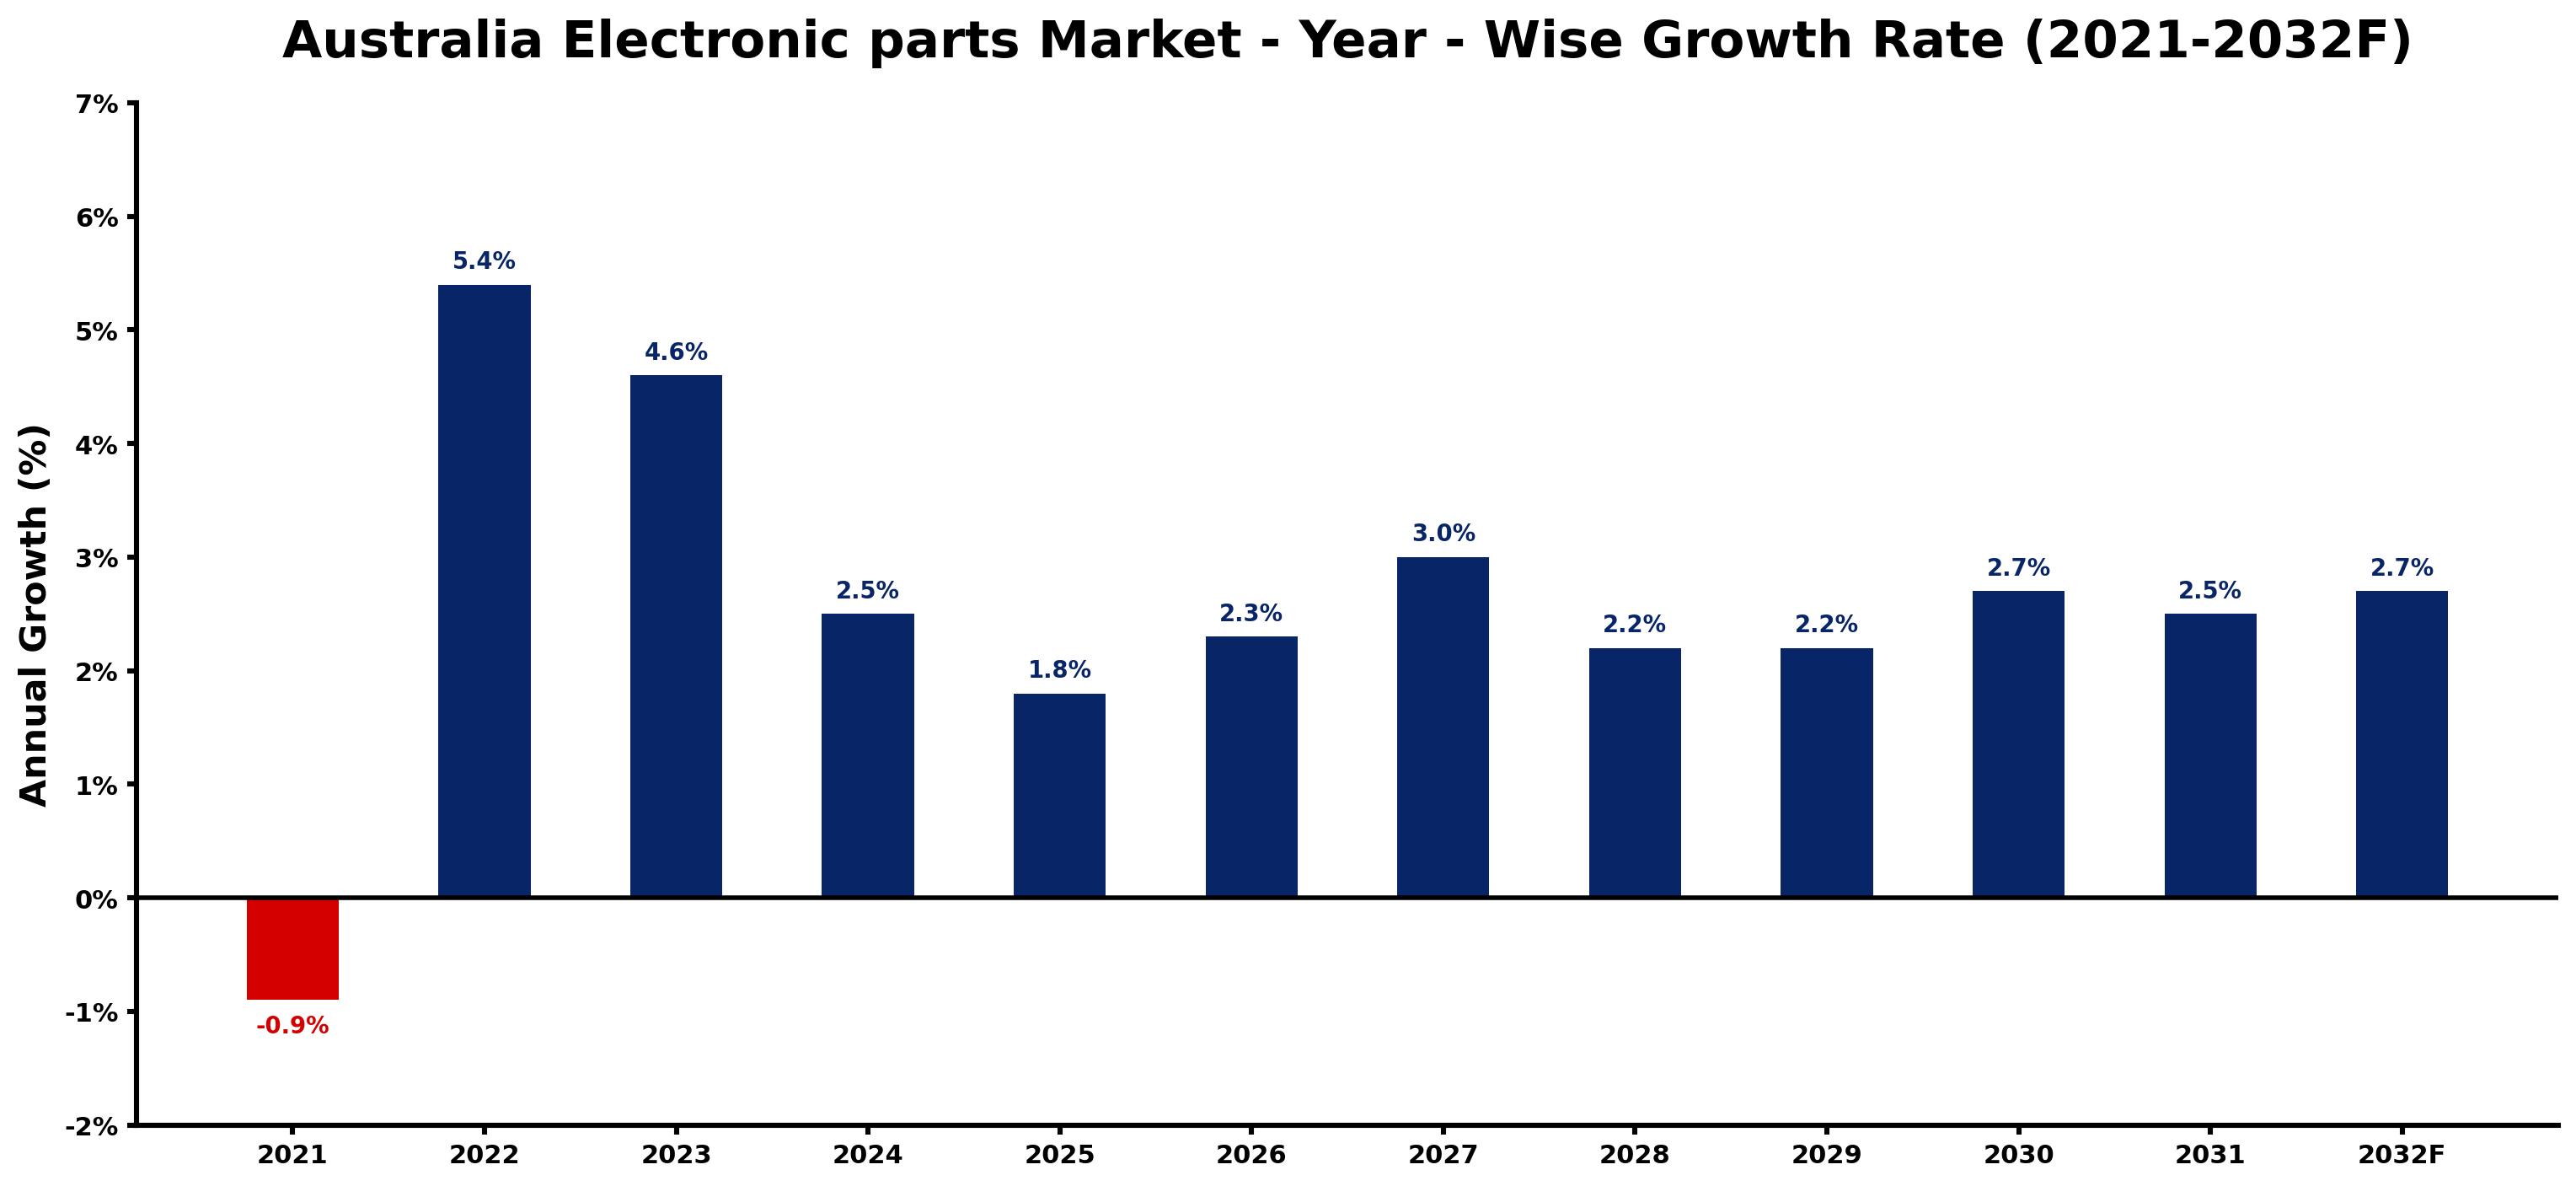
The table below presents the year wise growth rates along with the key drivers influencing the market
| Year | Growth Rate | Major Drivers |
| 2021 | -0.9% | Global semiconductor shortages hindered production capabilities, significantly impacting the electronic parts supply chain in Australia. |
| 2022 | 5.4% | Supply chain challenges prompted local manufacturing initiatives for electronic components production. |
| 2023 | 4.6% | Technological innovation in smart devices enhanced the need for advanced electronic parts. |
| 2024 | 2.5% | Increased consumer preference for renewable energy technologies spurred market diversification. |
| 2025 | 1.8% | The automotive sector's shift to electric vehicles demanded higher-quality electronic components. |
| 2026 | 2.3% | Corporate budgets prioritized IoT integration, leading to a surge in component investments. |
| 2027 | 3.0% | Growth in Australia's construction sector necessitated improved electronic infrastructure solutions. |
| 2028 | 2.2% | Telecommunications expansion highlighted the need for sophisticated electronic parts and systems. |
| 2029 | 2.2% | Local startups focusing on clean technology increased demand for electronic components. |
| 2030 | 2.7% | Integration of AI in manufacturing processes called for advanced electronic part innovations. |
| 2031 | 2.5% | E-commerce platforms emphasized rapid delivery, influencing local production capacity strategies. |
| 2032 | 2.7% | Consumer electronics trends towards automation fostered a thriving electronic parts ecosystem. |
Note - Market size estimations and growth projections presented in this report are based on 6Wresearch's advanced forecasting approach, validated with industry datasets as of June 2026.
Australia Electronic parts Market Synopsis
The Australia Electronic parts Market is projected to reach 2.3% and witness significant growth during the forecast period (2026-2032). This growth is largely attributed to an escalating demand for consumer electronics, coupled with robust industrial advancements and technological innovations. Furthermore, government initiatives promoting digitization and new regulatory frameworks are anticipated to further stimulate this sector's expansion. The proliferation of sophisticated products, including 3D printing technology, drones, and internet-of-things (IoT) systems, is enhancing the sales of electronic components across Australia. Additionally, investments in smart city projects and various other sectors are poised to drive market momentum during the forecast period.
Australia Electronic parts Market Growth Drivers
The growth of the Australia Electronic parts Market is underpinned by several key drivers:
- The rising demand for consumer electronics continues to be a primary catalyst for market growth as households increasingly adopt smart devices and gadgets, which require a diverse array of electronic components.
- Robust industrial development across various sectors, such as automotive, telecommunications, and healthcare, necessitates advanced electronic parts for enhanced functionality and efficiency.
- Technological advancements, including the integration of IoT and automation solutions, are accelerating the adoption of sophisticated electronic components vital for modern applications.
- Government support focused on promoting digitization is fostering an environment conducive to growth, leading to higher investments in electronic manufacturing capacities.
- The introduction of innovative products tailored to meet evolving customer needs assists manufacturers in navigating cost pressures while enhancing market competitiveness.
Australia Electronic parts Market Trends and Opportunities
Several trends are shaping the Australia Electronic parts Market landscape:
- Increasing utilization of renewable energy technologies is promoting the demand for electronic components in solar inverters and energy management systems, creating new opportunities for market players.
- The transition towards electric vehicles (EVs) is driving substantial growth in demand for semiconductors, particularly in control circuits and power management systems.
- The expansion of smart city initiatives is enabling the integration of advanced electronic systems in urban infrastructure, presenting opportunities for manufacturers to innovate and supply critical components.
- Growing consumer awareness regarding sustainable products is compelling manufacturers to develop eco-friendly and efficient electronic components, aligning with market demands.
- Increased collaboration between stakeholders within the technology ecosystem is fostering innovation, with partnerships enhancing the development of smart electronics suited for diverse applications.
Australia Electronic parts Market Challenges and Restraints
Despite the promising growth perspective for the Australia Electronic parts Market, several challenges may impede progress:
- Supply chain disruptions experienced during recent global events continue to pose risks, particularly in the availability of crucial raw materials necessary for electronic parts production.
- The increasing complexity of electronic systems necessitates highly skilled labor, creating a challenge for manufacturers facing workforce shortages and elevated labor costs.
- Fluctuations in global semiconductor prices can adversely affect profit margins, as manufacturers grapple with cost management while striving to remain competitive.
- Regulatory compliance and adherence to evolving industry standards can impose additional operational burdens on manufacturers, affecting growth potential.
- Market saturation in certain segments of the electronic parts sector may lead to intensified competition, compelling companies to continually innovate to capture market share.
Australia Electronic parts Market Government Investment and Initiatives
Government policies and initiatives play a vital role in shaping the Australia Electronic parts Market:
- Public spending on digital infrastructure is undergoing a substantial increase, aiming to bolster the country's technological landscape and stimulate market growth.
- Investment in research and development programs focused on semiconductor technology highlights the government's commitment to enhancing local manufacturing capabilities.
- Initiatives promoting workforce development and training aim to bridge the skills gap within the electronic parts sector, ensuring a steady supply of qualified professionals.
- The government is fostering partnerships between academia and industry to drive innovation, creating a more integrated ecosystem for electronic component development.
- Incentives for sustainable practices encourage companies to pursue environmentally friendly manufacturing processes, aligning industry operations with national sustainability objectives.
Australia Electronic parts Market Latest Developments (May 2025 - June 2026)
The Australia Electronic parts Market has seen notable developments in the periods leading up to mid-2026:
- A surge in government-backed initiatives aimed at promoting advanced manufacturing technologies has led to increased investments in local electronic parts production facilities.
- The focus on electric vehicle technology has gained traction, with several new projects launched to enhance the availability of semiconductors and associated components crucial for EV systems.
- Innovations in smart grid technology are being prioritized as the government seeks to modernize energy infrastructure, creating demand for advanced electronic parts.
- Collaboration between universities and industry players has led to the creation of specialized training programs that address the skills shortages within the electronic sector.
- Challenges related to global supply chain vulnerabilities are prompting Australian manufacturers to diversify their sourcing strategies, enhancing resilience in component procurement.
Australia Electronic parts Market - Key Attractiveness of the Report
- 10 Years of Market Numbers
- Historical Data Starting from 2022 to 2025
- Base Year: 2025
- Forecast Data until 2032
- Key Performance Indicators Impacting the Market
- Major Upcoming Developments and Projects
Key Highlights of the Report:
- Australia Electronic parts Market Outlook
- Market Size of Australia Electronic parts Market, 2025
- Forecast of Australia Electronic parts Market, 2032F
- Historical Data and Forecast of Australia Electronic parts Revenues & Volume for the Period 2022-2032F
- Australia Electronic parts Market Trend Evolution
- Australia Electronic parts Market Drivers and Challenges
- Australia Electronic parts Price Trends
- Australia Electronic parts Porter's Five Forces
- Australia Electronic parts Industry Life Cycle
- Historical Data and Forecast of Australia Electronic parts Market Revenues & Volume By Type for the Period 2022-2032F
- Historical Data and Forecast of Australia Electronic parts Market Revenues & Volume By Passive for the Period 2022-2032F
- Historical Data and Forecast of Australia Electronic parts Market Revenues & Volume By Active for the Period 2022-2032F
- Historical Data and Forecast of Australia Electronic parts Market Revenues & Volume By Electro Mechanic for the Period 2022-2032F
- Historical Data and Forecast of Australia Electronic parts Market Revenues & Volume By Application for the Period 2022-2032F
- Historical Data and Forecast of Australia Electronic parts Market Revenues & Volume By Automotive for the Period 2022-2032F
- Historical Data and Forecast of Australia Electronic parts Market Revenues & Volume By Communications for the Period 2022-2032F
- Historical Data and Forecast of Australia Electronic parts Market Revenues & Volume By Computing Applications for the Period 2022-2032F
- Historical Data and Forecast of Australia Electronic parts Market Revenues & Volume By Others for the Period 2022-2032F
- Australia Electronic parts Import Export Trade Statistics
- Market Opportunity Assessment By Type
- Market Opportunity Assessment By Application
- Australia Electronic parts Top Companies Market Share
- Australia Electronic parts Competitive Benchmarking By Technical and Operational Parameters
- Australia Electronic parts Company Profiles
- Australia Electronic parts Key Strategic Recommendations
Frequently Asked Questions About the Market Study (FAQs):
Rising demand for consumer electronics, industrial growth, and government initiatives promoting digitization are primary drivers.
Government investments aimed at boosting infrastructure and R&D are enhancing local manufacturing capabilities and promoting innovation.
Supply chain disruptions, workforce shortages, and regulatory compliance present significant challenges to market participants.
Key trends include the rise of smart city initiatives, increased focus on sustainable practices, and the growth of electric vehicle technologies.
6Wresearch actively monitors the Australia Electronic parts Market and publishes its comprehensive annual report, highlighting emerging trends, growth drivers, revenue analysis, and forecast outlook. Our insights help businesses to make data-backed strategic decisions with ongoing market dynamics. Our analysts track relevent industries related to the Australia Electronic parts Market, allowing our clients with actionable intelligence and reliable forecasts tailored to emerging regional needs.
Yes, we provide customisation as per your requirements. To learn more, feel free to contact us on sales@6wresearch.com
1 Executive Summary |
2 Introduction |
2.1 Key Highlights of the Report |
2.2 Report Description |
2.3 Market Scope & Segmentation |
2.4 Research Methodology |
2.5 Assumptions |
3 Australia Electronic parts Market Overview |
3.1 Australia Country Macro Economic Indicators |
3.2 Australia Electronic parts Market Revenues & Volume, 2022 & 2032F |
3.3 Australia Electronic parts Market - Industry Life Cycle |
3.4 Australia Electronic parts Market - Porter's Five Forces |
3.5 Australia Electronic parts Market Revenues & Volume Share, By Type, 2022 & 2032F |
3.6 Australia Electronic parts Market Revenues & Volume Share, By Application, 2022 & 2032F |
4 Australia Electronic parts Market Dynamics |
4.1 Impact Analysis |
4.2 Market Drivers |
4.3 Market Restraints |
5 Australia Electronic parts Market Trends |
6 Australia Electronic parts Market, By Types |
6.1 Australia Electronic parts Market, By Type |
6.1.1 Overview and Analysis |
6.1.2 Australia Electronic parts Market Revenues & Volume, By Type, 2022-2032F |
6.1.3 Australia Electronic parts Market Revenues & Volume, By Passive, 2022-2032F |
6.1.4 Australia Electronic parts Market Revenues & Volume, By Active, 2022-2032F |
6.1.5 Australia Electronic parts Market Revenues & Volume, By Electro Mechanic, 2022-2032F |
6.2 Australia Electronic parts Market, By Application |
6.2.1 Overview and Analysis |
6.2.2 Australia Electronic parts Market Revenues & Volume, By Automotive, 2022-2032F |
6.2.3 Australia Electronic parts Market Revenues & Volume, By Communications, 2022-2032F |
6.2.4 Australia Electronic parts Market Revenues & Volume, By Computing Applications, 2022-2032F |
6.2.5 Australia Electronic parts Market Revenues & Volume, By Others, 2022-2032F |
7 Australia Electronic parts Market Import-Export Trade Statistics |
7.1 Australia Electronic parts Market Export to Major Countries |
7.2 Australia Electronic parts Market Imports from Major Countries |
8 Australia Electronic parts Market Key Performance Indicators |
9 Australia Electronic parts Market - Opportunity Assessment |
9.1 Australia Electronic parts Market Opportunity Assessment, By Type, 2022 & 2032F |
9.2 Australia Electronic parts Market Opportunity Assessment, By Application, 2022 & 2032F |
10 Australia Electronic parts Market - Competitive Landscape |
10.1 Australia Electronic parts Market Revenue Share, By Companies, 2025 |
10.2 Australia Electronic parts Market Competitive Benchmarking, By Operating and Technical Parameters |
11 Company Profiles |
12 Recommendations |
13 Disclaimer |
Global Go To Market Strategy - 2030
Export potential enables firms to identify high-growth global markets with greater confidence by combining advanced trade intelligence with a structured quantitative methodology. The framework analyzes emerging demand trends and country-level import patterns while integrating macroeconomic and trade datasets such as GDP and population forecasts, bilateral import–export flows, tariff structures, elasticity differentials between developed and developing economies, geographic distance, and import demand projections. Using weighted trade values from 2020–2024 as the base period to project country-to-country export potential for 2030, these inputs are operationalized through calculated drivers such as gravity model parameters, tariff impact factors, and projected GDP per-capita growth. Through an analysis of hidden potentials, demand hotspots, and market conditions that are most favorable to success, this method enables firms to focus on target countries, maximize returns, and global expansion with data, backed by accuracy.
By factoring in the projected importer demand gap that is currently unmet and could be potential opportunity, it identifies the potential for the Exporter (Country) among 190 countries, against the general trade analysis, which identifies the biggest importer or exporter.
To discover high-growth global markets and optimize your business strategy:
Click Here
Pricing
- Single User License$ 1,995
- Department License$ 2,400
- Site License$ 3,120
- Global License$ 3,795

Leadership Perspectives from Industry Events
Search
Thought Leadership and Analyst Meet


Our Clients
6WResearch In News
- India Air Conditioner Market Set for Strong Rebound in 2026 After Weather-Led Correction and GST-Driven Recovery: 6Wresearch
- ADAS in India: How Automatic Emergency Braking, Blind Spot Detection & Driver Monitoring are Transforming Road Safety
- Doha a strategic location for EV manufacturing hub: IPA Qatar
- Demand for luxury TVs surging in the GCC, says Samsung
- Empowering Growth: The Thriving Journey of Bangladesh’s Cable Industry
- Demand for luxury TVs surging in the GCC, says Samsung
Latest Reports
- Nicaragua RPG Gaming Market (2026-2032)
- New Zealand RPG Gaming Market (2026-2032)
- Netherlands RPG Gaming Market (2026-2032)
- Nauru RPG Gaming Market (2026-2032)
- Namibia RPG Gaming Market (2026-2032)
- Mozambique RPG Gaming Market (2026-2032)
- Montenegro RPG Gaming Market (2026-2032)
- Mongolia RPG Gaming Market (2026-2032)
- Monaco RPG Gaming Market (2026-2032)
- Micronesia RPG Gaming Market (2026-2032)
Industry Events and Analyst Meet

HIMTEX 2026

India Refining Summit 2026

India EV Show 2026

EV tech India Expo 2026

Auto Tech Asia 2026
Whitepaper
- Middle East & Africa Commercial Security Market Click here to view more.
- Middle East & Africa Fire Safety Systems & Equipment Market Click here to view more.
- GCC Drone Market Click here to view more.
- Middle East Lighting Fixture Market Click here to view more.
- GCC Physical & Perimeter Security Market Click here to view more.