Australia Face Powder Market (2026-2032) Outlook | Size, Forecast, Analysis, Value, Trends, Revenue, Industry, Share, Growth & Companies
Market Forecast By Application (Men, Women), By Type (Synthetic, Natural) And Competitive Landscape
| Product Code: ETC324515 | Publication Date: Aug 2022 | Updated Date: Mar 2026 | Product Type: Market Research Report | |
| Publisher: 6Wresearch | Author: Shubham Padhi | No. of Pages: 75 | No. of Figures: 35 | No. of Tables: 20 |
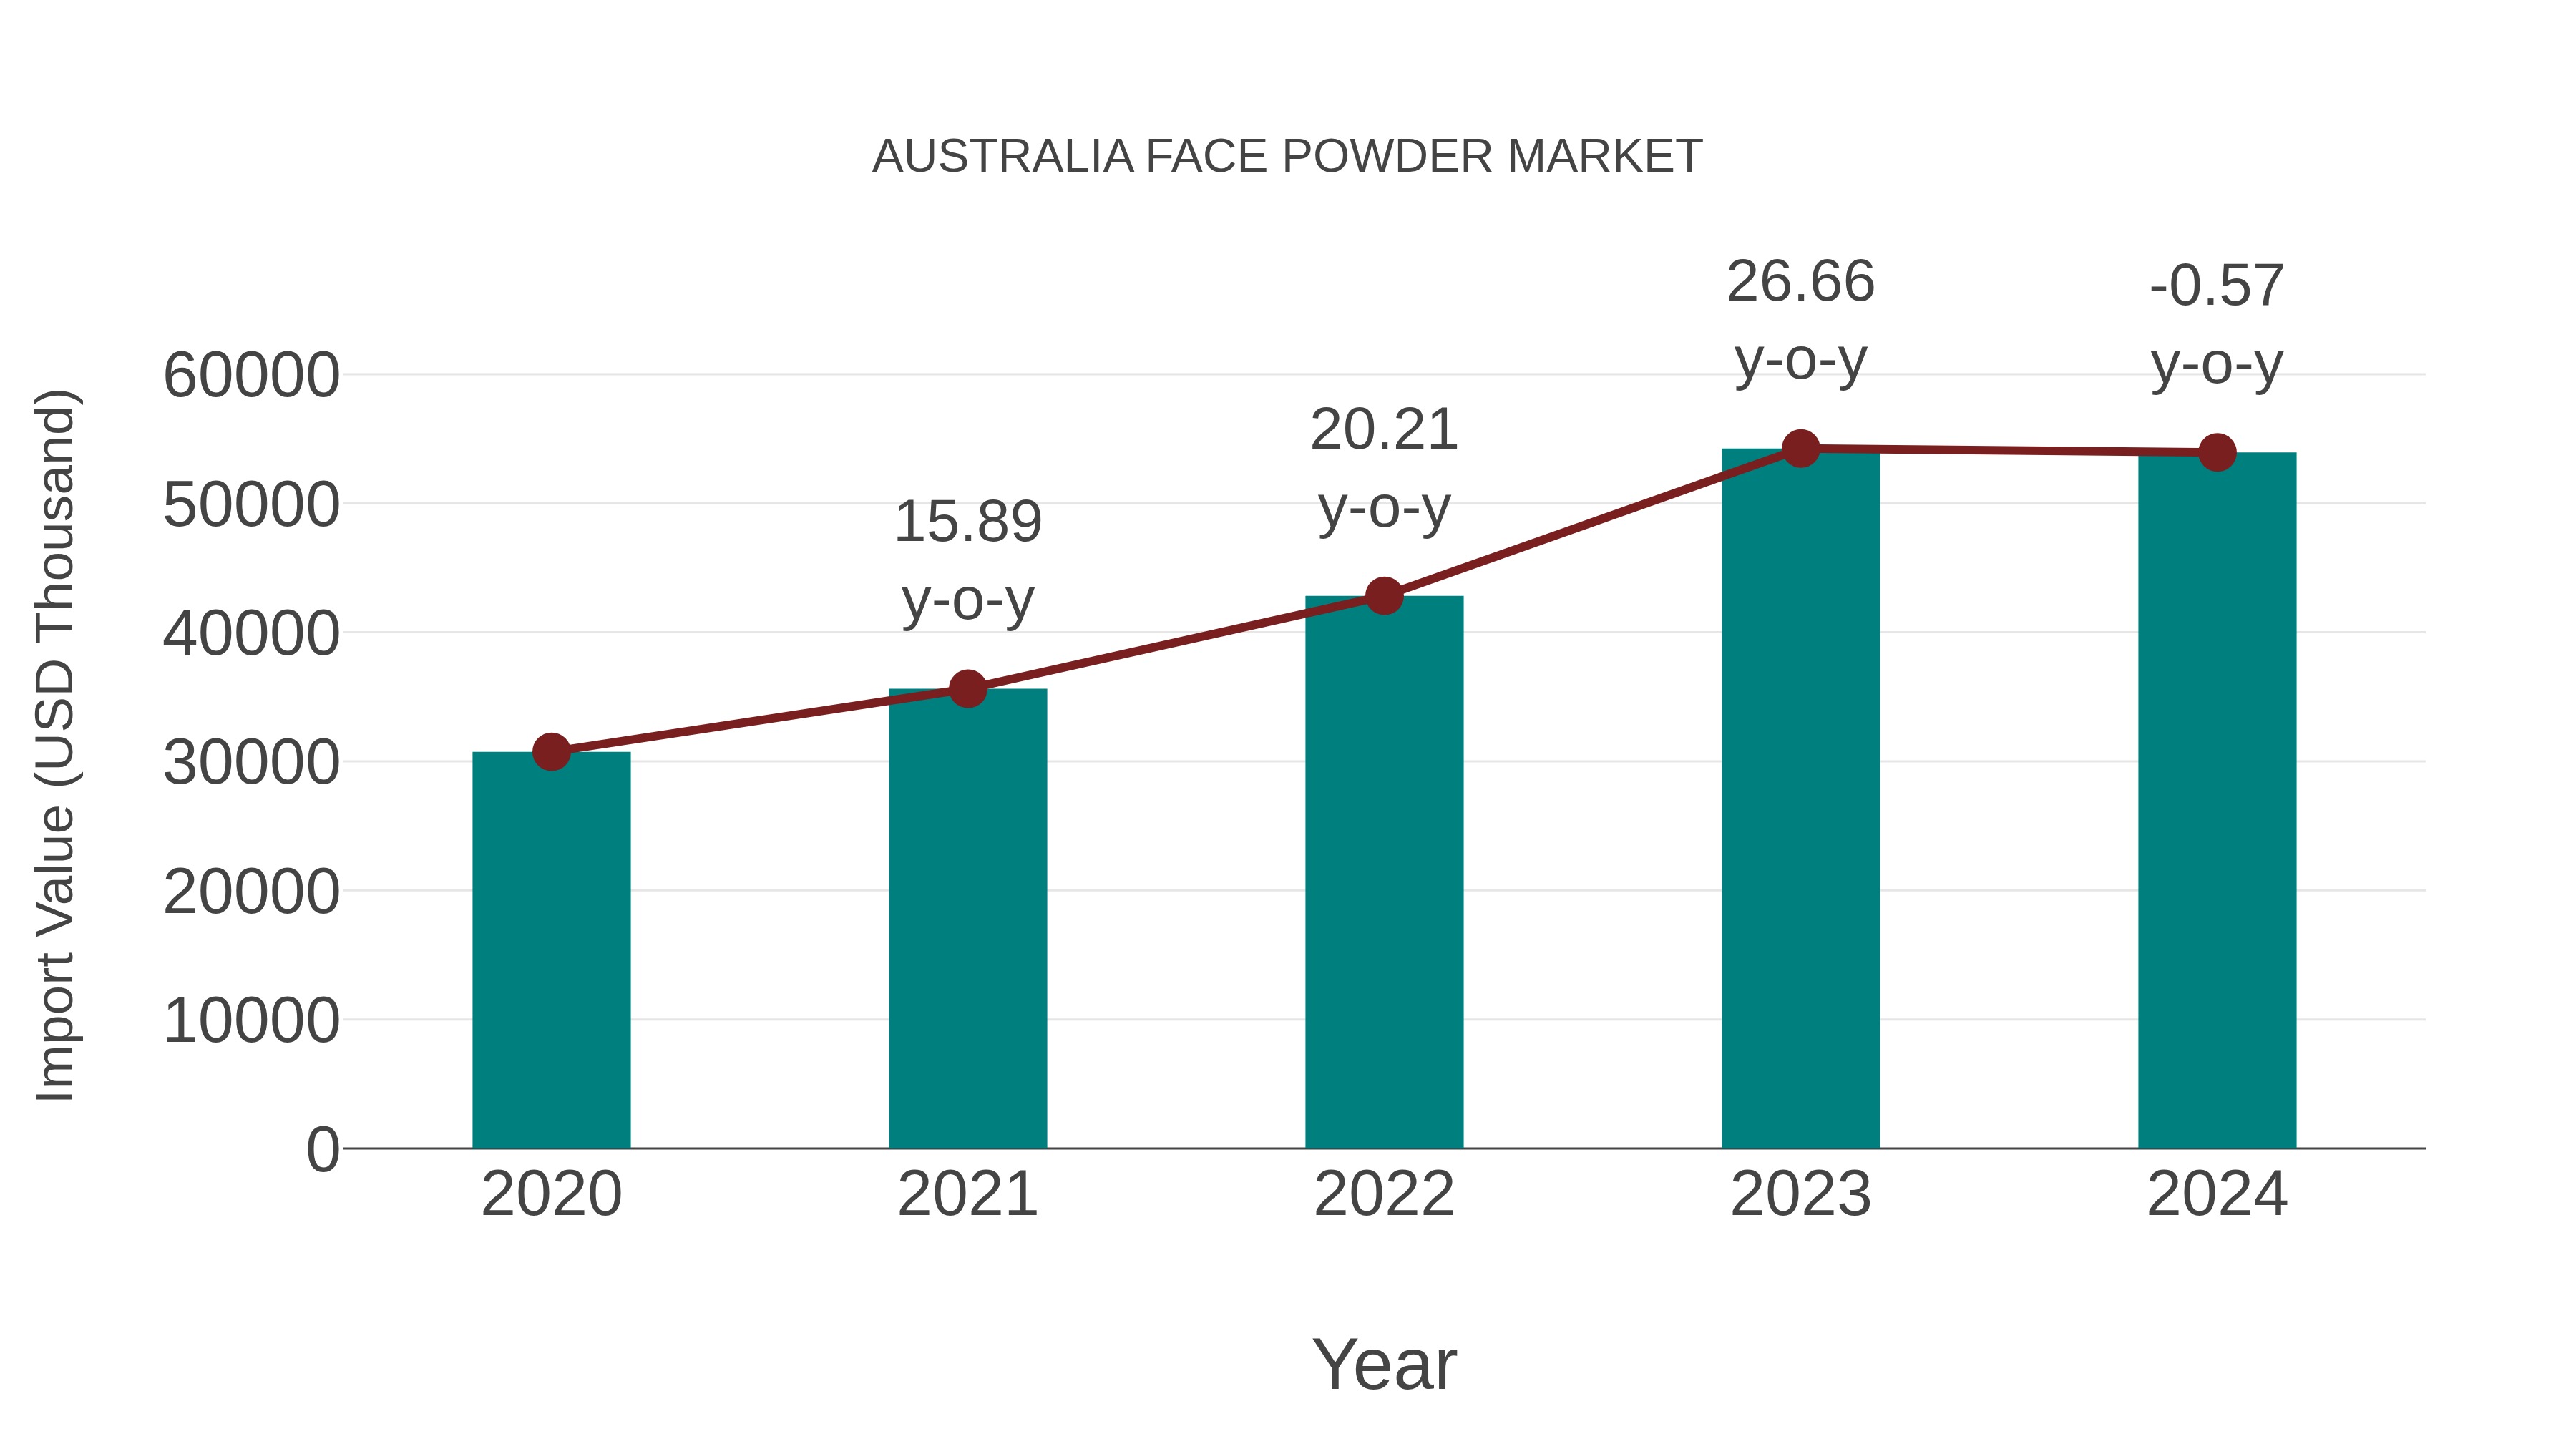
Australia Face Powder Market: Import Trend Analysis
In the Australia face powder market, the import trend experienced a slight decline from 2023 to 2024, with a growth rate of -0.57%. However, the compound annual growth rate (CAGR) from 2020 to 2024 stood at a healthy 15.09%. This shift in import momentum could be attributed to fluctuating consumer preferences or evolving trade dynamics within the market.
Australia Face Powder Market Overview
In the face powder market, Australia reflects a trend towards natural and mineral-based products, driven by concerns over synthetic ingredients and environmental sustainability. Consumers are seeking lightweight and breathable formulas that provide coverage without clogging pores or causing irritation. Additionally, the market is influenced by changing beauty standards and the popularity of makeup trends such as "no-makeup" looks, which emphasize natural beauty and minimalistic makeup application.
Drivers of the market
In the face powder market in Australia, factors such as changing beauty standards and the desire for a flawless complexion contribute to market growth. Consumers seek face powders that offer mattifying, setting, and blurring properties, catering to diverse skin tones and types. Additionally, the rise of clean beauty and natural ingredients influences product formulations and marketing strategies in the face powder market.
Challenges of the market
In the Australia face powder market, challenges revolve around product formulation, marketing, and distribution. With an increasing demand for products that cater to diverse skin tones and concerns, manufacturers must innovate to develop inclusive formulations that deliver desired results for all consumers. Additionally, the market faces competition from alternative makeup products and shifts in consumer preferences towards minimalistic beauty routines. Effective branding and distribution strategies are crucial for companies to stand out and capture market share in this competitive landscape.
Government Policy of the market
In the face powder market, government regulations and standards govern product safety, labeling, and advertising practices. The TGA oversees the regulation of cosmetic powders, ensuring compliance with safety standards and ingredient restrictions. Manufacturers must adhere to labeling requirements that provide consumers with accurate information about product ingredients, usage instructions, and potential risks. Government policies aimed at protecting consumer health, such as restrictions on the use of harmful chemicals and heavy metals in cosmetics, shape the formulation and marketing strategies of face powder products. Additionally, regulations governing product claims and advertising practices are enforced to prevent deceptive or misleading marketing tactics.
Key Highlights of the Report:
- Australia Face Powder Market Outlook
- Market Size of Australia Face Powder Market, 2025
- Forecast of Australia Face Powder Market, 2032
- Historical Data and Forecast of Australia Face Powder Revenues & Volume for the Period 2022-2032F
- Australia Face Powder Market Trend Evolution
- Australia Face Powder Market Drivers and Challenges
- Australia Face Powder Price Trends
- Australia Face Powder Porter's Five Forces
- Australia Face Powder Industry Life Cycle
- Historical Data and Forecast of Australia Face Powder Market Revenues & Volume By Application for the Period 2022-2032F
- Historical Data and Forecast of Australia Face Powder Market Revenues & Volume By Men for the Period 2022-2032F
- Historical Data and Forecast of Australia Face Powder Market Revenues & Volume By Women for the Period 2022-2032F
- Historical Data and Forecast of Australia Face Powder Market Revenues & Volume By Type for the Period 2022-2032F
- Historical Data and Forecast of Australia Face Powder Market Revenues & Volume By Synthetic for the Period 2022-2032F
- Historical Data and Forecast of Australia Face Powder Market Revenues & Volume By Natural for the Period 2022-2032F
- Australia Face Powder Import Export Trade Statistics
- Market Opportunity Assessment By Application
- Market Opportunity Assessment By Type
- Australia Face Powder Top Companies Market Share
- Australia Face Powder Competitive Benchmarking By Technical and Operational Parameters
- Australia Face Powder Company Profiles
- Australia Face Powder Key Strategic Recommendations
Australia Face Powder Market (2026-2032): FAQs
6Wresearch actively monitors the Australia Face Powder Market and publishes its comprehensive annual report, highlighting emerging trends, growth drivers, revenue analysis, and forecast outlook. Our insights help businesses to make data-backed strategic decisions with ongoing market dynamics. Our analysts track relevent industries related to the Australia Face Powder Market, allowing our clients with actionable intelligence and reliable forecasts tailored to emerging regional needs.
Yes, we provide customisation as per your requirements. To learn more, feel free to contact us on sales@6wresearch.com
1 Executive Summary |
2 Introduction |
2.1 Key Highlights of the Report |
2.2 Report Description |
2.3 Market Scope & Segmentation |
2.4 Research Methodology |
2.5 Assumptions |
3 Australia Face Powder Market Overview |
3.1 Australia Country Macro Economic Indicators |
3.2 Australia Face Powder Market Revenues & Volume, 2022 & 2032F |
3.3 Australia Face Powder Market - Industry Life Cycle |
3.4 Australia Face Powder Market - Porter's Five Forces |
3.5 Australia Face Powder Market Revenues & Volume Share, By Application, 2022 & 2032F |
3.6 Australia Face Powder Market Revenues & Volume Share, By Type, 2022 & 2032F |
4 Australia Face Powder Market Dynamics |
4.1 Impact Analysis |
4.2 Market Drivers |
4.2.1 Increasing awareness and demand for natural and organic face powders among Australian consumers. |
4.2.2 Growth in social media influence and beauty trends driving the popularity of face powders. |
4.2.3 Rising disposable income and inclination towards premium beauty products in Australia. |
4.3 Market Restraints |
4.3.1 Competition from other makeup products like foundations, BB creams, and tinted moisturizers. |
4.3.2 Regulatory challenges related to product ingredients and labeling requirements. |
5 Australia Face Powder Market Trends |
6 Australia Face Powder Market, By Types |
6.1 Australia Face Powder Market, By Application |
6.1.1 Overview and Analysis |
6.1.2 Australia Face Powder Market Revenues & Volume, By Application, 2022-2032F |
6.1.3 Australia Face Powder Market Revenues & Volume, By Men, 2022-2032F |
6.1.4 Australia Face Powder Market Revenues & Volume, By Women, 2022-2032F |
6.2 Australia Face Powder Market, By Type |
6.2.1 Overview and Analysis |
6.2.2 Australia Face Powder Market Revenues & Volume, By Synthetic, 2022-2032F |
6.2.3 Australia Face Powder Market Revenues & Volume, By Natural, 2022-2032F |
7 Australia Face Powder Market Import-Export Trade Statistics |
7.1 Australia Face Powder Market Export to Major Countries |
7.2 Australia Face Powder Market Imports from Major Countries |
8 Australia Face Powder Market Key Performance Indicators |
8.1 Consumer engagement on social media platforms for face powder brands. |
8.2 Number of new product launches and innovations in the face powder segment. |
8.3 Growth in online beauty influencers promoting face powders. |
8.4 Percentage of sales from natural and organic face powders. |
8.5 Customer satisfaction and repeat purchase rate for face powder products. |
9 Australia Face Powder Market - Opportunity Assessment |
9.1 Australia Face Powder Market Opportunity Assessment, By Application, 2022 & 2032F |
9.2 Australia Face Powder Market Opportunity Assessment, By Type, 2022 & 2032F |
10 Australia Face Powder Market - Competitive Landscape |
10.1 Australia Face Powder Market Revenue Share, By Companies, 2025 |
10.2 Australia Face Powder Market Competitive Benchmarking, By Operating and Technical Parameters |
11 Company Profiles |
12 Recommendations |
13 Disclaimer |
Global Go To Market Strategy - 2030
Export potential enables firms to identify high-growth global markets with greater confidence by combining advanced trade intelligence with a structured quantitative methodology. The framework analyzes emerging demand trends and country-level import patterns while integrating macroeconomic and trade datasets such as GDP and population forecasts, bilateral import–export flows, tariff structures, elasticity differentials between developed and developing economies, geographic distance, and import demand projections. Using weighted trade values from 2020–2024 as the base period to project country-to-country export potential for 2030, these inputs are operationalized through calculated drivers such as gravity model parameters, tariff impact factors, and projected GDP per-capita growth. Through an analysis of hidden potentials, demand hotspots, and market conditions that are most favorable to success, this method enables firms to focus on target countries, maximize returns, and global expansion with data, backed by accuracy.
By factoring in the projected importer demand gap that is currently unmet and could be potential opportunity, it identifies the potential for the Exporter (Country) among 190 countries, against the general trade analysis, which identifies the biggest importer or exporter.
To discover high-growth global markets and optimize your business strategy:
Click Here
Pricing
- Single User License$ 1,995
- Department License$ 2,400
- Site License$ 3,120
- Global License$ 3,795

Leadership Perspectives from Industry Events
Search
Thought Leadership and Analyst Meet


Our Clients
6WResearch In News
- India Air Conditioner Market Set for Strong Rebound in 2026 After Weather-Led Correction and GST-Driven Recovery: 6Wresearch
- ADAS in India: How Automatic Emergency Braking, Blind Spot Detection & Driver Monitoring are Transforming Road Safety
- Doha a strategic location for EV manufacturing hub: IPA Qatar
- Demand for luxury TVs surging in the GCC, says Samsung
- Empowering Growth: The Thriving Journey of Bangladesh’s Cable Industry
- Demand for luxury TVs surging in the GCC, says Samsung
Latest Reports
- Poland Fire Protection Systems Market (2026-2032)
- Cape Verde Portable Hand-Thrown Extinguisher Market (2026-2032)
- Canada Portable Hand-Thrown Extinguisher Market (2026-2032)
- Cameroon Portable Hand-Thrown Extinguisher Market (2026-2032)
- Burundi Portable Hand-Thrown Extinguisher Market (2026-2032)
- Burkina Faso Portable Hand-Thrown Extinguisher Market (2026-2032)
- Bulgaria Portable Hand-Thrown Extinguisher Market (2026-2032)
- Brunei Portable Hand-Thrown Extinguisher Market (2026-2032)
- Botswana Portable Hand-Thrown Extinguisher Market (2026-2032)
- Bosnia and Herzegovina Portable Hand-Thrown Extinguisher Market (2026-2032)
Industry Events and Analyst Meet

HIMTEX 2026

India Refining Summit 2026

India EV Show 2026

EV tech India Expo 2026

Auto Tech Asia 2026
Whitepaper
- Middle East & Africa Commercial Security Market Click here to view more.
- Middle East & Africa Fire Safety Systems & Equipment Market Click here to view more.
- GCC Drone Market Click here to view more.
- Middle East Lighting Fixture Market Click here to view more.
- GCC Physical & Perimeter Security Market Click here to view more.