Australia Ferro Vanadium Market (2026-2032) Outlook | Value, Trends, Growth, Forecast, Analysis, Industry, Share, Companies, Revenue & Size
Market Forecast By Grade (FeV40, FeV50, FeV60, FeV80), By Production Process (Reduction by Silicon, Reduction by Aluminium), By Application (Concrete Reinforcing Bars, Structural Plates, Axles, Frames, Crankshafts, Titanium Alloys, Pipeline, Others), By End-users (Building & Construction, Aerospace & Defense, Marine, Chemical Industry, Oil & Gas, Industrial Equipment, Automotive, Others) And Competitive Landscape
| Product Code: ETC109074 | Publication Date: Jun 2021 | Updated Date: Mar 2026 | Product Type: Report | |
| Publisher: 6Wresearch | Author: Ravi Bhandari | No. of Pages: 70 | No. of Figures: 35 | No. of Tables: 5 |
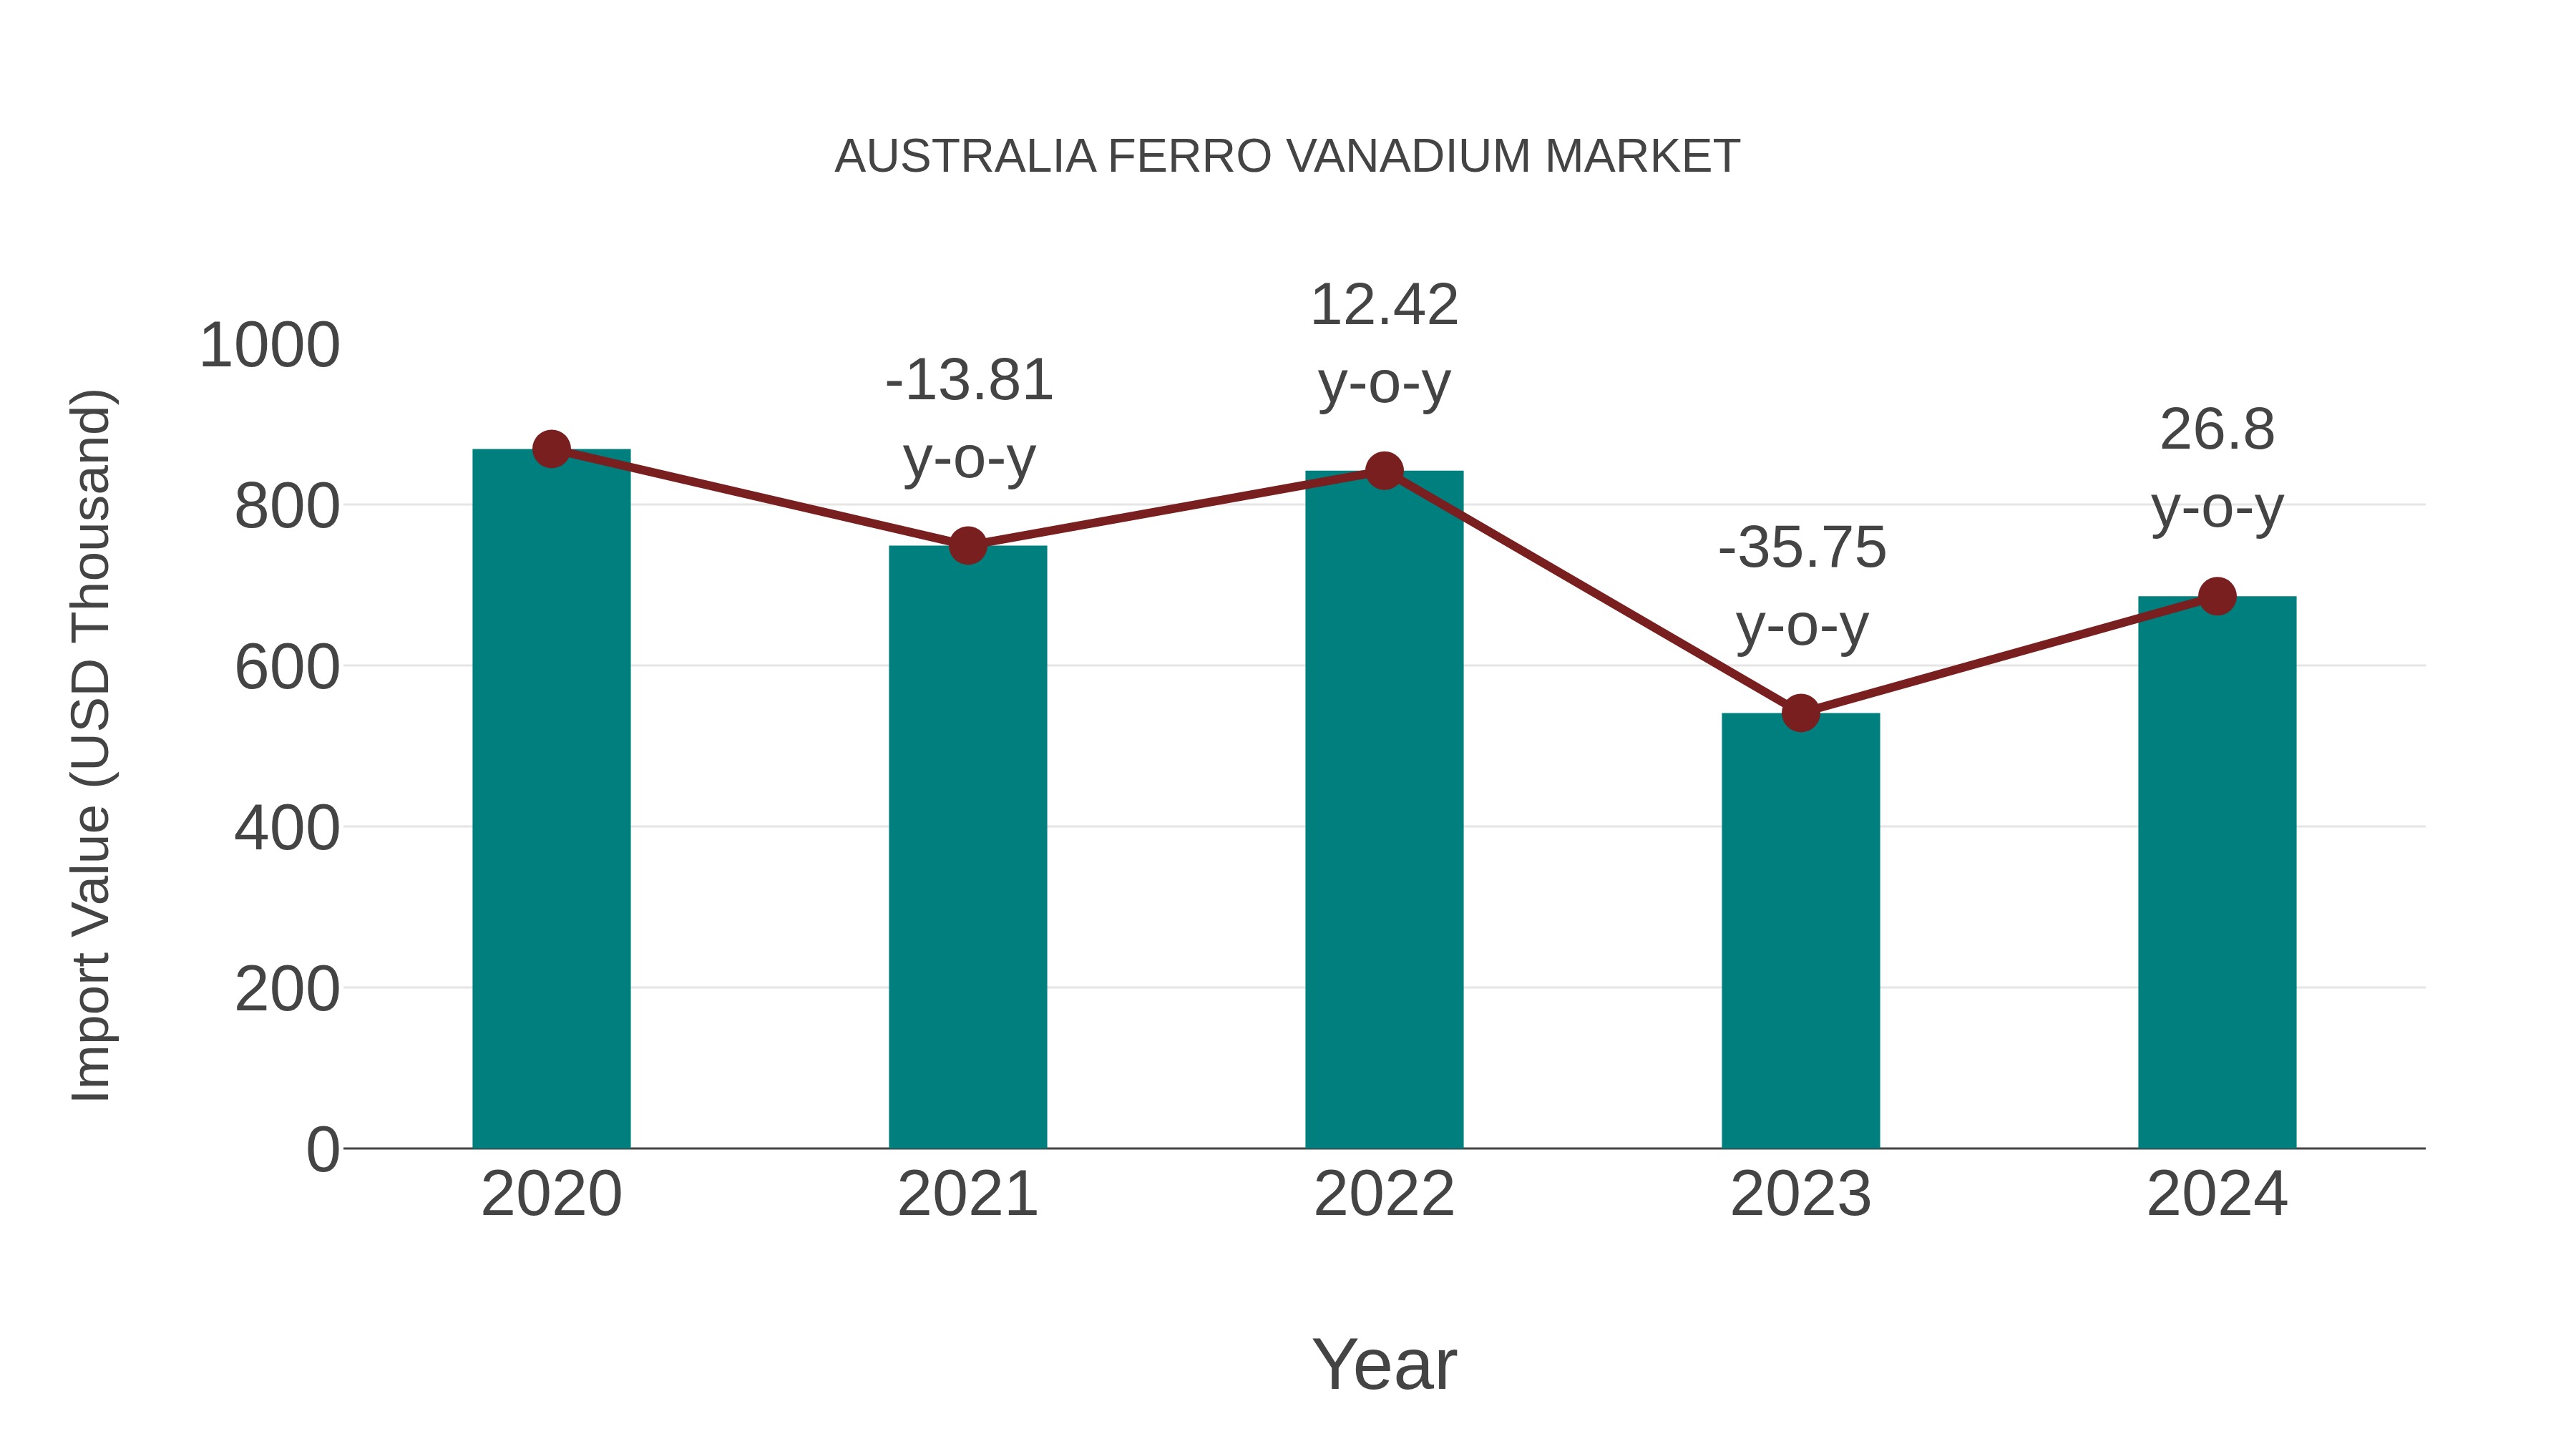
Australia Ferro Vanadium Market: Import Trend Analysis
Australia`s import trend for ferro vanadium in 2024 showed a notable growth rate of 26.8% compared to the previous year. However, the compound annual growth rate (CAGR) for 2020-2024 was -5.74%, indicating a downward trend. This decline could be attributed to shifts in demand dynamics or changes in global trade policies impacting the market stability.
Australia Ferro Vanadium Market Overview
In the ferro vanadium market, Australia plays a significant role as a producer of vanadium-rich minerals. Ferro vanadium is essential for strengthening steel and increasing its resistance to corrosion, making it a critical component in construction, automotive, and aerospace industries. Australia market is driven by the growing demand for high-strength steel alloys.
Drivers of the market
The Australia ferro vanadium market is primarily driven by its application as an alloying element in the production of steel and other ferrous alloys. Ferro vanadium enhances the strength, toughness, and corrosion resistance of steel, making it ideal for use in construction, automotive, and aerospace industries. Market drivers include the growth of these end-user sectors, increasing infrastructure development activities, and the demand for lightweight and high-strength materials.
Challenges of the market
The Australia ferro vanadium market faces challenges related to fluctuations in global vanadium prices and demand dynamics. Volatility in vanadium prices can impact the profitability of ferro vanadium producers and affect investment decisions in the sector. Additionally, regulatory changes and trade policies may pose uncertainties for the market, impacting trade flows and market competitiveness.
Government Policy of the market
In the ferro vanadium market, government policies may aim to support the development of domestic resources and reduce reliance on imports. This could include measures to streamline permitting processes for mining projects, provide financial incentives for exploration and development, and promote collaboration between industry stakeholders and research institutions. Additionally, the government may implement policies to encourage the use of vanadium in emerging sectors such as renewable energy storage.
Key Highlights of the Report:
- Australia Ferro Vanadium Market Outlook
- Market Size of Australia Ferro Vanadium Market, 2025
- Forecast of Australia Ferro Vanadium Market, 2032
- Historical Data and Forecast of Australia Ferro Vanadium Revenues & Volume for the Period 2022-2032F
- Australia Ferro Vanadium Market Trend Evolution
- Australia Ferro Vanadium Market Drivers and Challenges
- Australia Ferro Vanadium Price Trends
- Australia Ferro Vanadium Porter's Five Forces
- Australia Ferro Vanadium Industry Life Cycle
- Historical Data and Forecast of Australia Ferro Vanadium Market Revenues & Volume By Grade for the Period 2022-2032F
- Historical Data and Forecast of Australia Ferro Vanadium Market Revenues & Volume By FeV40 for the Period 2022-2032F
- Historical Data and Forecast of Australia Ferro Vanadium Market Revenues & Volume By FeV50 for the Period 2022-2032F
- Historical Data and Forecast of Australia Ferro Vanadium Market Revenues & Volume By FeV60 for the Period 2022-2032F
- Historical Data and Forecast of Australia Ferro Vanadium Market Revenues & Volume By FeV80 for the Period 2022-2032F
- Historical Data and Forecast of Australia Ferro Vanadium Market Revenues & Volume By Production Process for the Period 2022-2032F
- Historical Data and Forecast of Australia Ferro Vanadium Market Revenues & Volume By Reduction by Silicon for the Period 2022-2032F
- Historical Data and Forecast of Australia Ferro Vanadium Market Revenues & Volume By Reduction by Aluminium for the Period 2022-2032F
- Historical Data and Forecast of Australia Ferro Vanadium Market Revenues & Volume By Application for the Period 2022-2032F
- Historical Data and Forecast of Australia Ferro Vanadium Market Revenues & Volume By Concrete Reinforcing Bars for the Period 2022-2032F
- Historical Data and Forecast of Australia Ferro Vanadium Market Revenues & Volume By Structural Plates for the Period 2022-2032F
- Historical Data and Forecast of Australia Ferro Vanadium Market Revenues & Volume By Axles for the Period 2022-2032F
- Historical Data and Forecast of Australia Ferro Vanadium Market Revenues & Volume By Frames for the Period 2022-2032F
- Historical Data and Forecast of Australia Ferro Vanadium Market Revenues & Volume By Crankshafts for the Period 2022-2032F
- Historical Data and Forecast of Australia Ferro Vanadium Market Revenues & Volume By Titanium Alloys for the Period 2022-2032F
- Historical Data and Forecast of Australia Ferro Vanadium Market Revenues & Volume By Pipeline for the Period 2022-2032F
- Historical Data and Forecast of Australia Ferro Vanadium Market Revenues & Volume By Others for the Period 2022-2032F
- Historical Data and Forecast of Australia Ferro Vanadium Market Revenues & Volume By End-users for the Period 2022-2032F
- Historical Data and Forecast of Australia Ferro Vanadium Market Revenues & Volume By Building & Construction for the Period 2022-2032F
- Historical Data and Forecast of Australia Ferro Vanadium Market Revenues & Volume By Aerospace & Defense for the Period 2022-2032F
- Historical Data and Forecast of Australia Ferro Vanadium Market Revenues & Volume By Marine for the Period 2022-2032F
- Historical Data and Forecast of Australia Ferro Vanadium Market Revenues & Volume By Chemical Industry for the Period 2022-2032F
- Historical Data and Forecast of Australia Ferro Vanadium Market Revenues & Volume By Oil & Gas for the Period 2022-2032F
- Historical Data and Forecast of Australia Ferro Vanadium Market Revenues & Volume By Industrial Equipment for the Period 2022-2032F
- Historical Data and Forecast of Australia Ferro Vanadium Market Revenues & Volume By Automotive for the Period 2022-2032F
- Historical Data and Forecast of Australia Ferro Vanadium Market Revenues & Volume By Others for the Period 2022-2032F
- Australia Ferro Vanadium Import Export Trade Statistics
- Market Opportunity Assessment By Grade
- Market Opportunity Assessment By Production Process
- Market Opportunity Assessment By Application
- Market Opportunity Assessment By End-users
- Australia Ferro Vanadium Top Companies Market Share
- Australia Ferro Vanadium Competitive Benchmarking By Technical and Operational Parameters
- Australia Ferro Vanadium Company Profiles
- Australia Ferro Vanadium Key Strategic Recommendations
Australia Ferro Vanadium Market (2026-2032): FAQs
6Wresearch actively monitors the Australia Ferro Vanadium Market and publishes its comprehensive annual report, highlighting emerging trends, growth drivers, revenue analysis, and forecast outlook. Our insights help businesses to make data-backed strategic decisions with ongoing market dynamics. Our analysts track relevent industries related to the Australia Ferro Vanadium Market, allowing our clients with actionable intelligence and reliable forecasts tailored to emerging regional needs.
Yes, we provide customisation as per your requirements. To learn more, feel free to contact us on sales@6wresearch.com
1 Executive Summary |
2 Introduction |
2.1 Key Highlights of the Report |
2.2 Report Description |
2.3 Market Scope & Segmentation |
2.4 Research Methodology |
2.5 Assumptions |
3 Australia Ferro Vanadium Market Overview |
3.1 Australia Country Macro Economic Indicators |
3.2 Australia Ferro Vanadium Market Revenues & Volume, 2022 & 2032F |
3.3 Australia Ferro Vanadium Market - Industry Life Cycle |
3.4 Australia Ferro Vanadium Market - Porter's Five Forces |
3.5 Australia Ferro Vanadium Market Revenues & Volume Share, By Grade, 2022 & 2032F |
3.6 Australia Ferro Vanadium Market Revenues & Volume Share, By Production Process, 2022 & 2032F |
3.7 Australia Ferro Vanadium Market Revenues & Volume Share, By Form, 2022 & 2032F |
3.8 Australia Ferro Vanadium Market Revenues & Volume Share, By End-users, 2022 & 2032F |
4 Australia Ferro Vanadium Market Dynamics |
4.1 Impact Analysis |
4.2 Market Drivers |
4.2.1 Increasing demand for steel production in Australia |
4.2.2 Growing adoption of vanadium in the energy storage sector |
4.2.3 Government initiatives promoting the use of vanadium in infrastructure projects |
4.3 Market Restraints |
4.3.1 Volatility in vanadium prices |
4.3.2 Competition from alternative materials in steel production |
4.3.3 Regulatory challenges impacting the production and export of ferro vanadium |
5 Australia Ferro Vanadium Market Trends |
6 Australia Ferro Vanadium Market, By Types |
6.1 Australia Ferro Vanadium Market, By Grade |
6.1.1 Overview and Analysis |
6.1.2 Australia Ferro Vanadium Market Revenues & Volume, By Grade, 2022-2032F |
6.1.3 Australia Ferro Vanadium Market Revenues & Volume, By FeV40, 2022-2032F |
6.1.4 Australia Ferro Vanadium Market Revenues & Volume, By FeV50, 2022-2032F |
6.1.5 Australia Ferro Vanadium Market Revenues & Volume, By FeV60, 2022-2032F |
6.1.6 Australia Ferro Vanadium Market Revenues & Volume, By FeV80, 2022-2032F |
6.2 Australia Ferro Vanadium Market, By Production Process |
6.2.1 Overview and Analysis |
6.2.2 Australia Ferro Vanadium Market Revenues & Volume, By Reduction by Silicon, 2022-2032F |
6.2.3 Australia Ferro Vanadium Market Revenues & Volume, By Reduction by Aluminium, 2022-2032F |
6.3 Australia Ferro Vanadium Market, By Application |
6.3.1 Overview and Analysis |
6.3.2 Australia Ferro Vanadium Market Revenues & Volume, By Concrete Reinforcing Bars, 2022-2032F |
6.3.3 Australia Ferro Vanadium Market Revenues & Volume, By Structural Plates, 2022-2032F |
6.3.4 Australia Ferro Vanadium Market Revenues & Volume, By Axles, 2022-2032F |
6.3.5 Australia Ferro Vanadium Market Revenues & Volume, By Frames, 2022-2032F |
6.3.6 Australia Ferro Vanadium Market Revenues & Volume, By Crankshafts, 2022-2032F |
6.3.7 Australia Ferro Vanadium Market Revenues & Volume, By Titanium Alloys, 2022-2032F |
6.3.8 Australia Ferro Vanadium Market Revenues & Volume, By Others, 2022-2032F |
6.3.9 Australia Ferro Vanadium Market Revenues & Volume, By Others, 2022-2032F |
6.4 Australia Ferro Vanadium Market, By End-users |
6.4.1 Overview and Analysis |
6.4.2 Australia Ferro Vanadium Market Revenues & Volume, By Building & Construction, 2022-2032F |
6.4.3 Australia Ferro Vanadium Market Revenues & Volume, By Aerospace & Defense, 2022-2032F |
6.4.4 Australia Ferro Vanadium Market Revenues & Volume, By Marine, 2022-2032F |
6.4.5 Australia Ferro Vanadium Market Revenues & Volume, By Chemical Industry, 2022-2032F |
6.4.6 Australia Ferro Vanadium Market Revenues & Volume, By Oil & Gas, 2022-2032F |
6.4.7 Australia Ferro Vanadium Market Revenues & Volume, By Industrial Equipment, 2022-2032F |
6.4.8 Australia Ferro Vanadium Market Revenues & Volume, By Others, 2022-2032F |
6.4.9 Australia Ferro Vanadium Market Revenues & Volume, By Others, 2022-2032F |
7 Australia Ferro Vanadium Market Import-Export Trade Statistics |
7.1 Australia Ferro Vanadium Market Export to Major Countries |
7.2 Australia Ferro Vanadium Market Imports from Major Countries |
8 Australia Ferro Vanadium Market Key Performance Indicators |
8.1 Average vanadium spot price |
8.2 Number of new energy storage projects using vanadium |
8.3 Government funding allocated to vanadium-related research and development |
8.4 Percentage of vanadium used in steel production compared to other materials |
8.5 Number of infrastructure projects incorporating vanadium technologies |
9 Australia Ferro Vanadium Market - Opportunity Assessment |
9.1 Australia Ferro Vanadium Market Opportunity Assessment, By Grade, 2022 & 2032F |
9.2 Australia Ferro Vanadium Market Opportunity Assessment, By Production Process, 2022 & 2032F |
9.3 Australia Ferro Vanadium Market Opportunity Assessment, By Application, 2022 & 2032F |
9.4 Australia Ferro Vanadium Market Opportunity Assessment, By End-users, 2022 & 2032F |
10 Australia Ferro Vanadium Market - Competitive Landscape |
10.1 Australia Ferro Vanadium Market Revenue Share, By Companies, 2025 |
10.2 Australia Ferro Vanadium Market Competitive Benchmarking, By Operating and Technical Parameters |
11 Company Profiles |
12 Recommendations |
13 Disclaimer |
Global Go To Market Strategy - 2030
Export potential enables firms to identify high-growth global markets with greater confidence by combining advanced trade intelligence with a structured quantitative methodology. The framework analyzes emerging demand trends and country-level import patterns while integrating macroeconomic and trade datasets such as GDP and population forecasts, bilateral import–export flows, tariff structures, elasticity differentials between developed and developing economies, geographic distance, and import demand projections. Using weighted trade values from 2020–2024 as the base period to project country-to-country export potential for 2030, these inputs are operationalized through calculated drivers such as gravity model parameters, tariff impact factors, and projected GDP per-capita growth. Through an analysis of hidden potentials, demand hotspots, and market conditions that are most favorable to success, this method enables firms to focus on target countries, maximize returns, and global expansion with data, backed by accuracy.
By factoring in the projected importer demand gap that is currently unmet and could be potential opportunity, it identifies the potential for the Exporter (Country) among 190 countries, against the general trade analysis, which identifies the biggest importer or exporter.
To discover high-growth global markets and optimize your business strategy:
Click Here
Pricing
- Single User License$ 1,995
- Department License$ 2,400
- Site License$ 3,120
- Global License$ 3,795

Leadership Perspectives from Industry Events
Search
Thought Leadership and Analyst Meet


Our Clients
6WResearch In News
- India Air Conditioner Market Set for Strong Rebound in 2026 After Weather-Led Correction and GST-Driven Recovery: 6Wresearch
- ADAS in India: How Automatic Emergency Braking, Blind Spot Detection & Driver Monitoring are Transforming Road Safety
- Doha a strategic location for EV manufacturing hub: IPA Qatar
- Demand for luxury TVs surging in the GCC, says Samsung
- Empowering Growth: The Thriving Journey of Bangladesh’s Cable Industry
- Demand for luxury TVs surging in the GCC, says Samsung
Latest Reports
- Nicaragua RPG Gaming Market (2026-2032)
- New Zealand RPG Gaming Market (2026-2032)
- Netherlands RPG Gaming Market (2026-2032)
- Nauru RPG Gaming Market (2026-2032)
- Namibia RPG Gaming Market (2026-2032)
- Mozambique RPG Gaming Market (2026-2032)
- Montenegro RPG Gaming Market (2026-2032)
- Mongolia RPG Gaming Market (2026-2032)
- Monaco RPG Gaming Market (2026-2032)
- Micronesia RPG Gaming Market (2026-2032)
Industry Events and Analyst Meet

EV India Expo 2026

HIMTEX 2026

India Refining Summit 2026

India EV Show 2026

EV tech India Expo 2026
Whitepaper
- Middle East & Africa Commercial Security Market Click here to view more.
- Middle East & Africa Fire Safety Systems & Equipment Market Click here to view more.
- GCC Drone Market Click here to view more.
- Middle East Lighting Fixture Market Click here to view more.
- GCC Physical & Perimeter Security Market Click here to view more.