Australia Fish Processing Market (2026-2032) | Companies, Revenue, Value, Share, Industry, Trends, Growth, Forecast, Outlook, Analysis & Size
Market Forecast By Source (Marine, Inland, Freshwater), By Application (Food, Feed, Biomedical, Others), By Processing (Frozen, Preserved, Others), By Equipment (Gutting, Scaling, Filleting, Deboning, Skinning, Curing & Smoking, Others) And Competitive Landscape
| Product Code: ETC042615 | Publication Date: Jan 2021 | Updated Date: Jun 2026 | Product Type: Report | |
| Publisher: 6Wresearch | Author: Ravi Bhandari | No. of Pages: 70 | No. of Figures: 35 | No. of Tables: 5 |
Australia Fish Processing Market Summary
The australia fish processing market was estimated at USD 244 Million in 2025 and is projected to reach USD 288 Million by 2032, growing at a CAGR of 3.0% from 2026 to 2032.
Australia Fish Processing Market Year-wise Growth Rate and Key Drivers
This graph highlights how the Australia Fish Processing Market has steadily grown over the past five years, supported by major growth factors.
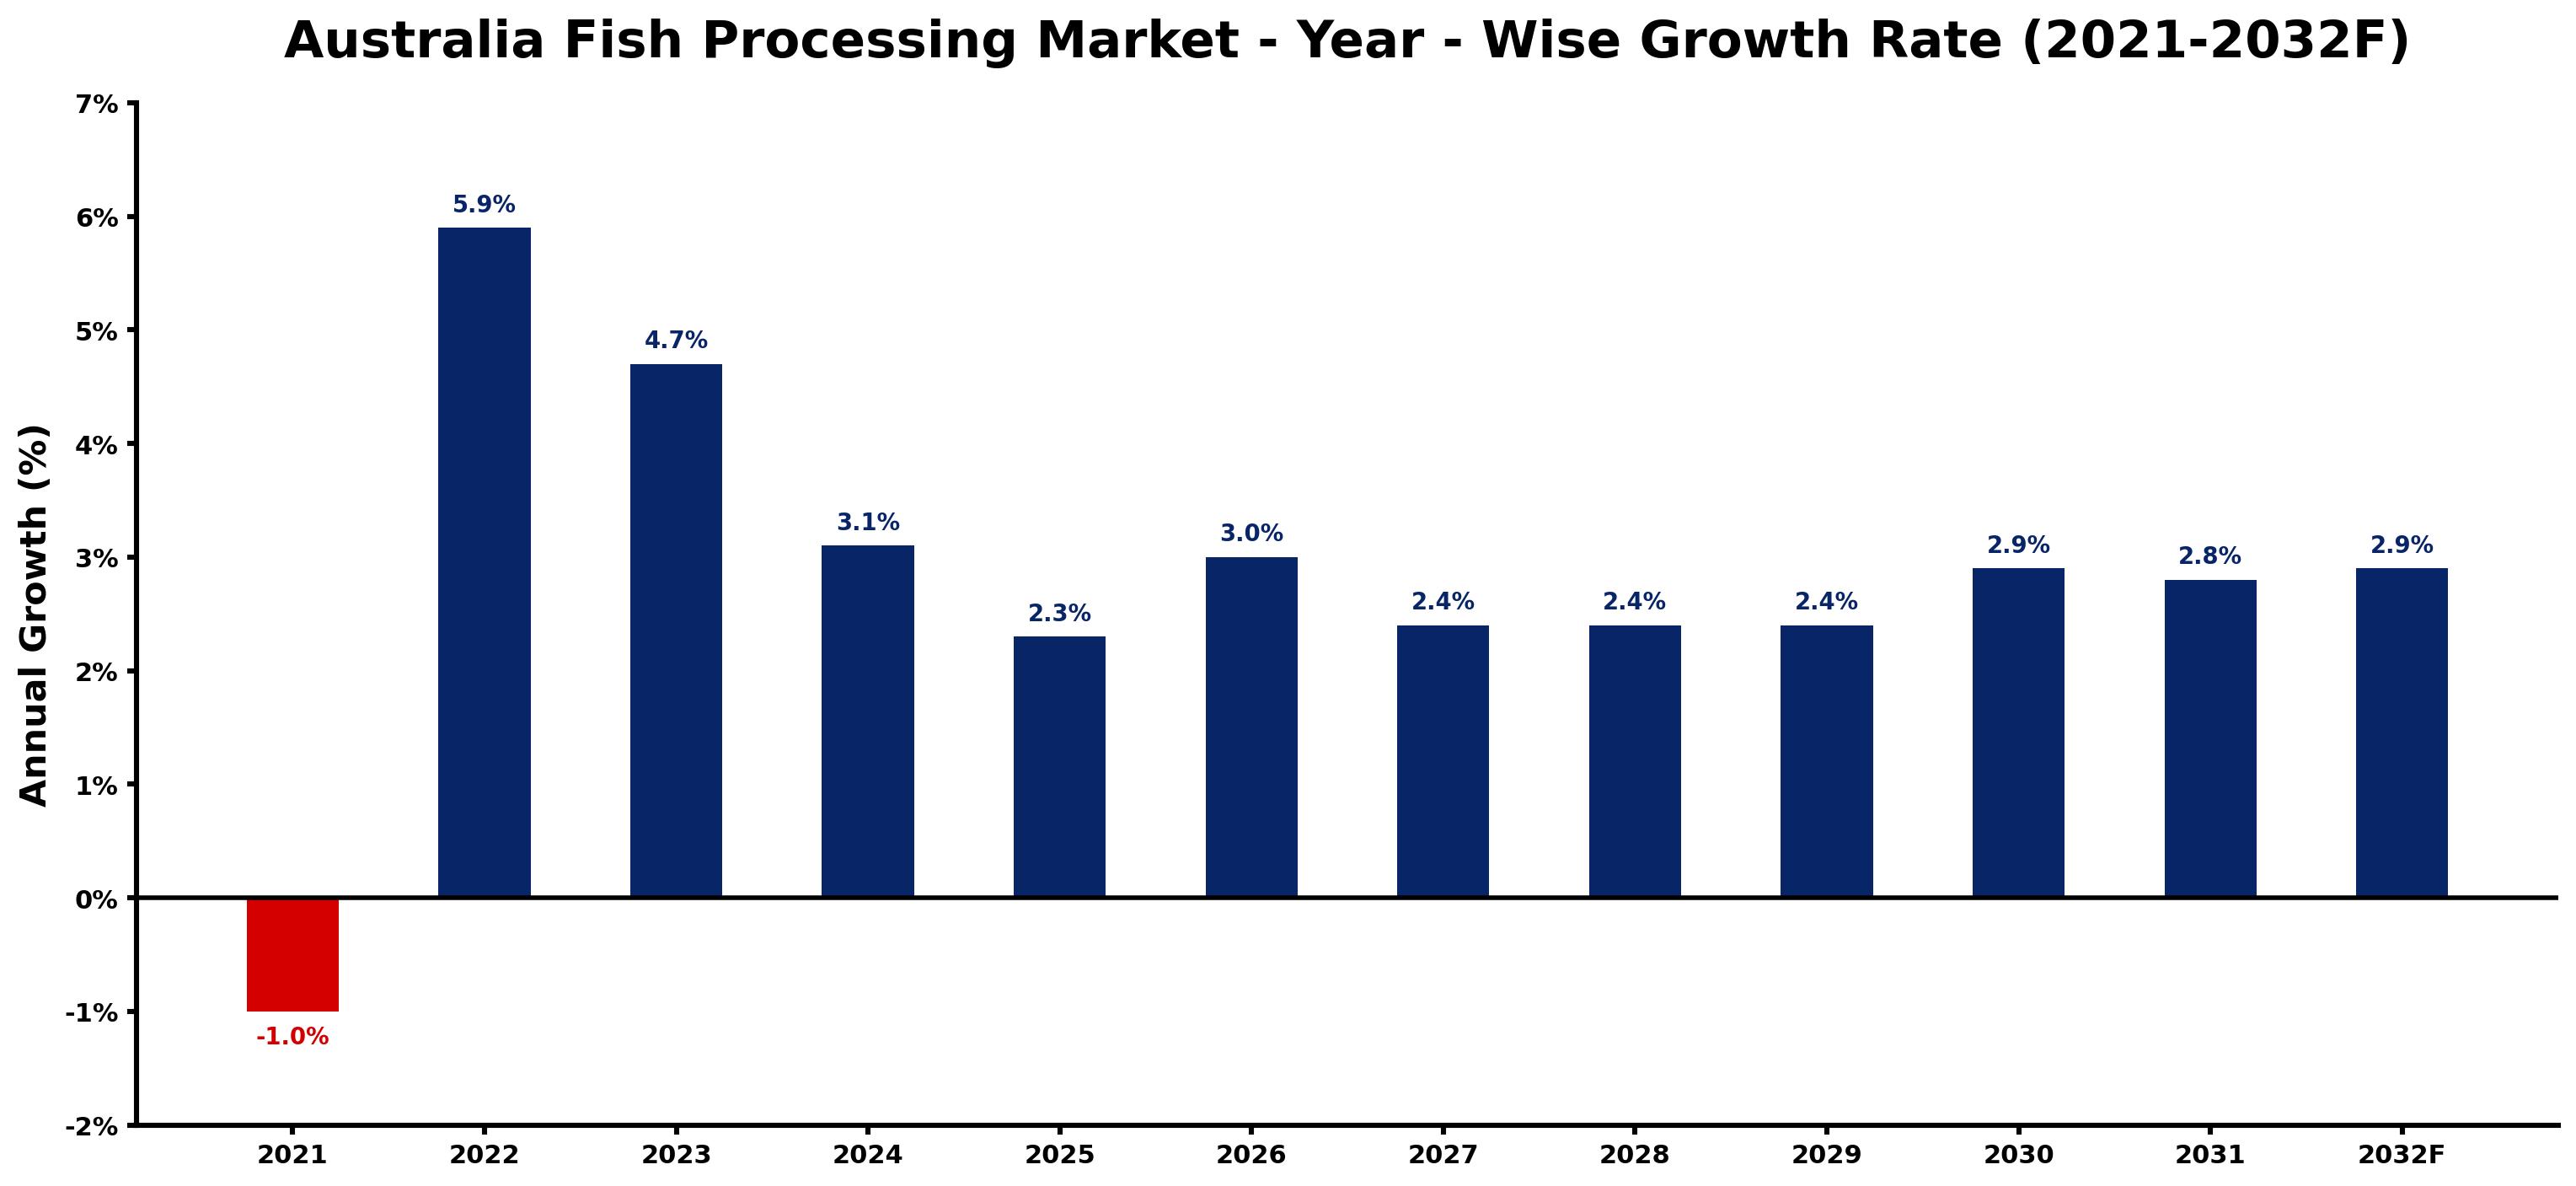
The table below presents the year wise growth rates along with the key drivers influencing the market
| Year | Growth Rate | Major Drivers |
| 2021 | -1.0% | Pandemicrelated supply chain disruptions led to inadequate fish supply, impacting processing operations and market performance. |
| 2022 | 5.9% | Technological innovations enhance operational efficiency within processing facilities. |
| 2023 | 4.7% | Export opportunities expand as global seafood demand increases steadily. |
| 2024 | 3.1% | Investment in cold chain logistics ensures product quality and freshness. |
| 2025 | 2.3% | Challenges from climate change necessitate adaptive practices in fish sourcing. |
| 2026 | 3.0% | Local regulations foster eco-friendly processing methods and certifications. |
| 2027 | 2.4% | An aging population drives higher demand for nutritious seafood products. |
| 2028 | 2.4% | Emerging markets in Asia amplify the need for Australian seafood exports. |
| 2029 | 2.4% | Collaboration between industry players enhances supply chain resilience and transparency. |
| 2030 | 2.9% | Increasing urbanization patterns contribute to higher seafood consumption rates. |
| 2031 | 2.8% | Consumer education campaigns promote health benefits associated with fish consumption. |
| 2032 | 2.9% | Digital platforms facilitate direct-to-consumer sales, reshaping market dynamics. |
Note - Market size estimations and growth projections presented in this report are based on 6Wresearch's advanced forecasting approach, validated with industry datasets as of June 2026.
Australia Fish Processing Market Synopsis
The Australia Fish Processing Market is projected to reach 3.0% and witness significant growth during the forecast period (2026-2032). This market is pivotal in ensuring the quality and safety of seafood products throughout the supply chain, from harvest to consumption. The application of stringent food safety regulations and hygiene standards necessitates the utilization of advanced equipment and technologies. Fish processing facilities are equipped to handle various operations including cleaning, filleting, preserving, and packaging seafood, thus maintaining the integrity of the products. As consumer preferences evolve, the market is adapting to the growing demand for value-added seafood offerings.
Australia Fish Processing Market Growth Drivers
Several factors are driving growth in the Australia Fish Processing Market. Firstly, there is a notable increase in seafood consumption as health-conscious consumers gravitate toward protein-rich diets. This shift is complemented by technological advancements in processing techniques, enabling producers to enhance efficiency and maintain product quality. Furthermore, the demand for convenience is prompting consumers to seek ready-to-eat and easy-to-prepare seafood options, such as fillets and smoked fish. Consequently, this trend is encouraging processors to innovate and diversify their product lines. Additionally, adherence to stringent food safety regulations compels investments in modern processing facilities, fostering a competitive edge in both domestic and international markets.
Australia Fish Processing Market Challenges and Restraints
While the market exhibits promising prospects, several challenges must be navigated. Compliance with stringent regulations and quality standards for food safety necessitates substantial investments in processing facilities and equipment. Labor shortages also pose a significant obstacle, hindering the operational efficiency of fish processing businesses. Fluctuating fish supplies, combined with transportation logistics, can impact product availability and profitability. Moreover, environmental concerns regarding bycatch and waste management are increasingly influencing consumer preferences and, by extension, market demand. Addressing these challenges effectively will be crucial for sustaining growth in the industry.
Australia Fish Processing Market Regional Analysis
The geographical distribution of the Australia Fish Processing Market reflects the diverse aquatic environments and fishing practices prevalent across the country. Coastal regions, particularly those with rich marine biodiversity, serve as significant hubs for fish processing activities. These areas are equipped with the infrastructure necessary to support efficient harvesting and processing operations. Additionally, the presence of stringent government regulations in these regions encourages high standards in food safety and quality control. As urbanization continues to increase, proximity to major consumers also becomes a vital factor in determining the location of processing facilities, influencing market dynamics.
Australia Fish Processing Market Government Investment and Initiatives
Government initiatives play a pivotal role in shaping the landscape of the Australia Fish Processing Market. Policies focused on food safety regulations and hygiene standards are implemented to ensure that processed seafood products meet quality benchmarks. Public spending on research and development initiatives aims to promote innovation in processing technologies, thereby enhancing efficiency and sustainability within the industry. Furthermore, government agencies often provide incentives for fish processors to adopt best practices that align with environmental sustainability goals. Through these measures, authorities will bolster the sector's resilience and adaptability, ensuring its growth aligns with market demands.
Australia Fish Processing Market Latest Developments (May 2025 - June 2026)
Recent developments in the Australia Fish Processing Market indicate a tilt towards modernization and sustainability. As industry players invest in advanced technologies, there has been a noticeable shift towards automation in processing facilities, enhancing operational efficiency. Moreover, the market is witnessing an increase in collaborations aimed at research and development, focusing on creating environmentally friendly processing methods. The growing emphasis on traceability and transparency in supply chains has also led to the adoption of innovative tracking systems that assure consumers of product quality. Additionally, there is a rising trend towards incorporating value-added products, responding effectively to changing consumer preferences.
Australia Fish Processing Market - Key Attractiveness of the Report
- 10 Years of Market Numbers
- Historical Data Starting from 2022 to 2025
- Base Year: 2025
- Forecast Data until 2032
- Key Performance Indicators Impacting the Market
- Major Upcoming Developments and Projects
Key Highlights of the Report:
- Australia Fish Processing Market Outlook
- Market Size of Australia Fish Processing Market, 2025
- Forecast of Australia Fish Processing Market, 2032
- Historical Data and Forecast of Australia Fish Processing Revenues & Volume for the Period 2022-2032F
- Australia Fish Processing Market Trend Evolution
- Australia Fish Processing Market Drivers and Challenges
- Australia Fish Processing Price Trends
- Australia Fish Processing Porter's Five Forces
- Australia Fish Processing Industry Life Cycle
- Historical Data and Forecast of Australia Fish Processing Market Revenues & Volume By Source for the Period 2022-2032F
- Historical Data and Forecast of Australia Fish Processing Market Revenues & Volume By Marine for the Period 2022-2032F
- Historical Data and Forecast of Australia Fish Processing Market Revenues & Volume By Inland for the Period 2022-2032F
- Historical Data and Forecast of Australia Fish Processing Market Revenues & Volume By Freshwater for the Period 2022-2032F
- Historical Data and Forecast of Australia Fish Processing Market Revenues & Volume By Application for the Period 2022-2032F
- Historical Data and Forecast of Australia Fish Processing Market Revenues & Volume By Food for the Period 2022-2032F
- Historical Data and Forecast of Australia Fish Processing Market Revenues & Volume By Feed for the Period 2022-2032F
- Historical Data and Forecast of Australia Fish Processing Market Revenues & Volume By Biomedical for the Period 2022-2032F
- Historical Data and Forecast of Australia Fish Processing Market Revenues & Volume By Others for the Period 2022-2032F
- Historical Data and Forecast of Australia Fish Processing Market Revenues & Volume By Processing for the Period 2022-2032F
- Historical Data and Forecast of Australia Fish Processing Market Revenues & Volume By Frozen for the Period 2022-2032F
- Historical Data and Forecast of Australia Fish Processing Market Revenues & Volume By Preserved for the Period 2022-2032F
- Historical Data and Forecast of Australia Fish Processing Market Revenues & Volume By Others for the Period 2022-2032F
- Historical Data and Forecast of Australia Fish Processing Market Revenues & Volume By Equipment for the Period 2022-2032F
- Historical Data and Forecast of Australia Fish Processing Market Revenues & Volume By Gutting for the Period 2022-2032F
- Historical Data and Forecast of Australia Fish Processing Market Revenues & Volume By Scaling for the Period 2022-2032F
- Historical Data and Forecast of Australia Fish Processing Market Revenues & Volume By Filleting for the Period 2022-2032F
- Historical Data and Forecast of Australia Fish Processing Market Revenues & Volume By Deboning for the Period 2022-2032F
- Historical Data and Forecast of Australia Fish Processing Market Revenues & Volume By Skinning for the Period 2022-2032F
- Historical Data and Forecast of Australia Fish Processing Market Revenues & Volume By Curing & Smoking for the Period 2022-2032F
- Historical Data and Forecast of Australia Fish Processing Market Revenues & Volume By Others for the Period 2022-2032F
- Australia Fish Processing Import Export Trade Statistics
- Market Opportunity Assessment By Source
- Market Opportunity Assessment By Application
- Market Opportunity Assessment By Processing
- Market Opportunity Assessment By Equipment
- Australia Fish Processing Top Companies Market Share
- Australia Fish Processing Competitive Benchmarking By Technical and Operational Parameters
- Australia Fish Processing Company Profiles
- Australia Fish Processing Key Strategic Recommendations
Frequently Asked Questions About the Market Study (FAQs):
The growth is primarily driven by increasing seafood consumption, technological advancements in processing techniques, and rising demand for convenience and value-added seafood products.
Key challenges include stringent regulations, labor shortages, fluctuating fish supplies, and environmental sustainability concerns.
Government policies enforce food safety regulations and provide incentives for innovation, ensuring high standards of quality and promoting sustainable practices within the industry.
Recent trends include the modernization of processing facilities through automation, increased focus on sustainable practices, and a rise in the availability of traceable seafood products.
6Wresearch actively monitors the Australia Fish Processing Market and publishes its comprehensive annual report, highlighting emerging trends, growth drivers, revenue analysis, and forecast outlook. Our insights help businesses to make data-backed strategic decisions with ongoing market dynamics. Our analysts track relevent industries related to the Australia Fish Processing Market, allowing our clients with actionable intelligence and reliable forecasts tailored to emerging regional needs.
Yes, we provide customisation as per your requirements. To learn more, feel free to contact us on sales@6wresearch.com
1 Executive Summary |
2 Introduction |
2.1 Key Highlights of the Report |
2.2 Report Description |
2.3 Market Scope & Segmentation |
2.4 Research Methodology |
2.5 Assumptions |
3 Australia Fish Processing Market Overview |
3.1 Australia Country Macro Economic Indicators |
3.2 Australia Fish Processing Market Revenues & Volume, 2022 & 2032F |
3.3 Australia Fish Processing Market - Industry Life Cycle |
3.4 Australia Fish Processing Market - Porter's Five Forces |
3.5 Australia Fish Processing Market Revenues & Volume Share, By Source, 2022 & 2032F |
3.6 Australia Fish Processing Market Revenues & Volume Share, By Application, 2022 & 2032F |
3.7 Australia Fish Processing Market Revenues & Volume Share, By Processing, 2022 & 2032F |
3.8 Australia Fish Processing Market Revenues & Volume Share, By Equipment, 2022 & 2032F |
4 Australia Fish Processing Market Dynamics |
4.1 Impact Analysis |
4.2 Market Drivers |
4.2.1 Increasing consumer demand for healthy and sustainable seafood products |
4.2.2 Growing awareness about the nutritional benefits of fish consumption |
4.2.3 Government initiatives promoting the growth of the seafood industry in Australia |
4.3 Market Restraints |
4.3.1 Fluctuating fish stock levels due to environmental factors |
4.3.2 Stringent regulations and compliance requirements in the fish processing industry |
4.3.3 Competition from imported fish products in the Australian market |
5 Australia Fish Processing Market Trends |
6 Australia Fish Processing Market, By Types |
6.1 Australia Fish Processing Market, By Source |
6.1.1 Overview and Analysis |
6.1.2 Australia Fish Processing Market Revenues & Volume, By Source, 2022-2032F |
6.1.3 Australia Fish Processing Market Revenues & Volume, By Marine, 2022-2032F |
6.1.4 Australia Fish Processing Market Revenues & Volume, By Inland, 2022-2032F |
6.1.5 Australia Fish Processing Market Revenues & Volume, By Freshwater, 2022-2032F |
6.2 Australia Fish Processing Market, By Application |
6.2.1 Overview and Analysis |
6.2.2 Australia Fish Processing Market Revenues & Volume, By Food, 2022-2032F |
6.2.3 Australia Fish Processing Market Revenues & Volume, By Feed, 2022-2032F |
6.2.4 Australia Fish Processing Market Revenues & Volume, By Biomedical, 2022-2032F |
6.2.5 Australia Fish Processing Market Revenues & Volume, By Others, 2022-2032F |
6.3 Australia Fish Processing Market, By Processing |
6.3.1 Overview and Analysis |
6.3.2 Australia Fish Processing Market Revenues & Volume, By Frozen, 2022-2032F |
6.3.3 Australia Fish Processing Market Revenues & Volume, By Preserved, 2022-2032F |
6.3.4 Australia Fish Processing Market Revenues & Volume, By Others, 2022-2032F |
6.4 Australia Fish Processing Market, By Equipment |
6.4.1 Overview and Analysis |
6.4.2 Australia Fish Processing Market Revenues & Volume, By Gutting, 2022-2032F |
6.4.3 Australia Fish Processing Market Revenues & Volume, By Scaling, 2022-2032F |
6.4.4 Australia Fish Processing Market Revenues & Volume, By Filleting, 2022-2032F |
6.4.5 Australia Fish Processing Market Revenues & Volume, By Deboning, 2022-2032F |
6.4.6 Australia Fish Processing Market Revenues & Volume, By Skinning, 2022-2032F |
6.4.7 Australia Fish Processing Market Revenues & Volume, By Curing & Smoking, 2022-2032F |
7 Australia Fish Processing Market Import-Export Trade Statistics |
7.1 Australia Fish Processing Market Export to Major Countries |
7.2 Australia Fish Processing Market Imports from Major Countries |
8 Australia Fish Processing Market Key Performance Indicators |
8.1 Average processing time per unit of fish |
8.2 Percentage of fish waste generated during processing |
8.3 Number of new product developments in the fish processing sector |
8.4 Average energy consumption per unit of fish processed |
8.5 Percentage of revenue allocated to research and development in fish processing techniques |
9 Australia Fish Processing Market - Opportunity Assessment |
9.1 Australia Fish Processing Market Opportunity Assessment, By Source, 2022 & 2032F |
9.2 Australia Fish Processing Market Opportunity Assessment, By Application, 2022 & 2032F |
9.3 Australia Fish Processing Market Opportunity Assessment, By Processing, 2022 & 2032F |
9.4 Australia Fish Processing Market Opportunity Assessment, By Equipment, 2022 & 2032F |
10 Australia Fish Processing Market - Competitive Landscape |
10.1 Australia Fish Processing Market Revenue Share, By Companies, 2025 |
10.2 Australia Fish Processing Market Competitive Benchmarking, By Operating and Technical Parameters |
11 Company Profiles |
12 Recommendations |
13 Disclaimer |
Global Go To Market Strategy - 2030
Export potential enables firms to identify high-growth global markets with greater confidence by combining advanced trade intelligence with a structured quantitative methodology. The framework analyzes emerging demand trends and country-level import patterns while integrating macroeconomic and trade datasets such as GDP and population forecasts, bilateral import–export flows, tariff structures, elasticity differentials between developed and developing economies, geographic distance, and import demand projections. Using weighted trade values from 2020–2024 as the base period to project country-to-country export potential for 2030, these inputs are operationalized through calculated drivers such as gravity model parameters, tariff impact factors, and projected GDP per-capita growth. Through an analysis of hidden potentials, demand hotspots, and market conditions that are most favorable to success, this method enables firms to focus on target countries, maximize returns, and global expansion with data, backed by accuracy.
By factoring in the projected importer demand gap that is currently unmet and could be potential opportunity, it identifies the potential for the Exporter (Country) among 190 countries, against the general trade analysis, which identifies the biggest importer or exporter.
To discover high-growth global markets and optimize your business strategy:
Click Here
Pricing
- Single User License$ 1,995
- Department License$ 2,400
- Site License$ 3,120
- Global License$ 3,795

Leadership Perspectives from Industry Events
Search
Thought Leadership and Analyst Meet


Our Clients
6WResearch In News
- Smartphones Lead India's Exports potential at $94 Billion by 2031 — But $30.1 Billion in Untapped Markets Is the Real Story
- India Air Conditioner Market Set for Strong Rebound in 2026 After Weather-Led Correction and GST-Driven Recovery: 6Wresearch
- ADAS in India: How Automatic Emergency Braking, Blind Spot Detection & Driver Monitoring are Transforming Road Safety
- Doha a strategic location for EV manufacturing hub: IPA Qatar
- Demand for luxury TVs surging in the GCC, says Samsung
- Empowering Growth: The Thriving Journey of Bangladesh’s Cable Industry
Latest Reports
- Gabon Citrullinemia Type-1 Market (2026-2032)
- Finland Citrullinemia Type-1 Market (2026-2032)
- Fiji Citrullinemia Type-1 Market (2026-2032)
- Ethiopia Citrullinemia Type-1 Market (2026-2032)
- Estonia Citrullinemia Type-1 Market (2026-2032)
- Eritrea Citrullinemia Type-1 Market (2026-2032)
- Equatorial Guinea Citrullinemia Type-1 Market (2026-2032)
- El Salvador Citrullinemia Type-1 Market (2026-2032)
- Ecuador Citrullinemia Type-1 Market (2026-2032)
- Dominica Citrullinemia Type-1 Market (2026-2032)
Industry Events and Analyst Meet

EV India Expo 2026

HIMTEX 2026

India Refining Summit 2026

India EV Show 2026

EV tech India Expo 2026
Whitepaper
- Middle East & Africa Commercial Security Market Click here to view more.
- Middle East & Africa Fire Safety Systems & Equipment Market Click here to view more.
- GCC Drone Market Click here to view more.
- Middle East Lighting Fixture Market Click here to view more.
- GCC Physical & Perimeter Security Market Click here to view more.