Australia Fishing Sinker Market (2026-2032) Outlook | Forecast, Size, Share, Revenue, Growth, Trends, Value, Analysis, Industry & Companies
Market Forecast By Products (Pyramid sinkers, Barrel or egg sinkers, Split-shot sinkers, Bullet sinkers, Dipsey, Bank sinker, Claw sinker, Others), By Applications (Shallow water, Deep water) And Competitive Landscape
| Product Code: ETC229775 | Publication Date: Aug 2022 | Updated Date: Mar 2026 | Product Type: Market Research Report | |
| Publisher: 6Wresearch | Author: Ravi Bhandari | No. of Pages: 75 | No. of Figures: 35 | No. of Tables: 20 |
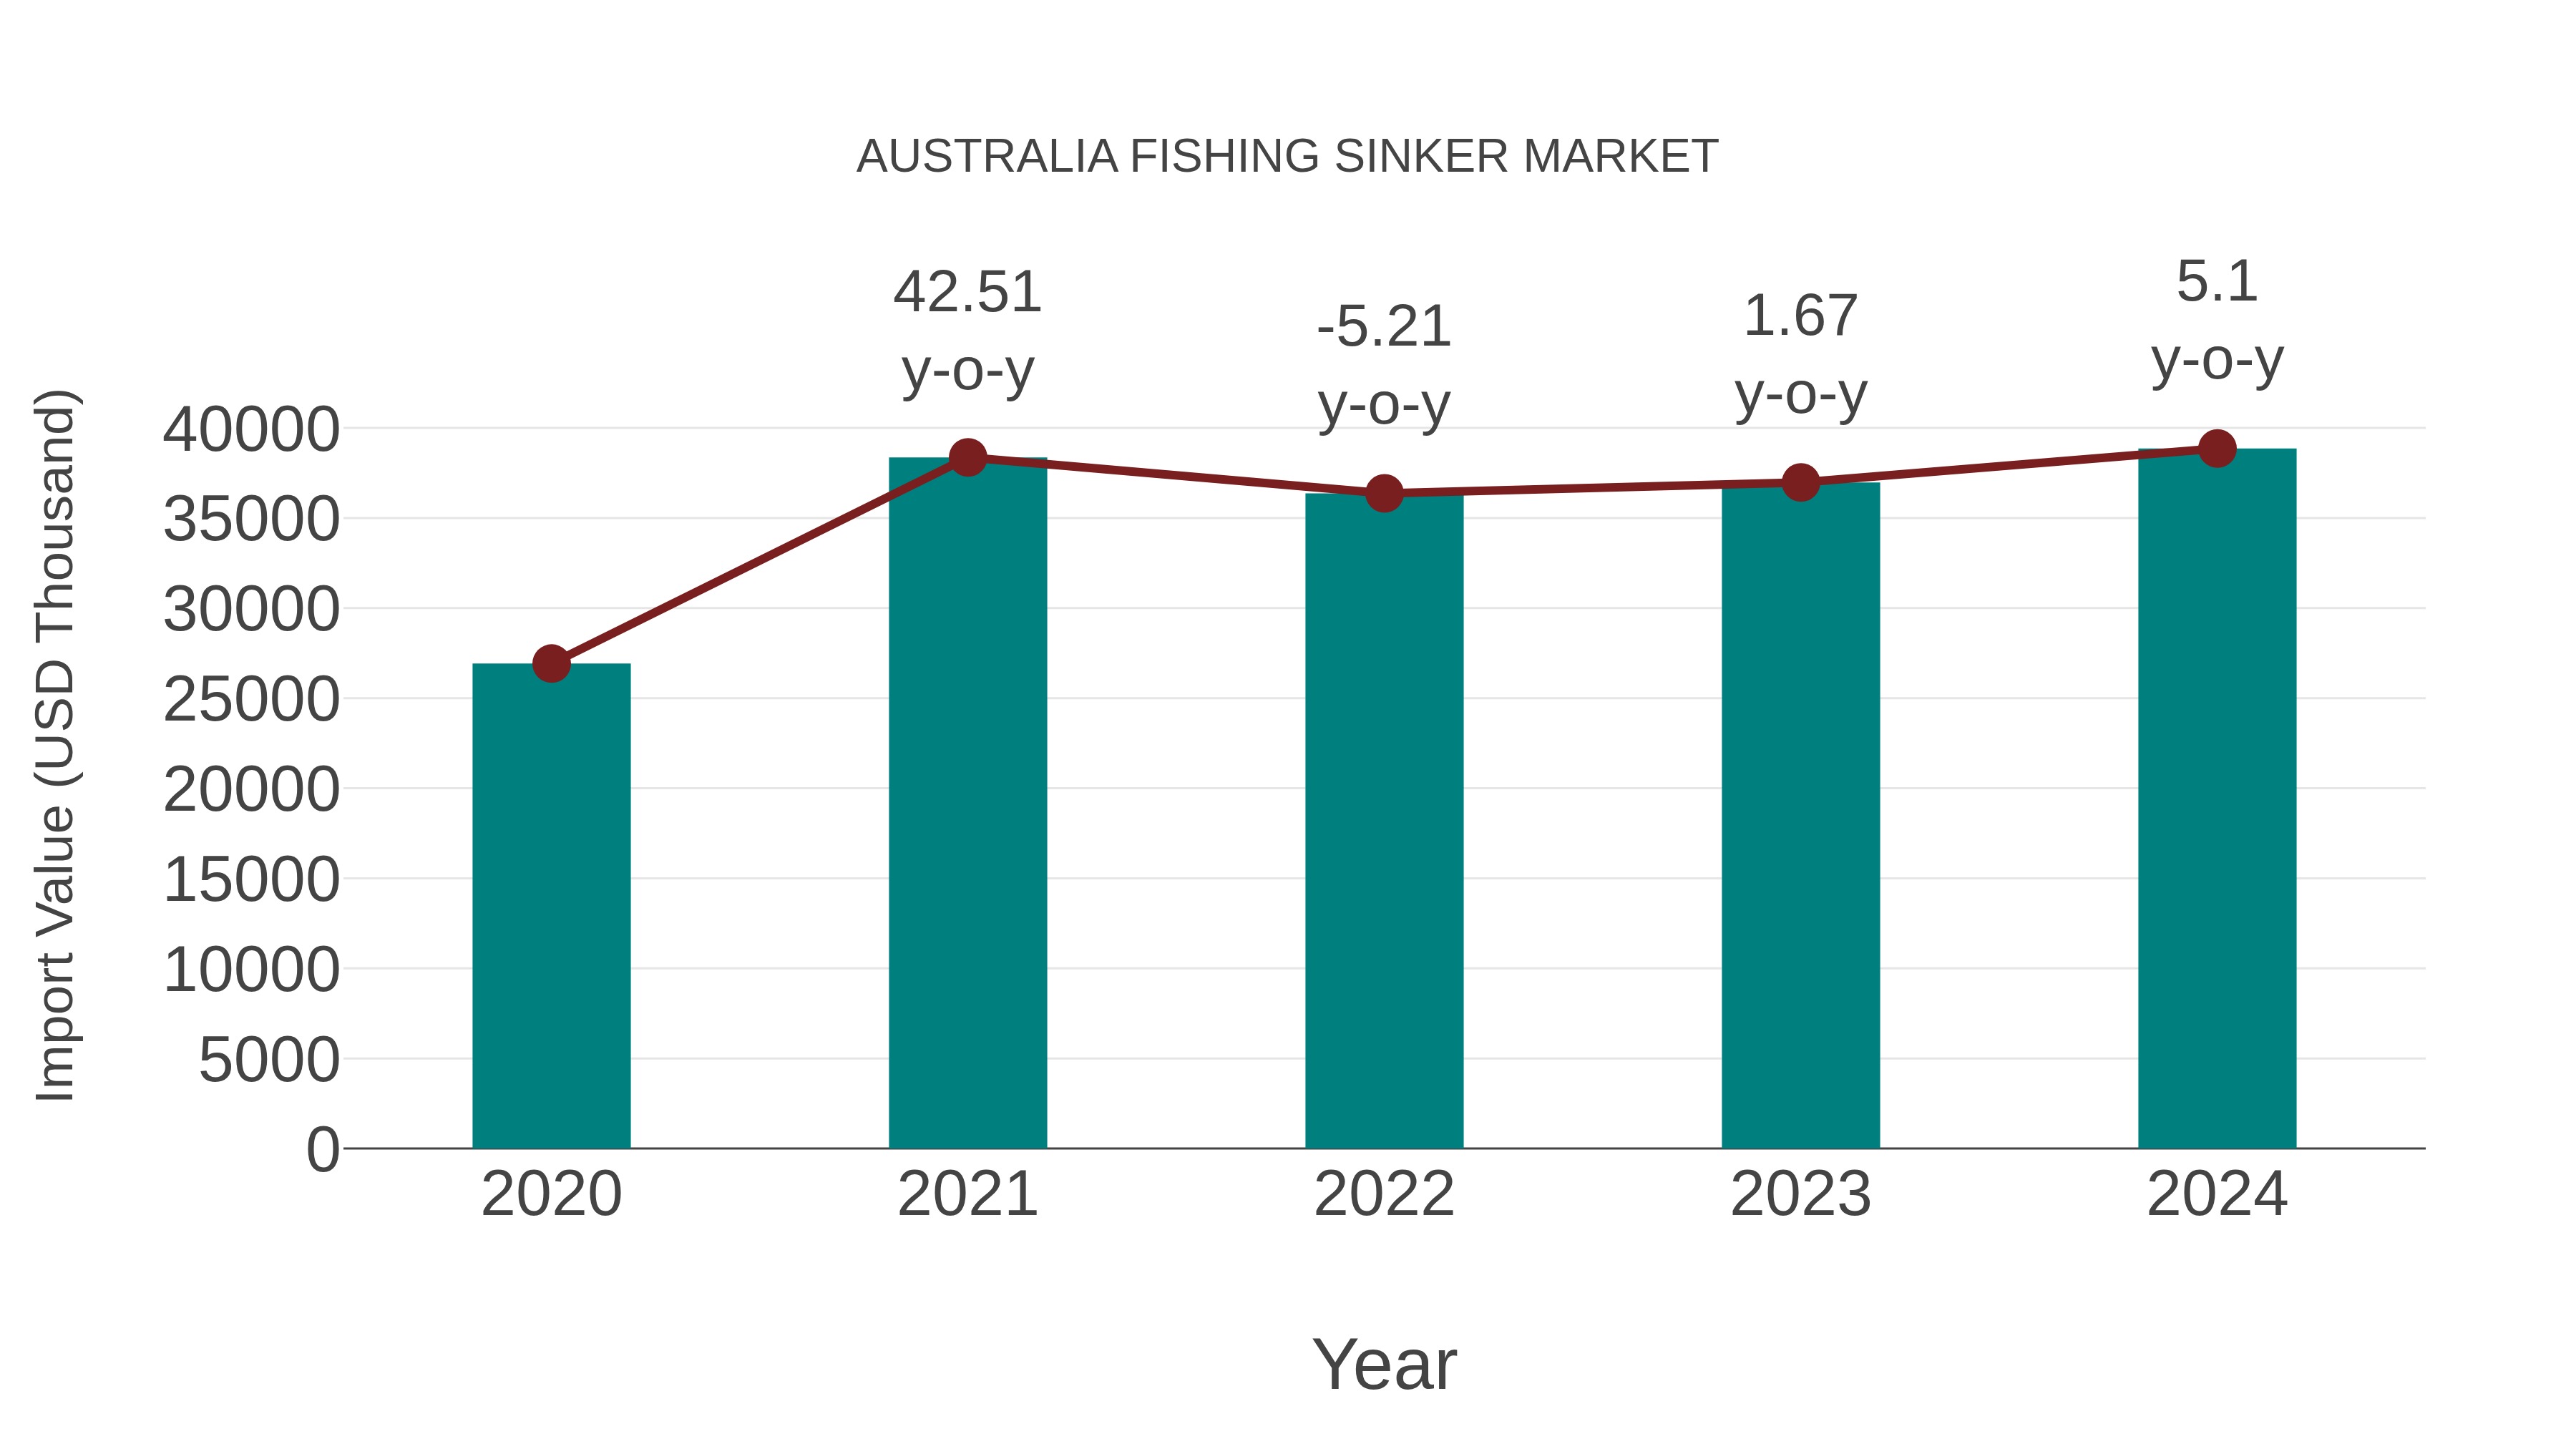
Australia Fishing Sinker Market: Import Trend Analysis
Australia`s import trend for the fishing sinker market showed a growth rate of 5.1% from 2023 to 2024, with a compound annual growth rate (CAGR) of 9.61% for the period 2020-2024. The positive import momentum can be attributed to a steady demand shift towards high-quality fishing equipment, indicating market stability and sustained consumer interest in fishing products during this period.
Australia Fishing Sinker Market Overview
Fishing sinkers play a crucial role in anchoring fishing rigs and bait at the desired depth, and the Australia market for fishing sinkers offers a diverse range of options to suit various fishing conditions and preferences. Sinkers come in different shapes, sizes, and weights, including split shot, egg sinkers, and pyramid sinkers, providing anglers with flexibility and control over their fishing presentations.
Drivers of the market
The Australia fishing sinker market is influenced by the preferences of anglers for sinkers that provide optimal weight, shape, and material composition to achieve desired casting depth and presentation. Technological advancements in sinker design, such as eco-friendly materials and streamlined shapes, address environmental concerns and improve fishing efficiency, driving market expansion.
Challenges of the market
The Australia fishing sinker market faces challenges related to environmental concerns over lead pollution in water bodies, leading to increased demand for non-toxic alternatives. Additionally, fluctuations in metal prices and the need for innovative sinker designs pose challenges for manufacturers and distributors in this segment.
Government Policy of the market
Government policies in Australia concerning the fishing sinker market primarily focus on environmental conservation and public health. Regulations are in place to restrict the use of toxic materials in sinker manufacturing to prevent contamination of water bodies and harm to aquatic life. Moreover, there are initiatives to promote the use of biodegradable or non-toxic sinkers to mitigate environmental impact. The government also collaborates with industry stakeholders to raise awareness about the importance of responsible fishing practices and the proper disposal of fishing gear to minimize pollution in marine environments. These policies aim to foster a sustainable fishing sinker market in Australia while preserving the integrity of aquatic ecosystems.
Key Highlights of the Report:
- Australia Fishing Sinker Market Outlook
- Market Size of Australia Fishing Sinker Market, 2025
- Forecast of Australia Fishing Sinker Market, 2032
- Historical Data and Forecast of Australia Fishing Sinker Revenues & Volume for the Period 2022-2032F
- Australia Fishing Sinker Market Trend Evolution
- Australia Fishing Sinker Market Drivers and Challenges
- Australia Fishing Sinker Price Trends
- Australia Fishing Sinker Porter's Five Forces
- Australia Fishing Sinker Industry Life Cycle
- Historical Data and Forecast of Australia Fishing Sinker Market Revenues & Volume By Products for the Period 2022-2032F
- Historical Data and Forecast of Australia Fishing Sinker Market Revenues & Volume By Pyramid sinkers for the Period 2022-2032F
- Historical Data and Forecast of Australia Fishing Sinker Market Revenues & Volume By Barrel or egg sinkers for the Period 2022-2032F
- Historical Data and Forecast of Australia Fishing Sinker Market Revenues & Volume By Split-shot sinkers for the Period 2022-2032F
- Historical Data and Forecast of Australia Fishing Sinker Market Revenues & Volume By Bullet sinkers for the Period 2022-2032F
- Historical Data and Forecast of Australia Fishing Sinker Market Revenues & Volume By Dipsey for the Period 2022-2032F
- Historical Data and Forecast of Australia Fishing Sinker Market Revenues & Volume By Bank sinker for the Period 2022-2032F
- Historical Data and Forecast of Australia Fishing Sinker Market Revenues & Volume By Claw sinker for the Period 2022-2032F
- Historical Data and Forecast of Australia Pyramid sinkers Fishing Sinker Market Revenues & Volume By Others for the Period 2022-2032F
- Historical Data and Forecast of Australia Fishing Sinker Market Revenues & Volume By Applications for the Period 2022-2032F
- Historical Data and Forecast of Australia Fishing Sinker Market Revenues & Volume By Shallow water for the Period 2022-2032F
- Historical Data and Forecast of Australia Fishing Sinker Market Revenues & Volume By Deep water for the Period 2022-2032F
- Australia Fishing Sinker Import Export Trade Statistics
- Market Opportunity Assessment By Products
- Market Opportunity Assessment By Applications
- Australia Fishing Sinker Top Companies Market Share
- Australia Fishing Sinker Competitive Benchmarking By Technical and Operational Parameters
- Australia Fishing Sinker Company Profiles
- Australia Fishing Sinker Key Strategic Recommendations
Australia Fishing Sinker Market (2026-2032): FAQs
6Wresearch actively monitors the Australia Fishing Sinker Market and publishes its comprehensive annual report, highlighting emerging trends, growth drivers, revenue analysis, and forecast outlook. Our insights help businesses to make data-backed strategic decisions with ongoing market dynamics. Our analysts track relevent industries related to the Australia Fishing Sinker Market, allowing our clients with actionable intelligence and reliable forecasts tailored to emerging regional needs.
Yes, we provide customisation as per your requirements. To learn more, feel free to contact us on sales@6wresearch.com
1 Executive Summary |
2 Introduction |
2.1 Key Highlights of the Report |
2.2 Report Description |
2.3 Market Scope & Segmentation |
2.4 Research Methodology |
2.5 Assumptions |
3 Australia Fishing Sinker Market Overview |
3.1 Australia Country Macro Economic Indicators |
3.2 Australia Fishing Sinker Market Revenues & Volume, 2022 & 2032F |
3.3 Australia Fishing Sinker Market - Industry Life Cycle |
3.4 Australia Fishing Sinker Market - Porter's Five Forces |
3.5 Australia Fishing Sinker Market Revenues & Volume Share, By Products, 2022 & 2032F |
3.6 Australia Fishing Sinker Market Revenues & Volume Share, By Applications, 2022 & 2032F |
4 Australia Fishing Sinker Market Dynamics |
4.1 Impact Analysis |
4.2 Market Drivers |
4.2.1 Increasing interest in recreational fishing activities in Australia |
4.2.2 Growth in disposable income leading to higher spending on fishing gear |
4.2.3 Technological advancements in fishing sinker materials and designs |
4.3 Market Restraints |
4.3.1 Environmental concerns leading to regulations on certain fishing sinker materials |
4.3.2 Competition from alternative fishing methods or equipment |
5 Australia Fishing Sinker Market Trends |
6 Australia Fishing Sinker Market, By Types |
6.1 Australia Fishing Sinker Market, By Products |
6.1.1 Overview and Analysis |
6.1.2 Australia Fishing Sinker Market Revenues & Volume, By Products, 2022-2032F |
6.1.3 Australia Fishing Sinker Market Revenues & Volume, By Pyramid sinkers, 2022-2032F |
6.1.4 Australia Fishing Sinker Market Revenues & Volume, By Barrel or egg sinkers, 2022-2032F |
6.1.5 Australia Fishing Sinker Market Revenues & Volume, By Split-shot sinkers, 2022-2032F |
6.1.6 Australia Fishing Sinker Market Revenues & Volume, By Bullet sinkers, 2022-2032F |
6.1.7 Australia Fishing Sinker Market Revenues & Volume, By Dipsey, 2022-2032F |
6.1.8 Australia Fishing Sinker Market Revenues & Volume, By Bank sinker, 2022-2032F |
6.1.9 Australia Fishing Sinker Market Revenues & Volume, By Others, 2022-2032F |
6.1.10 Australia Fishing Sinker Market Revenues & Volume, By Others, 2022-2032F |
6.2 Australia Fishing Sinker Market, By Applications |
6.2.1 Overview and Analysis |
6.2.2 Australia Fishing Sinker Market Revenues & Volume, By Shallow water, 2022-2032F |
6.2.3 Australia Fishing Sinker Market Revenues & Volume, By Deep water, 2022-2032F |
7 Australia Fishing Sinker Market Import-Export Trade Statistics |
7.1 Australia Fishing Sinker Market Export to Major Countries |
7.2 Australia Fishing Sinker Market Imports from Major Countries |
8 Australia Fishing Sinker Market Key Performance Indicators |
8.1 Average price of fishing sinkers |
8.2 Number of fishing licenses issued in Australia |
8.3 Frequency of fishing events or tournaments held in Australia |
9 Australia Fishing Sinker Market - Opportunity Assessment |
9.1 Australia Fishing Sinker Market Opportunity Assessment, By Products, 2022 & 2032F |
9.2 Australia Fishing Sinker Market Opportunity Assessment, By Applications, 2022 & 2032F |
10 Australia Fishing Sinker Market - Competitive Landscape |
10.1 Australia Fishing Sinker Market Revenue Share, By Companies, 2025 |
10.2 Australia Fishing Sinker Market Competitive Benchmarking, By Operating and Technical Parameters |
11 Company Profiles |
12 Recommendations |
13 Disclaimer |
Global Go To Market Strategy - 2030
Export potential enables firms to identify high-growth global markets with greater confidence by combining advanced trade intelligence with a structured quantitative methodology. The framework analyzes emerging demand trends and country-level import patterns while integrating macroeconomic and trade datasets such as GDP and population forecasts, bilateral import–export flows, tariff structures, elasticity differentials between developed and developing economies, geographic distance, and import demand projections. Using weighted trade values from 2020–2024 as the base period to project country-to-country export potential for 2030, these inputs are operationalized through calculated drivers such as gravity model parameters, tariff impact factors, and projected GDP per-capita growth. Through an analysis of hidden potentials, demand hotspots, and market conditions that are most favorable to success, this method enables firms to focus on target countries, maximize returns, and global expansion with data, backed by accuracy.
By factoring in the projected importer demand gap that is currently unmet and could be potential opportunity, it identifies the potential for the Exporter (Country) among 190 countries, against the general trade analysis, which identifies the biggest importer or exporter.
To discover high-growth global markets and optimize your business strategy:
Click Here
Pricing
- Single User License$ 1,995
- Department License$ 2,400
- Site License$ 3,120
- Global License$ 3,795

Leadership Perspectives from Industry Events
Search
Thought Leadership and Analyst Meet


Our Clients
6WResearch In News
- India Air Conditioner Market Set for Strong Rebound in 2026 After Weather-Led Correction and GST-Driven Recovery: 6Wresearch
- ADAS in India: How Automatic Emergency Braking, Blind Spot Detection & Driver Monitoring are Transforming Road Safety
- Doha a strategic location for EV manufacturing hub: IPA Qatar
- Demand for luxury TVs surging in the GCC, says Samsung
- Empowering Growth: The Thriving Journey of Bangladesh’s Cable Industry
- Demand for luxury TVs surging in the GCC, says Samsung
Latest Reports
- Nicaragua RPG Gaming Market (2026-2032)
- New Zealand RPG Gaming Market (2026-2032)
- Netherlands RPG Gaming Market (2026-2032)
- Nauru RPG Gaming Market (2026-2032)
- Namibia RPG Gaming Market (2026-2032)
- Mozambique RPG Gaming Market (2026-2032)
- Montenegro RPG Gaming Market (2026-2032)
- Mongolia RPG Gaming Market (2026-2032)
- Monaco RPG Gaming Market (2026-2032)
- Micronesia RPG Gaming Market (2026-2032)
Industry Events and Analyst Meet

HIMTEX 2026

India Refining Summit 2026

India EV Show 2026

EV tech India Expo 2026

Auto Tech Asia 2026
Whitepaper
- Middle East & Africa Commercial Security Market Click here to view more.
- Middle East & Africa Fire Safety Systems & Equipment Market Click here to view more.
- GCC Drone Market Click here to view more.
- Middle East Lighting Fixture Market Click here to view more.
- GCC Physical & Perimeter Security Market Click here to view more.