Australia Flavoured Table Butter Market (2026-2032) | Value, Forecast, Trends, Share, Segmentation, Analysis, Outlook, Industry, Companies, Size & Revenue, Growth, Competitive Landscape
Market Forecast By Nature (Organic, Convectional), By Format (Spreadable, Non-spreadable), By End user (Household, Retail, Horeca), By Distribution channel (Store based retailing, Online retailing), By Product Type (Salted, Unsalted) And Competitive Landscape
| Product Code: ETC6180837 | Publication Date: Sep 2024 | Updated Date: Mar 2026 | Product Type: Market Research Report | |
| Publisher: 6Wresearch | Author: Ravi Bhandari | No. of Pages: 75 | No. of Figures: 35 | No. of Tables: 20 |
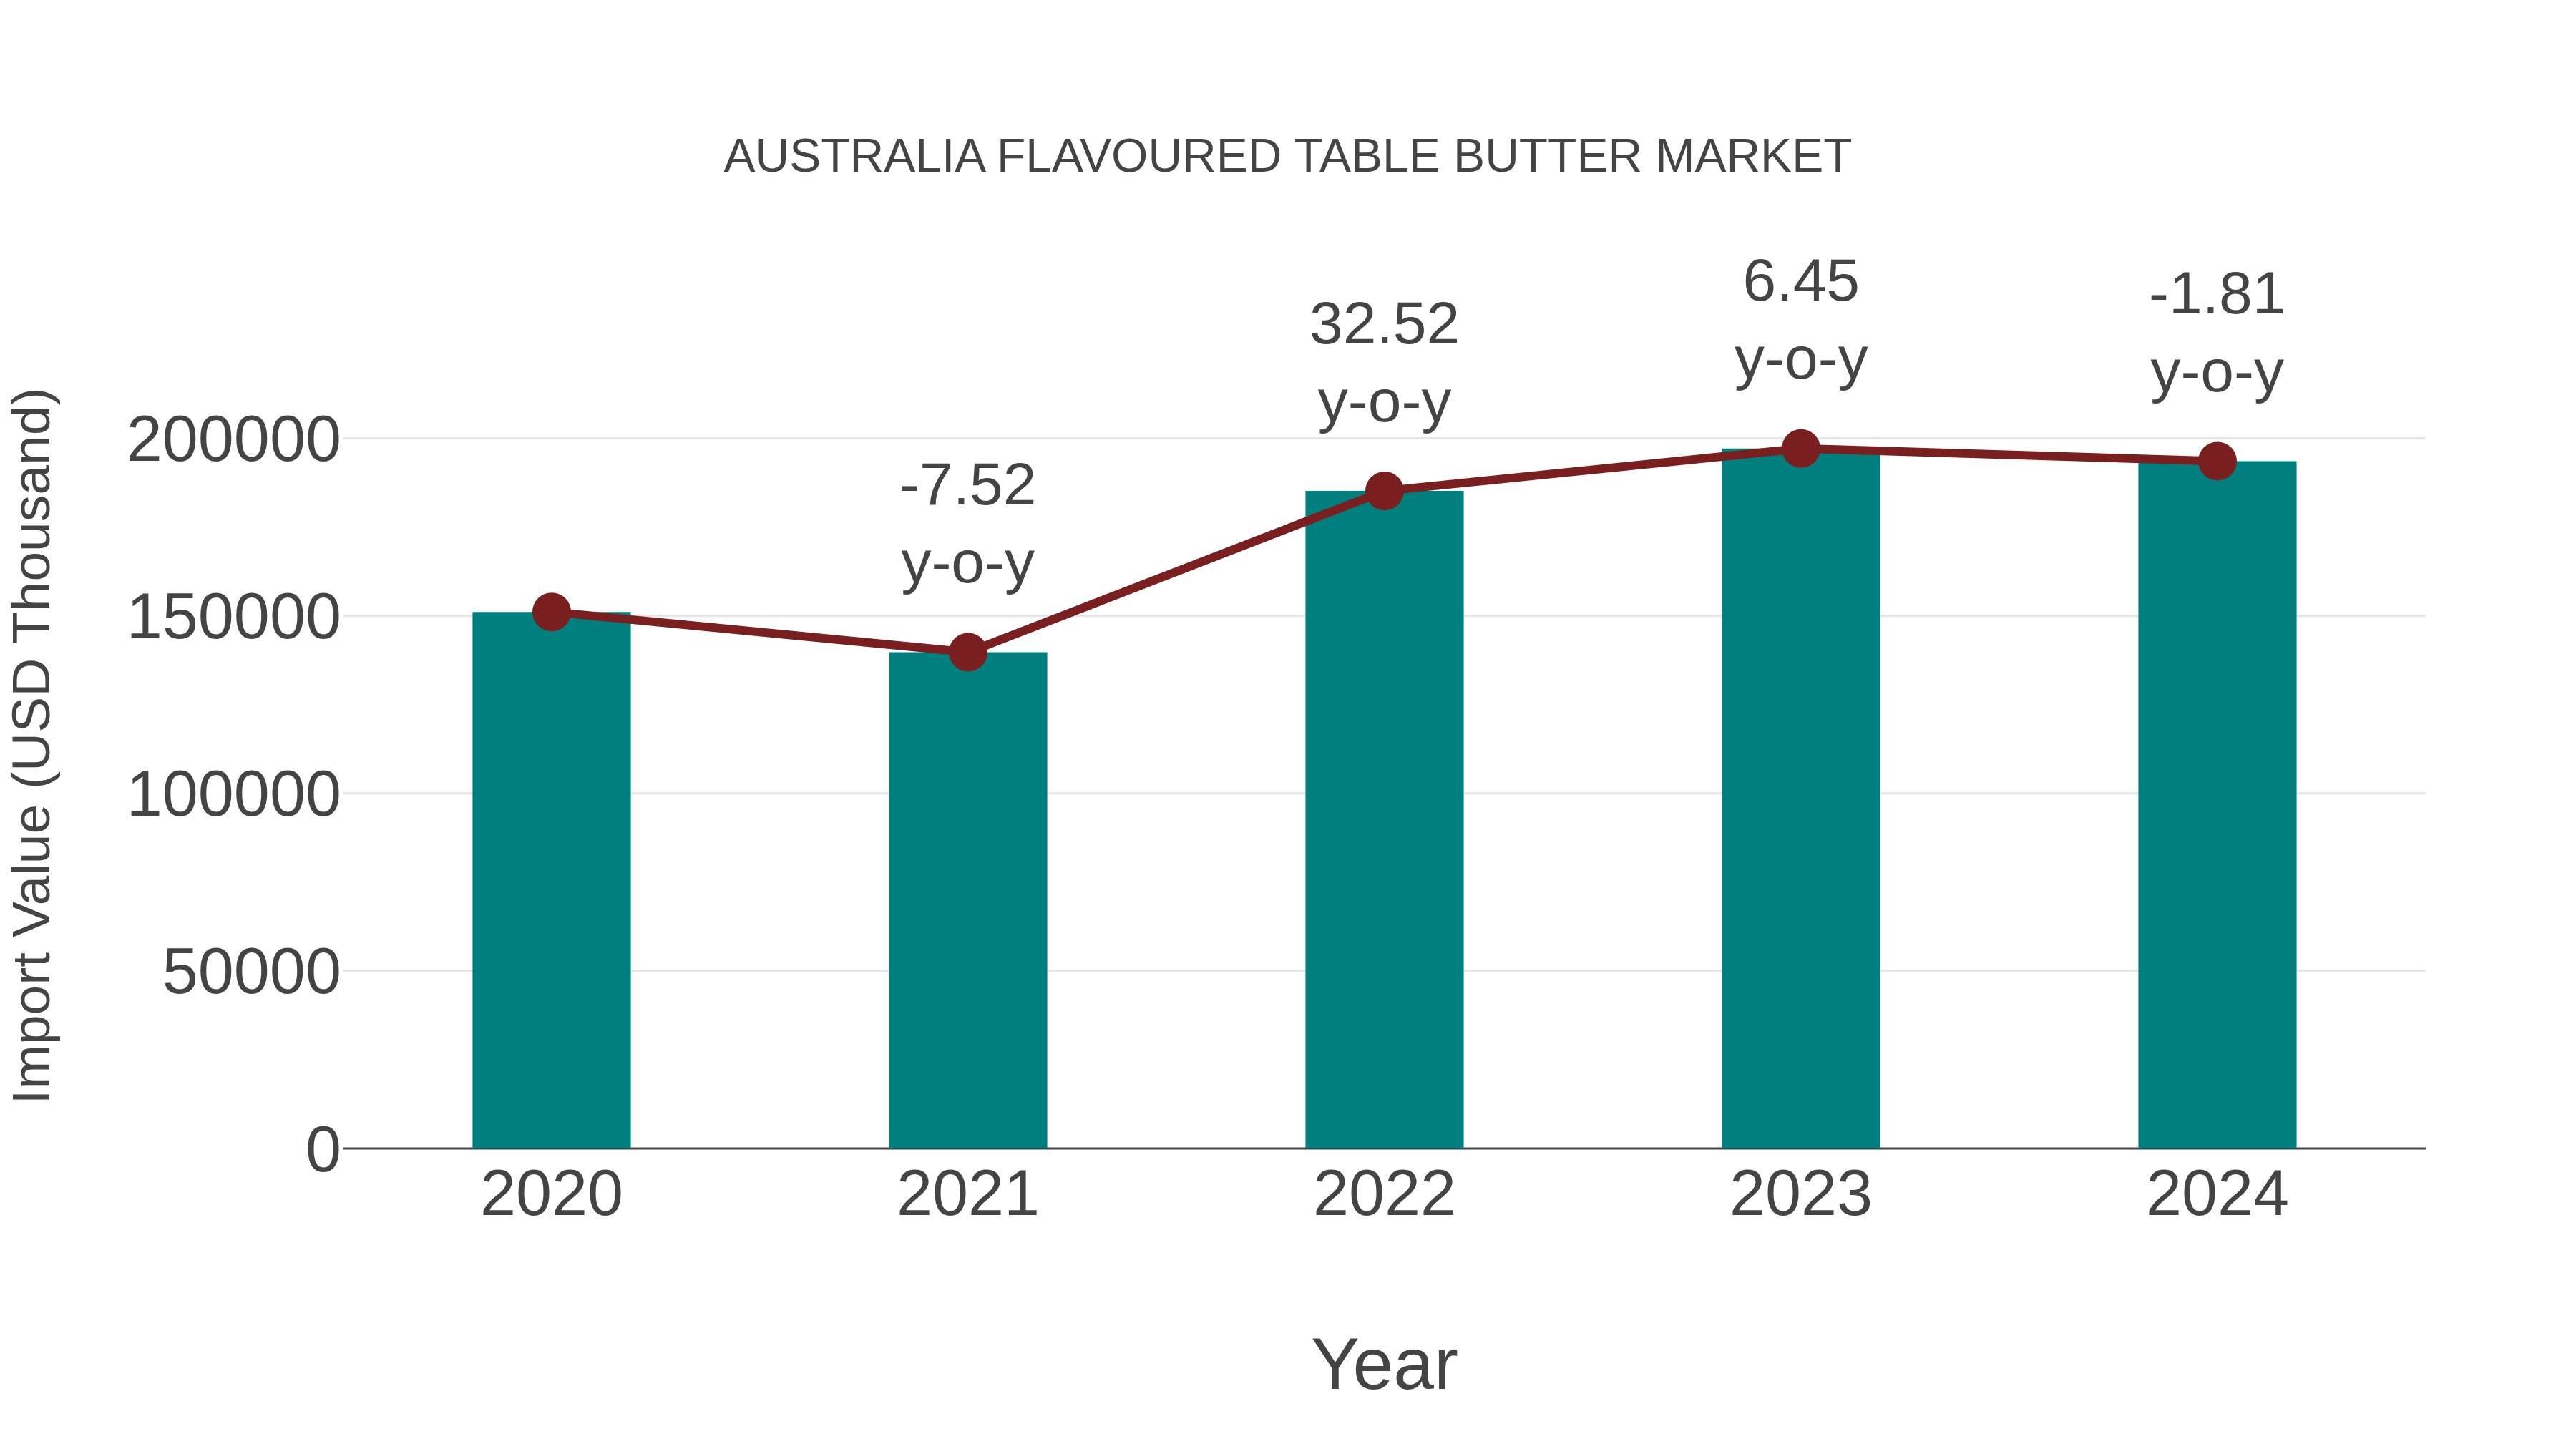
Australia Flavoured Table Butter Market: Import Trend Analysis
In 2024, Australia`s import trend for Australia-flavored table butter experienced a growth rate of -1.81%, contrasting with the 6.39% compound annual growth rate (CAGR) recorded from 2020 to 2023. This decline in import momentum from 2023 to 2024 could be attributed to shifting consumer preferences, changes in trade policies, or market saturation.
Australia Flavoured Table Butter Market Overview
Similar to flavored butter, the flavoured table butter market focuses on enhancing everyday butter with added taste profiles such as garlic, herbs, or honey. This segment targets consumers looking for ready-to-use spreads that combine convenience with gourmet appeal. The market benefits from trends in home cooking and food personalization, with a growing emphasis on natural ingredients and clean labeling.
Trends of the market
Flavoured table butter in Australia is growing steadily as consumers embrace culinary customization. Popular flavors include honey, garlic, and herb-infused varieties. The trend is reinforced by increasing gourmet food consumption and interest in premium dairy products at retail and foodservice levels.
Challenges of the market
Flavored table butter producers contend with increasing input costs and seasonal variability in dairy supply. Consumer preference for plant-based alternatives and health concerns over saturated fats also impact demand. Preserving the delicate balance of flavor, fat content, and shelf life remains a manufacturing challenge.
Investment opportunities in the Market
Similar to the flavored butter market, the flavored table butter segment offers opportunities in product innovation and premiumization. Investors can introduce novel flavors that complement Australian culinary preferences while focusing on natural ingredients. There is potential in targeting foodservice sectors, especially bakeries and cafes, for bulk supply contracts. Enhanced packaging designs aimed at convenience and freshness can also drive consumer uptake.
Government Policy of the market
Similar to flavored butter, the flavoured table butter market is tightly regulated through dairy standards and food safety laws administered by FSANZ and the Department of Agriculture. Policies focus on maintaining product purity, ensuring accurate labeling, and controlling the use of flavor additives. The government supports local dairy production through subsidies and export incentives, and enforces regulations on importation to protect domestic industry. Consumer protection laws also address allergen declarations and nutritional claims.
Key Highlights of the Report:
- Australia Flavoured Table Butter Market Outlook
- Market Size of Australia Flavoured Table Butter Market, 2025
- Forecast of Australia Flavoured Table Butter Market, 2032
- Historical Data and Forecast of Australia Flavoured Table Butter Revenues & Volume for the Period 2022 - 2032F
- Australia Flavoured Table Butter Market Trend Evolution
- Australia Flavoured Table Butter Market Drivers and Challenges
- Australia Flavoured Table Butter Price Trends
- Australia Flavoured Table Butter Porter's Five Forces
- Australia Flavoured Table Butter Industry Life Cycle
- Historical Data and Forecast of Australia Flavoured Table Butter Market Revenues & Volume By Nature for the Period 2022 - 2032F
- Historical Data and Forecast of Australia Flavoured Table Butter Market Revenues & Volume By Organic for the Period 2022 - 2032F
- Historical Data and Forecast of Australia Flavoured Table Butter Market Revenues & Volume By Convectional for the Period 2022 - 2032F
- Historical Data and Forecast of Australia Flavoured Table Butter Market Revenues & Volume By Format for the Period 2022 - 2032F
- Historical Data and Forecast of Australia Flavoured Table Butter Market Revenues & Volume By Spreadable for the Period 2022 - 2032F
- Historical Data and Forecast of Australia Flavoured Table Butter Market Revenues & Volume By Non-spreadable for the Period 2022 - 2032F
- Historical Data and Forecast of Australia Flavoured Table Butter Market Revenues & Volume By End user for the Period 2022 - 2032F
- Historical Data and Forecast of Australia Flavoured Table Butter Market Revenues & Volume By Household for the Period 2022 - 2032F
- Historical Data and Forecast of Australia Flavoured Table Butter Market Revenues & Volume By Retail for the Period 2022 - 2032F
- Historical Data and Forecast of Australia Flavoured Table Butter Market Revenues & Volume By Horeca for the Period 2022 - 2032F
- Historical Data and Forecast of Australia Flavoured Table Butter Market Revenues & Volume By Distribution channel for the Period 2022 - 2032F
- Historical Data and Forecast of Australia Flavoured Table Butter Market Revenues & Volume By Store based retailing for the Period 2022 - 2032F
- Historical Data and Forecast of Australia Flavoured Table Butter Market Revenues & Volume By Online retailing for the Period 2022 - 2032F
- Historical Data and Forecast of Australia Flavoured Table Butter Market Revenues & Volume By Product Type for the Period 2022 - 2032F
- Historical Data and Forecast of Australia Flavoured Table Butter Market Revenues & Volume By Salted for the Period 2022 - 2032F
- Historical Data and Forecast of Australia Flavoured Table Butter Market Revenues & Volume By Unsalted for the Period 2022 - 2032F
- Australia Flavoured Table Butter Import Export Trade Statistics
- Market Opportunity Assessment By Nature
- Market Opportunity Assessment By Format
- Market Opportunity Assessment By End user
- Market Opportunity Assessment By Distribution channel
- Market Opportunity Assessment By Product Type
- Australia Flavoured Table Butter Top Companies Market Share
- Australia Flavoured Table Butter Competitive Benchmarking By Technical and Operational Parameters
- Australia Flavoured Table Butter Company Profiles
- Australia Flavoured Table Butter Key Strategic Recommendations
Australia Flavoured Table Butter Market (2026-2032): FAQs
6Wresearch actively monitors the Australia Flavoured Table Butter Market and publishes its comprehensive annual report, highlighting emerging trends, growth drivers, revenue analysis, and forecast outlook. Our insights help businesses to make data-backed strategic decisions with ongoing market dynamics. Our analysts track relevent industries related to the Australia Flavoured Table Butter Market, allowing our clients with actionable intelligence and reliable forecasts tailored to emerging regional needs.
Yes, we provide customisation as per your requirements. To learn more, feel free to contact us on sales@6wresearch.com
1 Executive Summary |
2 Introduction |
2.1 Key Highlights of the Report |
2.2 Report Description |
2.3 Market Scope & Segmentation |
2.4 Research Methodology |
2.5 Assumptions |
3 Australia Flavoured Table Butter Market Overview |
3.1 Australia Country Macro Economic Indicators |
3.2 Australia Flavoured Table Butter Market Revenues & Volume, 2022 & 2032F |
3.3 Australia Flavoured Table Butter Market - Industry Life Cycle |
3.4 Australia Flavoured Table Butter Market - Porter's Five Forces |
3.5 Australia Flavoured Table Butter Market Revenues & Volume Share, By Nature, 2022 & 2032F |
3.6 Australia Flavoured Table Butter Market Revenues & Volume Share, By Product Type, 2022 & 2032F |
3.7 Australia Flavoured Table Butter Market Revenues & Volume Share, By Format, 2022 & 2032F |
3.8 Australia Flavoured Table Butter Market Revenues & Volume Share, By End-Use, 2022 & 2032F |
3.9 Australia Flavoured Table Butter Market Revenues & Volume Share, By Distribution Channel, 2022 & 2032F |
4 Australia Flavoured Table Butter Market Dynamics |
4.1 Impact Analysis |
4.2 Market Drivers |
4.2.1 Increasing consumer demand for premium and gourmet food products |
4.2.2 Growing popularity of flavored butter as a versatile ingredient in cooking and baking |
4.2.3 Rising health consciousness leading to preference for natural and organic flavorings in butter |
4.3 Market Restraints |
4.3.1 Fluctuations in raw material prices such as cream and flavoring ingredients |
4.3.2 Intense competition from substitute products like margarine and spreads |
4.3.3 Regulatory challenges related to food safety standards and labeling requirements |
5 Australia Flavoured Table Butter Market Trends |
6 Australia Flavoured Table Butter Market, By Types |
6.1 Australia Flavoured Table Butter Market, By Nature |
6.1.1 Overview and Analysis |
6.1.2 Australia Flavoured Table Butter Market Revenues & Volume, By Nature, 2022 - 2032F |
6.1.3 Australia Flavoured Table Butter Market Revenues & Volume, By Organic, 2022 - 2032F |
6.1.4 Australia Flavoured Table Butter Market Revenues & Volume, By Conventional, 2022 - 2032F |
6.2 Australia Flavoured Table Butter Market, By Product Type |
6.2.1 Overview and Analysis |
6.2.2 Australia Flavoured Table Butter Market Revenues & Volume, By Salted, 2022 - 2032F |
6.2.3 Australia Flavoured Table Butter Market Revenues & Volume, By Unsalted, 2022 - 2032F |
6.3 Australia Flavoured Table Butter Market, By Format |
6.3.1 Overview and Analysis |
6.3.2 Australia Flavoured Table Butter Market Revenues & Volume, By Spreadable, 2022 - 2032F |
6.3.3 Australia Flavoured Table Butter Market Revenues & Volume, By Non-Spreadable, 2022 - 2032F |
6.4 Australia Flavoured Table Butter Market, By End-Use |
6.4.1 Overview and Analysis |
6.4.2 Australia Flavoured Table Butter Market Revenues & Volume, By Household/ Retail, 2022 - 2032F |
6.4.3 Australia Flavoured Table Butter Market Revenues & Volume, By Horeca, 2022 - 2032F |
6.5 Australia Flavoured Table Butter Market, By Distribution Channel |
6.5.1 Overview and Analysis |
6.5.2 Australia Flavoured Table Butter Market Revenues & Volume, By Store-Based Retailing, 2022 - 2032F |
6.5.3 Australia Flavoured Table Butter Market Revenues & Volume, By Online Retailing, 2022 - 2032F |
7 Australia Flavoured Table Butter Market Import-Export Trade Statistics |
7.1 Australia Flavoured Table Butter Market Export to Major Countries |
7.2 Australia Flavoured Table Butter Market Imports from Major Countries |
8 Australia Flavoured Table Butter Market Key Performance Indicators |
8.1 Consumer engagement metrics like social media mentions and online reviews of flavored butter products |
8.2 Market trends analysis of new flavor introductions and consumer preferences |
8.3 Supplier performance indicators related to quality and consistency of flavoring ingredients |
9 Australia Flavoured Table Butter Market - Opportunity Assessment |
9.1 Australia Flavoured Table Butter Market Opportunity Assessment, By Nature, 2022 & 2032F |
9.2 Australia Flavoured Table Butter Market Opportunity Assessment, By Product Type, 2022 & 2032F |
9.3 Australia Flavoured Table Butter Market Opportunity Assessment, By Format, 2022 & 2032F |
9.4 Australia Flavoured Table Butter Market Opportunity Assessment, By End-Use, 2022 & 2032F |
9.5 Australia Flavoured Table Butter Market Opportunity Assessment, By Distribution Channel, 2022 & 2032F |
10 Australia Flavoured Table Butter Market - Competitive Landscape |
10.1 Australia Flavoured Table Butter Market Revenue Share, By Companies, 2025 |
10.2 Australia Flavoured Table Butter Market Competitive Benchmarking, By Operating and Technical Parameters |
11 Company Profiles |
12 Recommendations |
13 Disclaimer |
Export potential assessment - trade Analytics for 2030
Export potential enables firms to identify high-growth global markets with greater confidence by combining advanced trade intelligence with a structured quantitative methodology. The framework analyzes emerging demand trends and country-level import patterns while integrating macroeconomic and trade datasets such as GDP and population forecasts, bilateral import–export flows, tariff structures, elasticity differentials between developed and developing economies, geographic distance, and import demand projections. Using weighted trade values from 2020–2024 as the base period to project country-to-country export potential for 2030, these inputs are operationalized through calculated drivers such as gravity model parameters, tariff impact factors, and projected GDP per-capita growth. Through an analysis of hidden potentials, demand hotspots, and market conditions that are most favorable to success, this method enables firms to focus on target countries, maximize returns, and global expansion with data, backed by accuracy.
By factoring in the projected importer demand gap that is currently unmet and could be potential opportunity, it identifies the potential for the Exporter (Country) among 190 countries, against the general trade analysis, which identifies the biggest importer or exporter.
To discover high-growth global markets and optimize your business strategy:
Click Here
Pricing
- Single User License$ 1,995
- Department License$ 2,400
- Site License$ 3,120
- Global License$ 3,795

Search
Thought Leadership and Analyst Meet


Our Clients
Latest Reports
- Canada Cloud CFD Market (2026-2032) | Size & Revenue, Industry, Growth, Competitive Landscape, Forecast, Segmentation, Value, Outlook, Trends, Share, Analysis, Companies
- Taiwan Food Delivery Platform Market (2026-2032) | Companies, Outlook, Analysis, Trends, Value, Revenue, Segmentation, Share, Forecast, Competitive Landscape, Growth, Size & Forecast
- United Kingdom (UK) Long-term Care Insurance Market (2026-2032) | Growth, Share, Consumer Insights, Drivers, Opportunities, Competition, Pricing Analysis, Segments, Restraints, Companies, Competitive, Value, Outlook, Size, Demand, Analysis, Challenges, Strategic Insights, Investment Trends, Revenue, Trends, Supply, Forecast
- United Kingdom (UK) Long Term Care Market (2026-2032) | Companies, Outlook, Analysis, Trends, Value, Revenue, Segmentation, Share, Forecast, Competitive Landscape, Growth, Size & Forecast
- Iraq Insulation and Waterproofing Market (2026-2032) | Outlook, Drivers, Growth, Size, Share, Industry, Revenue, Trends, Demand, Competitive, Strategic Insights, Opportunities, Segments, Companies, Challenges, Strategy, Consumer Insights, Analysis, Investment Trends, Value, Segmentation, Forecast, Restraints
- India Switchgear Market Outlook (2026-2032) | Size, Share, Trends, Growth, Revenue, Forecast, Analysis, Value, Outlook
- Pakistan Contraceptive Implants Market (2025-2031) | Demand, Growth, Size, Share, Industry, Pricing Analysis, Competitive, Strategic Insights, Strategy, Consumer Insights, Analysis, Investment Trends, Opportunities, Revenue, Segments, Value, Segmentation, Supply, Forecast, Restraints, Outlook, Competition, Drivers, Trends, Companies, Challenges
- Sri Lanka Packaging Market (2026-2032) | Outlook, Competition, Drivers, Trends, Demand, Pricing Analysis, Competitive, Strategic Insights, Companies, Challenges, Strategy, Consumer Insights, Analysis, Investment Trends, Opportunities, Growth, Size, Share, Industry, Revenue, Segments, Value, Segmentation, Supply, Forecast, Restraints
- India Kids Watches Market (2026-2032) | Strategy, Consumer Insights, Analysis, Investment Trends, Opportunities, Growth, Size, Share, Industry, Revenue, Segments, Value, Segmentation, Supply, Forecast, Restraints, Outlook, Competition, Drivers, Trends, Demand, Pricing Analysis, Competitive, Strategic Insights, Companies, Challenges
- Saudi Arabia Core Assurance Service Market (2025-2031) | Strategy, Consumer Insights, Analysis, Investment Trends, Opportunities, Growth, Size, Share, Industry, Revenue, Segments, Value, Segmentation, Supply, Forecast, Restraints, Outlook, Competition, Drivers, Trends, Demand, Pricing Analysis, Competitive, Strategic Insights, Companies, Challenges
Industry Events and Analyst Meet

India EV Show 2026

EV tech India Expo 2026

Auto Tech Asia 2026

Battery Tech India 2026

Smart Production Solutions Guangzhou 2026
Whitepaper
- Middle East & Africa Commercial Security Market Click here to view more.
- Middle East & Africa Fire Safety Systems & Equipment Market Click here to view more.
- GCC Drone Market Click here to view more.
- Middle East Lighting Fixture Market Click here to view more.
- GCC Physical & Perimeter Security Market Click here to view more.
6WResearch In News
- Doha a strategic location for EV manufacturing hub: IPA Qatar
- Demand for luxury TVs surging in the GCC, says Samsung
- Empowering Growth: The Thriving Journey of Bangladesh’s Cable Industry
- Demand for luxury TVs surging in the GCC, says Samsung
- Video call with a traditional healer? Once unthinkable, it’s now common in South Africa
- Intelligent Buildings To Smooth GCC’s Path To Net Zero