Australia Fluid Loss Additive Market (2026-2032) | Analysis, Growth, Competitive Landscape, Forecast, Industry, Size & Revenue, Outlook, Trends, Value, Segmentation, Share, Companies
Market Forecast By Type (Synthetic, Natural, Synthetically Modified Natural), By Application (Drilling Fluid, Cement Slurry) And Competitive Landscape
| Product Code: ETC6180950 | Publication Date: Sep 2024 | Updated Date: Mar 2026 | Product Type: Market Research Report | |
| Publisher: 6Wresearch | Author: Shubham Padhi | No. of Pages: 75 | No. of Figures: 35 | No. of Tables: 20 |
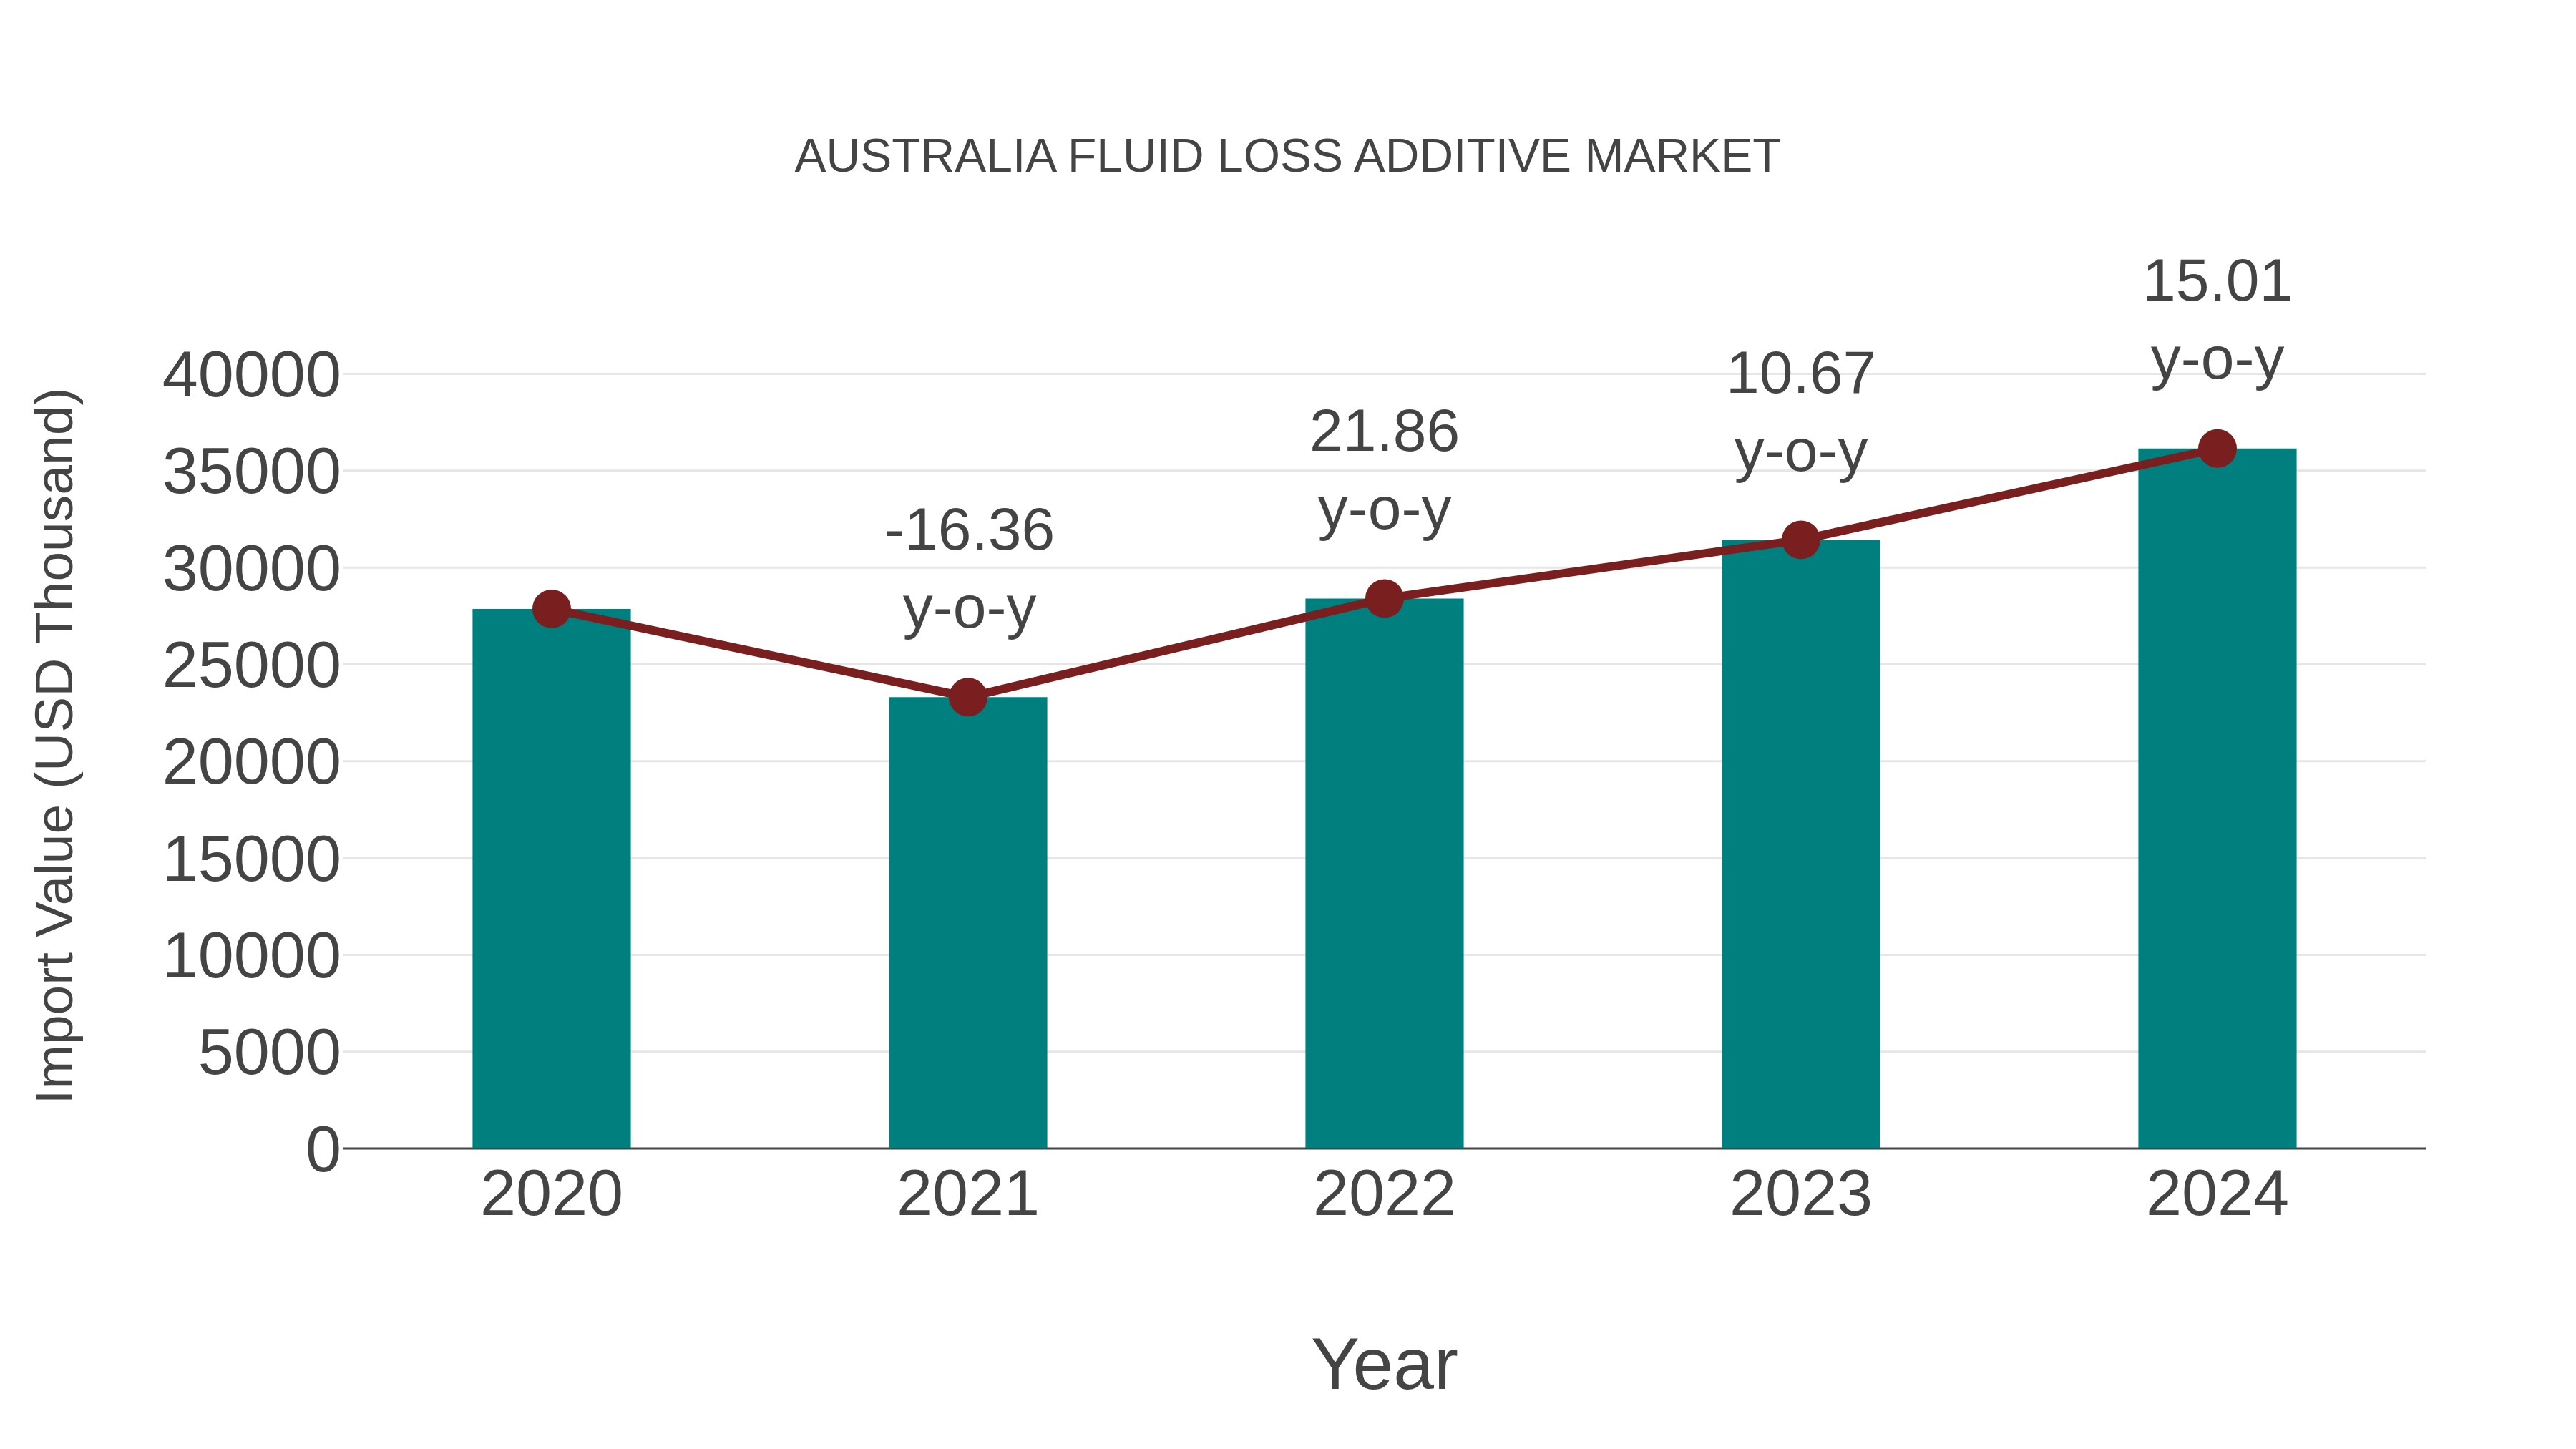
Australia Fluid Loss Additive Market: Import Trend Analysis
Australia`s import trend for fluid loss additives in 2024 showed a growth rate of 15.01% compared to the previous year, with a compound annual growth rate (CAGR) of 6.72% from 2020 to 2024. This import momentum can be attributed to a consistent demand shift towards more advanced additives in the market.
Australia Fluid Loss Additive Market Overview
The Fluid Loss Additive Market in Australia is closely linked with the oil and gas sector. These additives prevent excessive fluid loss during drilling operations, enhancing well integrity and efficiency. With increasing offshore exploration and deep-water drilling activities, the demand for effective fluid loss control is rising.
Trends of the market
The fluid loss additive market in Australia is witnessing moderate growth driven by oil and gas drilling operations and geothermal energy exploration. Innovation in water-based drilling fluids and the development of environmentally friendly additives are important trends, with operators increasingly focused on reducing environmental impact while maintaining wellbore integrity.
Challenges of the market
The market struggles with performance variability of additives across different geological formations, leading to inconsistent results. Environmental regulations concerning the use of synthetic additives create a need for eco-friendly alternatives, which are costlier. Volatile oil prices also influence exploration activities, thereby impacting additive consumption.
Investment opportunities in the Market
In the oil and gas and construction sectors, fluid loss additives are vital for drilling efficiency and cementing operations. As these industries expand in Australia, theres a growing need for customized chemical solutions that minimize fluid loss in challenging geological conditions. Companies focusing on eco-friendly or high-performance fluid loss additives have room for substantial growth and partnerships with major service providers.
Government Policy of the market
This market is driven by the regulatory oversight of oilfield chemicals. The National Industrial Chemicals Notification and Assessment Scheme (NICNAS), now part of AICIS, evaluates chemical safety for substances including fluid loss additives used in drilling. Government emphasis on safe chemical handling and groundwater protection has led to stricter controls and testing requirements, encouraging the use of environmentally friendly additives.
Key Highlights of the Report:
- Australia Fluid Loss Additive Market Outlook
- Market Size of Australia Fluid Loss Additive Market, 2025
- Forecast of Australia Fluid Loss Additive Market, 2032
- Historical Data and Forecast of Australia Fluid Loss Additive Revenues & Volume for the Period 2022 - 2032F
- Australia Fluid Loss Additive Market Trend Evolution
- Australia Fluid Loss Additive Market Drivers and Challenges
- Australia Fluid Loss Additive Price Trends
- Australia Fluid Loss Additive Porter's Five Forces
- Australia Fluid Loss Additive Industry Life Cycle
- Historical Data and Forecast of Australia Fluid Loss Additive Market Revenues & Volume By Type for the Period 2022 - 2032F
- Historical Data and Forecast of Australia Fluid Loss Additive Market Revenues & Volume By Synthetic for the Period 2022 - 2032F
- Historical Data and Forecast of Australia Fluid Loss Additive Market Revenues & Volume By Natural for the Period 2022 - 2032F
- Historical Data and Forecast of Australia Fluid Loss Additive Market Revenues & Volume By Synthetically Modified Natural for the Period 2022 - 2032F
- Historical Data and Forecast of Australia Fluid Loss Additive Market Revenues & Volume By Application for the Period 2022 - 2032F
- Historical Data and Forecast of Australia Fluid Loss Additive Market Revenues & Volume By Drilling Fluid for the Period 2022 - 2032F
- Historical Data and Forecast of Australia Fluid Loss Additive Market Revenues & Volume By Cement Slurry for the Period 2022 - 2032F
- Australia Fluid Loss Additive Import Export Trade Statistics
- Market Opportunity Assessment By Type
- Market Opportunity Assessment By Application
- Australia Fluid Loss Additive Top Companies Market Share
- Australia Fluid Loss Additive Competitive Benchmarking By Technical and Operational Parameters
- Australia Fluid Loss Additive Company Profiles
- Australia Fluid Loss Additive Key Strategic Recommendations
Australia Fluid Loss Additive Market (2026-2032): FAQs
6Wresearch actively monitors the Australia Fluid Loss Additive Market and publishes its comprehensive annual report, highlighting emerging trends, growth drivers, revenue analysis, and forecast outlook. Our insights help businesses to make data-backed strategic decisions with ongoing market dynamics. Our analysts track relevent industries related to the Australia Fluid Loss Additive Market, allowing our clients with actionable intelligence and reliable forecasts tailored to emerging regional needs.
Yes, we provide customisation as per your requirements. To learn more, feel free to contact us on sales@6wresearch.com
1 Executive Summary |
2 Introduction |
2.1 Key Highlights of the Report |
2.2 Report Description |
2.3 Market Scope & Segmentation |
2.4 Research Methodology |
2.5 Assumptions |
3 Australia Fluid Loss Additive Market Overview |
3.1 Australia Country Macro Economic Indicators |
3.2 Australia Fluid Loss Additive Market Revenues & Volume, 2022 & 2032F |
3.3 Australia Fluid Loss Additive Market - Industry Life Cycle |
3.4 Australia Fluid Loss Additive Market - Porter's Five Forces |
3.5 Australia Fluid Loss Additive Market Revenues & Volume Share, By Type, 2022 & 2032F |
3.6 Australia Fluid Loss Additive Market Revenues & Volume Share, By Application, 2022 & 2032F |
4 Australia Fluid Loss Additive Market Dynamics |
4.1 Impact Analysis |
4.2 Market Drivers |
4.2.1 Increasing demand for oil and gas exploration activities in Australia |
4.2.2 Growing awareness about the benefits of using fluid loss additives in drilling operations |
4.2.3 Technological advancements leading to the development of more efficient fluid loss additives |
4.3 Market Restraints |
4.3.1 Stringent regulations and environmental concerns related to the use of chemicals in drilling fluids |
4.3.2 Fluctuating prices of raw materials used in fluid loss additives production |
5 Australia Fluid Loss Additive Market Trends |
6 Australia Fluid Loss Additive Market, By Types |
6.1 Australia Fluid Loss Additive Market, By Type |
6.1.1 Overview and Analysis |
6.1.2 Australia Fluid Loss Additive Market Revenues & Volume, By Type, 2022 - 2032F |
6.1.3 Australia Fluid Loss Additive Market Revenues & Volume, By Synthetic, 2022 - 2032F |
6.1.4 Australia Fluid Loss Additive Market Revenues & Volume, By Natural, 2022 - 2032F |
6.1.5 Australia Fluid Loss Additive Market Revenues & Volume, By Synthetically Modified Natural, 2022 - 2032F |
6.2 Australia Fluid Loss Additive Market, By Application |
6.2.1 Overview and Analysis |
6.2.2 Australia Fluid Loss Additive Market Revenues & Volume, By Drilling Fluid, 2022 - 2032F |
6.2.3 Australia Fluid Loss Additive Market Revenues & Volume, By Cement Slurry, 2022 - 2032F |
7 Australia Fluid Loss Additive Market Import-Export Trade Statistics |
7.1 Australia Fluid Loss Additive Market Export to Major Countries |
7.2 Australia Fluid Loss Additive Market Imports from Major Countries |
8 Australia Fluid Loss Additive Market Key Performance Indicators |
8.1 Number of new oil and gas exploration projects in Australia |
8.2 Adoption rate of fluid loss additives in drilling operations |
8.3 Research and development investments in the fluid loss additive sector |
9 Australia Fluid Loss Additive Market - Opportunity Assessment |
9.1 Australia Fluid Loss Additive Market Opportunity Assessment, By Type, 2022 & 2032F |
9.2 Australia Fluid Loss Additive Market Opportunity Assessment, By Application, 2022 & 2032F |
10 Australia Fluid Loss Additive Market - Competitive Landscape |
10.1 Australia Fluid Loss Additive Market Revenue Share, By Companies, 2025 |
10.2 Australia Fluid Loss Additive Market Competitive Benchmarking, By Operating and Technical Parameters |
11 Company Profiles |
12 Recommendations |
13 Disclaimer |
Export potential assessment - trade Analytics for 2030
Export potential enables firms to identify high-growth global markets with greater confidence by combining advanced trade intelligence with a structured quantitative methodology. The framework analyzes emerging demand trends and country-level import patterns while integrating macroeconomic and trade datasets such as GDP and population forecasts, bilateral import–export flows, tariff structures, elasticity differentials between developed and developing economies, geographic distance, and import demand projections. Using weighted trade values from 2020–2024 as the base period to project country-to-country export potential for 2030, these inputs are operationalized through calculated drivers such as gravity model parameters, tariff impact factors, and projected GDP per-capita growth. Through an analysis of hidden potentials, demand hotspots, and market conditions that are most favorable to success, this method enables firms to focus on target countries, maximize returns, and global expansion with data, backed by accuracy.
By factoring in the projected importer demand gap that is currently unmet and could be potential opportunity, it identifies the potential for the Exporter (Country) among 190 countries, against the general trade analysis, which identifies the biggest importer or exporter.
To discover high-growth global markets and optimize your business strategy:
Click Here
Pricing
- Single User License$ 1,995
- Department License$ 2,400
- Site License$ 3,120
- Global License$ 3,795

Search
Thought Leadership and Analyst Meet


Our Clients
Latest Reports
- Taiwan Food Delivery Platform Market (2026-2032) | Companies, Outlook, Analysis, Trends, Value, Revenue, Segmentation, Share, Forecast, Competitive Landscape, Growth, Size & Forecast
- United Kingdom (UK) Long-term Care Insurance Market (2026-2032) | Growth, Share, Consumer Insights, Drivers, Opportunities, Competition, Pricing Analysis, Segments, Restraints, Companies, Competitive, Value, Outlook, Size, Demand, Analysis, Challenges, Strategic Insights, Investment Trends, Revenue, Trends, Supply, Forecast
- United Kingdom (UK) Long Term Care Market (2026-2032) | Companies, Outlook, Analysis, Trends, Value, Revenue, Segmentation, Share, Forecast, Competitive Landscape, Growth, Size & Forecast
- Iraq Insulation and Waterproofing Market (2026-2032) | Outlook, Drivers, Growth, Size, Share, Industry, Revenue, Trends, Demand, Competitive, Strategic Insights, Opportunities, Segments, Companies, Challenges, Strategy, Consumer Insights, Analysis, Investment Trends, Value, Segmentation, Forecast, Restraints
- India Switchgear Market Outlook (2026-2032) | Size, Share, Trends, Growth, Revenue, Forecast, Analysis, Value, Outlook
- Pakistan Contraceptive Implants Market (2025-2031) | Demand, Growth, Size, Share, Industry, Pricing Analysis, Competitive, Strategic Insights, Strategy, Consumer Insights, Analysis, Investment Trends, Opportunities, Revenue, Segments, Value, Segmentation, Supply, Forecast, Restraints, Outlook, Competition, Drivers, Trends, Companies, Challenges
- Sri Lanka Packaging Market (2026-2032) | Outlook, Competition, Drivers, Trends, Demand, Pricing Analysis, Competitive, Strategic Insights, Companies, Challenges, Strategy, Consumer Insights, Analysis, Investment Trends, Opportunities, Growth, Size, Share, Industry, Revenue, Segments, Value, Segmentation, Supply, Forecast, Restraints
- India Kids Watches Market (2026-2032) | Strategy, Consumer Insights, Analysis, Investment Trends, Opportunities, Growth, Size, Share, Industry, Revenue, Segments, Value, Segmentation, Supply, Forecast, Restraints, Outlook, Competition, Drivers, Trends, Demand, Pricing Analysis, Competitive, Strategic Insights, Companies, Challenges
- Saudi Arabia Core Assurance Service Market (2025-2031) | Strategy, Consumer Insights, Analysis, Investment Trends, Opportunities, Growth, Size, Share, Industry, Revenue, Segments, Value, Segmentation, Supply, Forecast, Restraints, Outlook, Competition, Drivers, Trends, Demand, Pricing Analysis, Competitive, Strategic Insights, Companies, Challenges
- Romania Uninterruptible Power Supply (UPS) Market (2026-2032) | Industry, Analysis, Revenue, Size, Forecast, Outlook, Value, Trends, Share, Growth & Companies
Industry Events and Analyst Meet

India EV Show 2026

EV tech India Expo 2026

Auto Tech Asia 2026

Battery Tech India 2026

Smart Production Solutions Guangzhou 2026
Whitepaper
- Middle East & Africa Commercial Security Market Click here to view more.
- Middle East & Africa Fire Safety Systems & Equipment Market Click here to view more.
- GCC Drone Market Click here to view more.
- Middle East Lighting Fixture Market Click here to view more.
- GCC Physical & Perimeter Security Market Click here to view more.
6WResearch In News
- Doha a strategic location for EV manufacturing hub: IPA Qatar
- Demand for luxury TVs surging in the GCC, says Samsung
- Empowering Growth: The Thriving Journey of Bangladesh’s Cable Industry
- Demand for luxury TVs surging in the GCC, says Samsung
- Video call with a traditional healer? Once unthinkable, it’s now common in South Africa
- Intelligent Buildings To Smooth GCC’s Path To Net Zero