Australia Gambling Market (2026-2032) | Trends, Analysis, Forecast, Companies, Share, Outlook, Value, Size, Revenue, Growth & Industry
Market Forecast By Product Type (Betting, Casino, Lottery, Others), By Channel Type (Offline, Online, Virtual Reality VR), By Platform (Land-Based, Online) And Competitive Landscape
| Product Code: ETC014695 | Publication Date: Oct 2020 | Updated Date: Jun 2026 | Product Type: Report | |
| Publisher: 6Wresearch | Author: Ravi Bhandari | No. of Pages: 70 | No. of Figures: 35 | No. of Tables: 5 |
Australia Gambling Market Summary
The australia gambling market was estimated at USD 194 Million in 2025 and is projected to reach USD 229 Million by 2032, growing at a CAGR of 2.3% from 2026 to 2032.
Australia Gambling Market Growth Rate Analysis (2021-2032)
The Australian gambling market has shown a notable recovery following a slight decline of 0.4% in 2021. In 2022, the sector rebounded with a robust growth of 5.9%, driven by increased consumer demand and greater adoption of digital gambling platforms. The growth moderated slightly to 5.0% in 2023, reflecting ongoing investments in technology and infrastructure that enhance user experience. As we move into the next few years, growth is expected to stabilize around 2.9% in 2024, gradually tapering to 2.5% by 2032. This deceleration stems from market saturation and heightened regulatory scrutiny, combined with shifts in consumer preferences toward more innovative gaming solutions.
Australia Gambling Market Year-wise Growth Rate and Key Drivers
This graph highlights how the Australia Gambling Market has steadily grown over the past five years, supported by major growth factors.
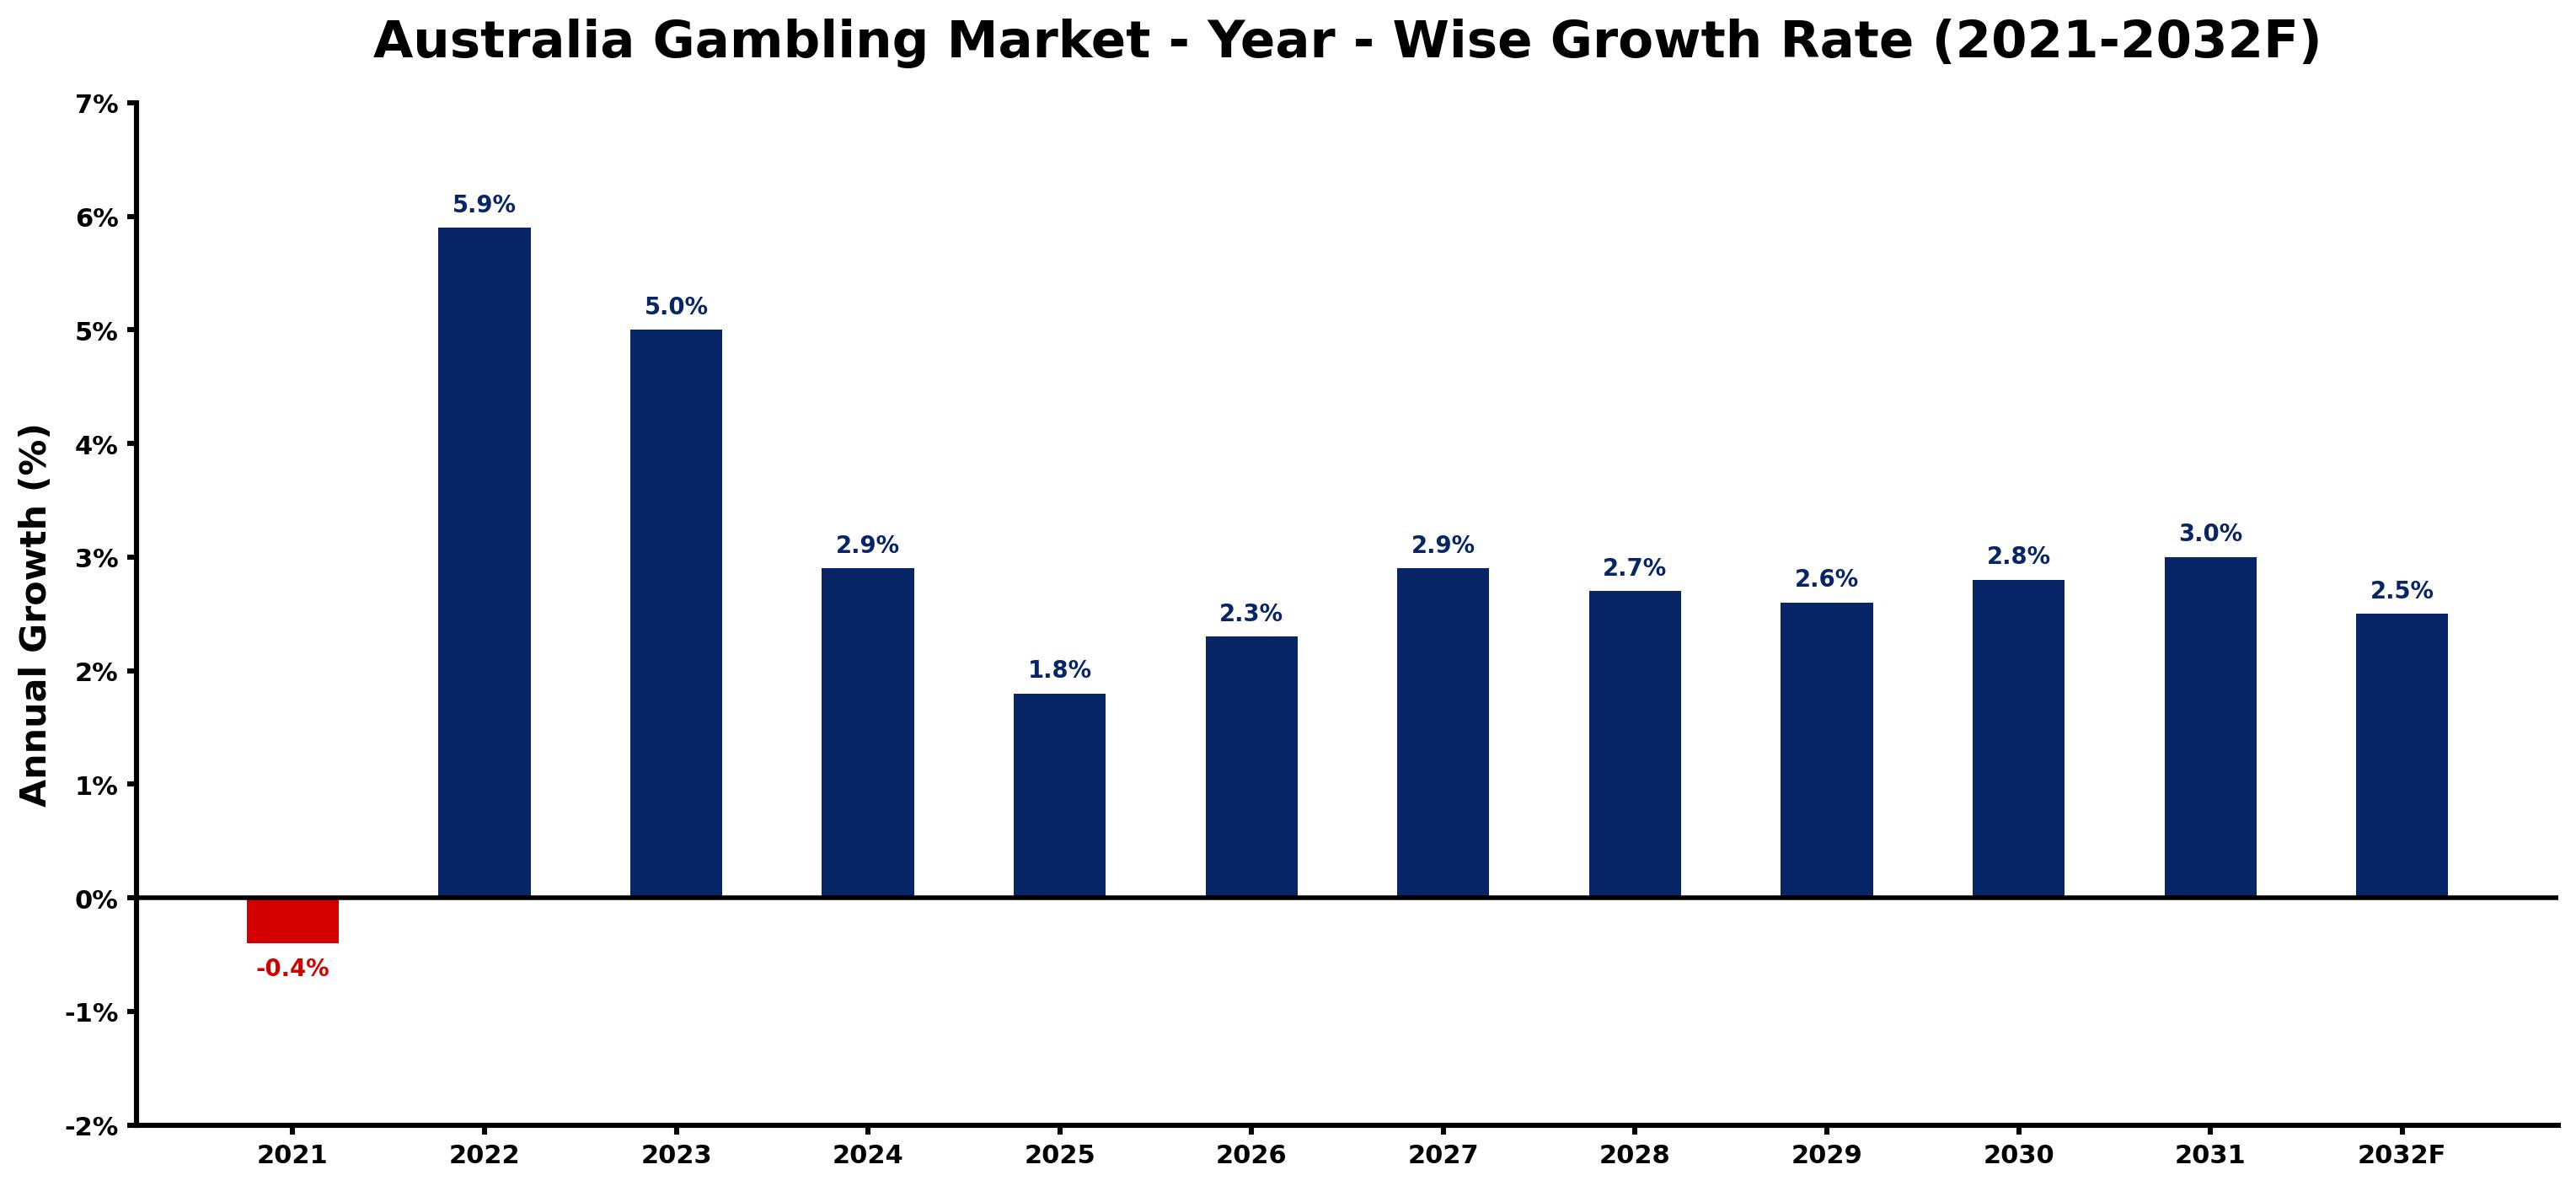
The table below presents the year wise growth rates along with the key drivers influencing the market
| Year | Growth Rate | Major Drivers |
| 2021 | -0.4% | Increased public awareness of gambling addiction led to tighter restrictions and declining participation rates. |
| 2022 | 5.9% | Emerging technologies enabled enhanced user experience in mobile gaming applications. |
| 2023 | 5.0% | Market shifts reflected an increasing preference for live dealer casino experiences. |
| 2024 | 2.9% | Innovative marketing strategies targeted younger demographics, expanding the customer base. |
| 2025 | 1.8% | Technological advancements in blockchain fostered trust in online gambling transactions. |
| 2026 | 2.3% | Increased competition among operators led to attractive bonuses and promotions. |
| 2027 | 2.9% | Consumer behavior analysis revealed a significant rise in sports betting popularity. |
| 2028 | 2.7% | Urban development initiatives sparked growth in local gambling establishments and venues. |
| 2029 | 2.6% | Collaboration between tech firms and gambling companies enhanced cybersecurity measures. |
| 2030 | 2.8% | Consumer preferences leaned towards personalized gaming experiences and loyalty programs. |
| 2031 | 3.0% | Financial investment in gambling technology improved platforms' reliability and scalability. |
| 2032 | 2.5% | Cultural shifts in leisure activities positioned gambling as a mainstream entertainment option. |
Note - Market size estimations and growth projections presented in this report are based on 6Wresearch's advanced forecasting approach, validated with industry datasets as of June 2026.
Australia Gambling Market Synopsis
The Australia Gambling Market is projected to reach 2.3% and witness significant growth during the forecast period (2026-2032). This market encompasses a diverse array of activities related to games of chance and wagering including casinos, lotteries, sports betting, and gaming machines. The gambling sector holds a prominent position in the Australian economy, driven by consumers' increasing demand for leisure and entertainment. Cultural attitudes that embrace gambling, combined with technological advancements and regulatory developments, shape the landscape of this thriving market.
Australia Gambling Market Growth Drivers
The growth of the Australia Gambling Market is primarily fueled by several compelling factors:
- Increasing disposable income among consumers plays a crucial role, as individuals are more willing to allocate funds for leisure activities, including gambling.
- The shift towards online gambling platforms has transformed how Australians engage in betting, making it more accessible and appealing.
- Innovation in marketing strategies has broadened the reach of gambling services, thereby attracting a wider audience and increasing participation rates.
- Changes in consumer preferences, particularly a growing acceptance of sports betting, have led to a surge in related gambling activities.
- Regulatory reforms aimed at modernizing the gambling landscape have provided a more conducive environment for market expansion and new entrants.
Australia Gambling Market Challenges and Restraints
While the Australia Gambling Market is on an upward trajectory, it faces numerous challenges that could impact its growth:
- Regulatory restrictions often create hurdles for market participants, necessitating a thorough understanding of evolving laws and compliance requirements.
- Public concerns over problem gambling and addiction necessitate the implementation of effective harm minimization strategies, which can complicate standard operating procedures.
- The competitive landscape has intensified, particularly due to the influx of online gambling platforms that pose a threat to traditional gaming establishments.
- Shifts in consumer preferences towards more responsible gambling practices may limit the attractiveness of certain gambling products, affecting overall revenues.
- Economic downturns or fluctuations in disposable income could hinder consumer spending on gambling activities, posing risks to market growth.
Australia Gambling Market Government Investment and Initiatives
Government regulation plays a pivotal role in shaping the Australia Gambling Market, focusing on consumer protection and responsible gambling.
- The Australian government has established various regulatory bodies, such as the Australian Communications and Media Authority (ACMA) and state gambling commissions, to oversee compliance and ensure the integrity of gambling activities.
- Licensing requirements, advertising restrictions, and harm minimization measures are essential components of government policy aimed at curbing problem gambling and underage betting.
- Public education campaigns are actively promoted to raise awareness about gambling-related risks and available support services for those affected.
- Investment in research into gambling behaviors and effective harm reduction strategies is prioritized, underscoring the government's commitment to fostering a safer gambling environment.
- Incentives are also provided to encourage the adoption of innovative technologies that enhance player protection and promote responsible gambling.
Australia Gambling Market Latest Developments (May 2025 - June 2026)
Recent developments in the Australia Gambling Market have been indicative of a sector adapting to various challenges and consumer demands:
- Significant strides in technology have led to the proliferation of mobile gambling applications, offering users enhanced convenience and a richer gaming experience.
- Increased scrutiny from regulatory bodies has prompted operators to place greater emphasis on responsible gambling practices and customer protection measures.
- The sports betting segment has seen a sharp increase in participation, with community engagement initiatives helping to normalize and sustain interest in this activity.
- Collaborations between technology firms and traditional gambling operators have emerged, focusing on innovation while maintaining compliance with regulatory requirements.
- Legislation reforms are underway, aimed at addressing emerging trends and ensuring that the gambling market remains robust and resilient amid changing consumer attitudes.
Australia Gambling Market - Key Attractiveness of the Report
- 10 Years of Market Numbers
- Historical Data Starting from 2022 to 2025
- Base Year: 2025
- Forecast Data until 2032
- Key Performance Indicators Impacting the Market
- Major Upcoming Developments and Projects
Key Highlights of the Report:
- Australia Gambling Market Outlook
- Market Size of Australia Gambling Market, 2025
- Forecast of Australia Gambling Market, 2032
- Historical Data and Forecast of Australia Gambling Revenues & Volume for the Period 2022-2032F
- Australia Gambling Market Trend Evolution
- Australia Gambling Market Drivers and Challenges
- Australia Gambling Price Trends
- Australia Gambling Porter's Five Forces
- Australia Gambling Industry Life Cycle
- Historical Data and Forecast of Australia Gambling Market Revenues & Volume By Product Type for the Period 2022-2032F
- Historical Data and Forecast of Australia Gambling Market Revenues & Volume By Betting for the Period 2022-2032F
- Historical Data and Forecast of Australia Gambling Market Revenues & Volume By Casino for the Period 2022-2032F
- Historical Data and Forecast of Australia Gambling Market Revenues & Volume By Lottery for the Period 2022-2032F
- Historical Data and Forecast of Australia Gambling Market Revenues & Volume By Others for the Period 2022-2032F
- Historical Data and Forecast of Australia Gambling Market Revenues & Volume By Channel Type for the Period 2022-2032F
- Historical Data and Forecast of Australia Gambling Market Revenues & Volume By Offline for the Period 2022-2032F
- Historical Data and Forecast of Australia Gambling Market Revenues & Volume By Online for the Period 2022-2032F
- Historical Data and Forecast of Australia Gambling Market Revenues & Volume By Virtual Reality VR for the Period 2022-2032F
- Historical Data and Forecast of Australia Gambling Market Revenues & Volume By Platform for the Period 2022-2032F
- Historical Data and Forecast of Australia Gambling Market Revenues & Volume By Land-Based for the Period 2022-2032F
- Historical Data and Forecast of Australia Gambling Market Revenues & Volume By Online for the Period 2022-2032F
- Australia Gambling Import Export Trade Statistics
- Market Opportunity Assessment By Product Type
- Market Opportunity Assessment By Channel Type
- Market Opportunity Assessment By Platform
- Australia Gambling Top Companies Market Share
- Australia Gambling Competitive Benchmarking By Technical and Operational Parameters
- Australia Gambling Company Profiles
- Australia Gambling Key Strategic Recommendations
Frequently Asked Questions About the Market Study (FAQs):
The Australia Gambling Market is expected to experience significant growth during the forecast period, driven by increasing consumer engagement and favorable regulatory developments.
Government regulation in Australia is centered on consumer protection, with ongoing initiatives to promote responsible gambling practices and compliance with various laws.
Key challenges include regulatory restrictions, the need for harm minimization strategies, and competition from rapidly expanding online gambling platforms.
Technological advancements are reshaping the Australia Gambling Market by enhancing user experiences through mobile applications and facilitating the transition to online gambling.
6Wresearch actively monitors the Australia Gambling Market and publishes its comprehensive annual report, highlighting emerging trends, growth drivers, revenue analysis, and forecast outlook. Our insights help businesses to make data-backed strategic decisions with ongoing market dynamics. Our analysts track relevent industries related to the Australia Gambling Market, allowing our clients with actionable intelligence and reliable forecasts tailored to emerging regional needs.
Yes, we provide customisation as per your requirements. To learn more, feel free to contact us on sales@6wresearch.com
1 Executive Summary |
2 Introduction |
2.1 Key Highlights of the Report |
2.2 Report Description |
2.3 Market Scope & Segmentation |
2.4 Research Methodology |
2.5 Assumptions |
3 Australia Gambling Market Overview |
3.1 Australia Country Macro Economic Indicators |
3.2 Australia Gambling Market Revenues & Volume, 2022 & 2032F |
3.3 Australia Gambling Market - Industry Life Cycle |
3.4 Australia Gambling Market - Porter's Five Forces |
3.5 Australia Gambling Market Revenues & Volume Share, By Product Type, 2022 & 2032F |
3.6 Australia Gambling Market Revenues & Volume Share, By Channel Type, 2022 & 2032F |
3.7 Australia Gambling Market Revenues & Volume Share, By Platform, 2022 & 2032F |
4 Australia Gambling Market Dynamics |
4.1 Impact Analysis |
4.2 Market Drivers |
4.2.1 Increasing disposable income of the population in Australia |
4.2.2 Growth in online gambling platforms and mobile betting applications |
4.2.3 Tourism industry boosting the demand for casinos and gambling activities |
4.3 Market Restraints |
4.3.1 Stringent regulations and compliance requirements in the gambling industry |
4.3.2 Negative social stigma associated with gambling leading to potential regulatory interventions |
5 Australia Gambling Market Trends |
6 Australia Gambling Market, By Types |
6.1 Australia Gambling Market, By Product Type |
6.1.1 Overview and Analysis |
6.1.2 Australia Gambling Market Revenues & Volume, By Product Type, 2022-2032F |
6.1.3 Australia Gambling Market Revenues & Volume, By Betting, 2022-2032F |
6.1.4 Australia Gambling Market Revenues & Volume, By Casino, 2022-2032F |
6.1.5 Australia Gambling Market Revenues & Volume, By Lottery, 2022-2032F |
6.1.6 Australia Gambling Market Revenues & Volume, By Others, 2022-2032F |
6.2 Australia Gambling Market, By Channel Type |
6.2.1 Overview and Analysis |
6.2.2 Australia Gambling Market Revenues & Volume, By Offline, 2022-2032F |
6.2.3 Australia Gambling Market Revenues & Volume, By Online, 2022-2032F |
6.2.4 Australia Gambling Market Revenues & Volume, By Virtual Reality VR, 2022-2032F |
6.3 Australia Gambling Market, By Platform |
6.3.1 Overview and Analysis |
6.3.2 Australia Gambling Market Revenues & Volume, By Land-Based, 2022-2032F |
6.3.3 Australia Gambling Market Revenues & Volume, By Online, 2022-2032F |
7 Australia Gambling Market Import-Export Trade Statistics |
7.1 Australia Gambling Market Export to Major Countries |
7.2 Australia Gambling Market Imports from Major Countries |
8 Australia Gambling Market Key Performance Indicators |
8.1 Average revenue per user (ARPU) in the gambling market |
8.2 Percentage of population participating in gambling activities |
8.3 Frequency of visits to physical and online gambling establishments |
9 Australia Gambling Market - Opportunity Assessment |
9.1 Australia Gambling Market Opportunity Assessment, By Product Type, 2022 & 2032F |
9.2 Australia Gambling Market Opportunity Assessment, By Channel Type, 2022 & 2032F |
9.3 Australia Gambling Market Opportunity Assessment, By Platform, 2022 & 2032F |
10 Australia Gambling Market - Competitive Landscape |
10.1 Australia Gambling Market Revenue Share, By Companies, 2025 |
10.2 Australia Gambling Market Competitive Benchmarking, By Operating and Technical Parameters |
11 Company Profiles |
12 Recommendations |
13 Disclaimer |
Global Go To Market Strategy - 2030
Export potential enables firms to identify high-growth global markets with greater confidence by combining advanced trade intelligence with a structured quantitative methodology. The framework analyzes emerging demand trends and country-level import patterns while integrating macroeconomic and trade datasets such as GDP and population forecasts, bilateral import–export flows, tariff structures, elasticity differentials between developed and developing economies, geographic distance, and import demand projections. Using weighted trade values from 2020–2024 as the base period to project country-to-country export potential for 2030, these inputs are operationalized through calculated drivers such as gravity model parameters, tariff impact factors, and projected GDP per-capita growth. Through an analysis of hidden potentials, demand hotspots, and market conditions that are most favorable to success, this method enables firms to focus on target countries, maximize returns, and global expansion with data, backed by accuracy.
By factoring in the projected importer demand gap that is currently unmet and could be potential opportunity, it identifies the potential for the Exporter (Country) among 190 countries, against the general trade analysis, which identifies the biggest importer or exporter.
To discover high-growth global markets and optimize your business strategy:
Click Here
Pricing
- Single User License$ 1,995
- Department License$ 2,400
- Site License$ 3,120
- Global License$ 3,795

Leadership Perspectives from Industry Events
Search
Thought Leadership and Analyst Meet


Our Clients
6WResearch In News
- India Air Conditioner Market Set for Strong Rebound in 2026 After Weather-Led Correction and GST-Driven Recovery: 6Wresearch
- ADAS in India: How Automatic Emergency Braking, Blind Spot Detection & Driver Monitoring are Transforming Road Safety
- Doha a strategic location for EV manufacturing hub: IPA Qatar
- Demand for luxury TVs surging in the GCC, says Samsung
- Empowering Growth: The Thriving Journey of Bangladesh’s Cable Industry
- Demand for luxury TVs surging in the GCC, says Samsung
Latest Reports
- Nicaragua RPG Gaming Market (2026-2032)
- New Zealand RPG Gaming Market (2026-2032)
- Netherlands RPG Gaming Market (2026-2032)
- Nauru RPG Gaming Market (2026-2032)
- Namibia RPG Gaming Market (2026-2032)
- Mozambique RPG Gaming Market (2026-2032)
- Montenegro RPG Gaming Market (2026-2032)
- Mongolia RPG Gaming Market (2026-2032)
- Monaco RPG Gaming Market (2026-2032)
- Micronesia RPG Gaming Market (2026-2032)
Industry Events and Analyst Meet

HIMTEX 2026

India Refining Summit 2026

India EV Show 2026

EV tech India Expo 2026

Auto Tech Asia 2026
Whitepaper
- Middle East & Africa Commercial Security Market Click here to view more.
- Middle East & Africa Fire Safety Systems & Equipment Market Click here to view more.
- GCC Drone Market Click here to view more.
- Middle East Lighting Fixture Market Click here to view more.
- GCC Physical & Perimeter Security Market Click here to view more.