Australia Glass Alternative Materials Market (2026-2032) | Outlook, Size & Revenue, Competitive Landscape, Industry, Share, Growth, Companies, Analysis, Value, Segmentation, Trends, Forecast
Market Forecast By Type (Acrylic, Polycarbonate, Transparent Wood, Others (Polymers)), By Light Transmission (Up To 80%, >80%-90%, >90%), By Application (Visual Application, Automotive, Electronic, Construction, Medical Devices, Cuvettes, Aviation) And Competitive Landscape
| Product Code: ETC6181706 | Publication Date: Sep 2024 | Updated Date: Mar 2026 | Product Type: Market Research Report | |
| Publisher: 6Wresearch | Author: Summon Dutta | No. of Pages: 75 | No. of Figures: 35 | No. of Tables: 20 |
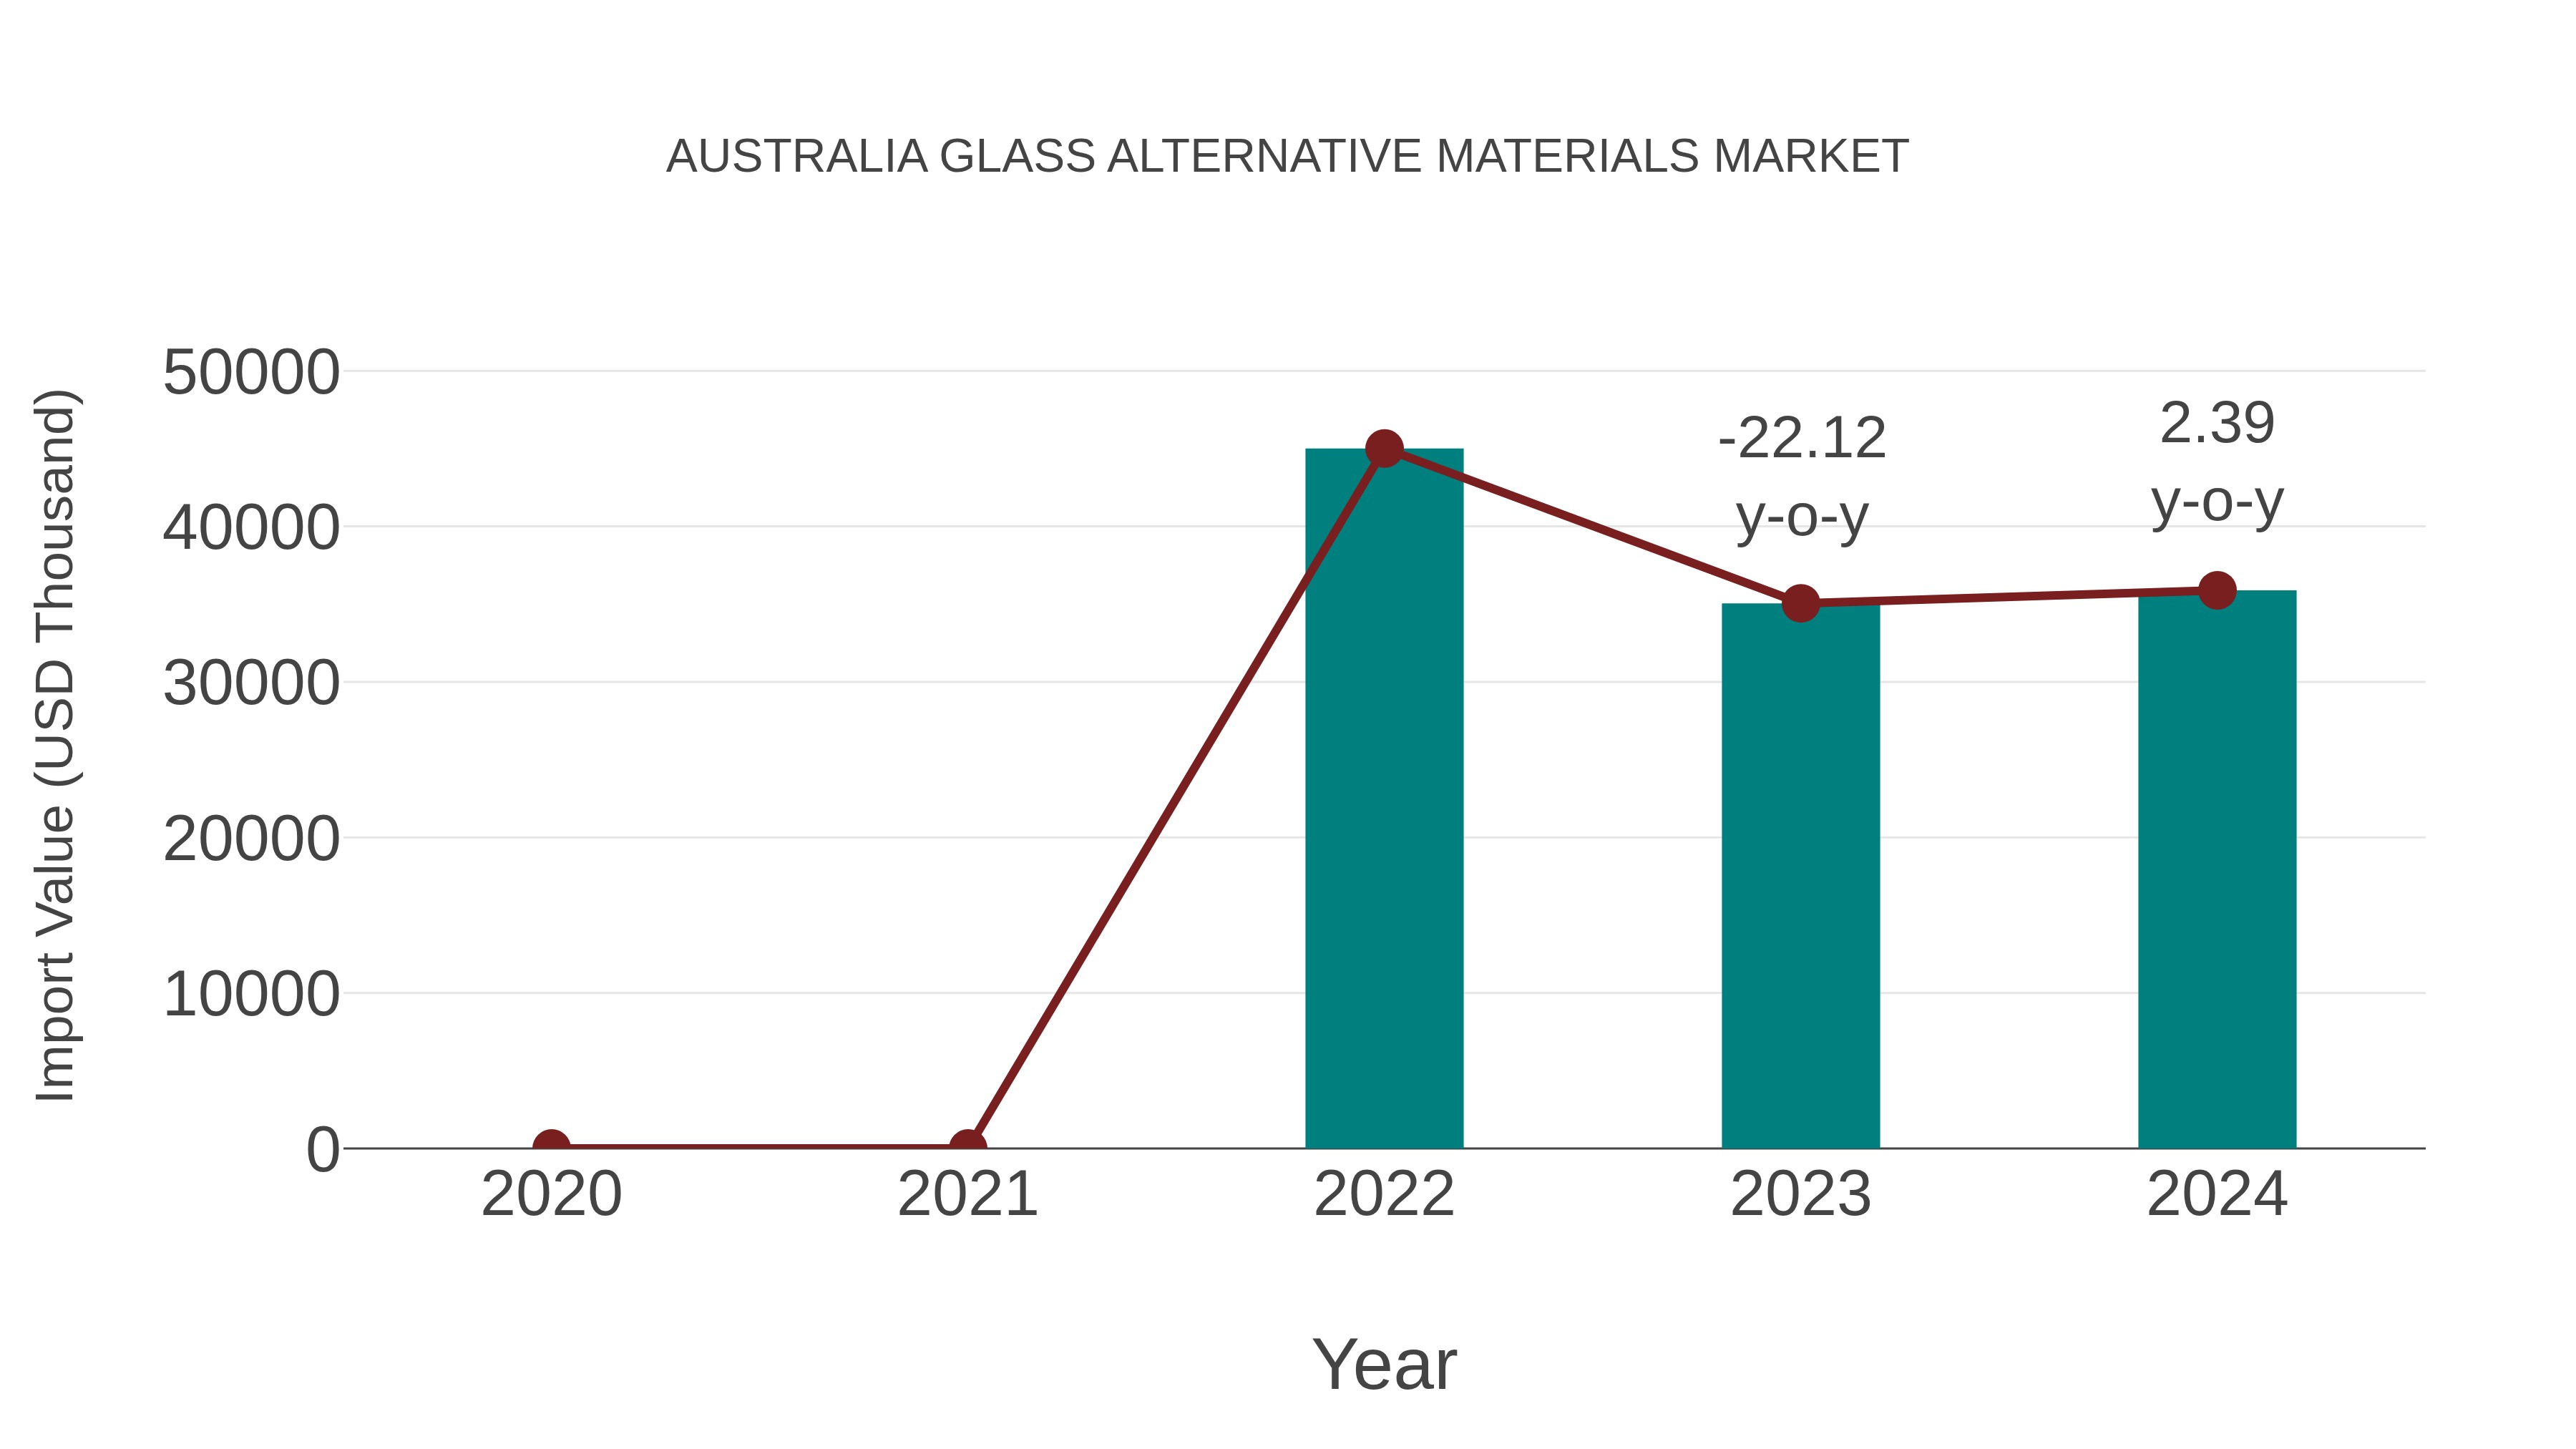
Australia Glass Alternative Materials Market: Import Trend Analysis
In 2024, Australia`s import trend for glass alternative materials market showed a growth rate of 2.39%, following a compound annual growth rate (CAGR) of -10.7% from 2020 to 2023. This shift in momentum can be attributed to evolving consumer preferences towards sustainable and eco-friendly materials, driving demand for glass alternatives in the market.
Australia Glass Alternative Materials Market Overview
Australia`s market for glass alternative materials is expanding due to a growing emphasis on sustainability and lightweight construction solutions. Materials like acrylic, polycarbonate, and fiberglass-reinforced plastics are being adopted in architectural, automotive, and industrial applications. The need for impact resistance, thermal insulation, and cost-effectiveness drives this trend. Moreover, recycling initiatives and green building certifications are pushing industries to seek eco-friendlier alternatives to traditional glass.
Trends of the market
There is a growing trend towards glass alternative materials in Australia, fueled by sustainability goals and the need for lightweight, shatter-resistant materials. Polycarbonate, acrylic, and biodegradable bioplastics are gaining traction across architectural and packaging applications. The emphasis on recyclable and cost-effective materials that mimic the aesthetic appeal of glass is likely to dominate future market developments.
Challenges of the market
The market for glass alternative materials in Australia faces the challenge of overcoming consumer and industry inertia. Despite the increasing push for sustainable materials, glass remains a popular choice due to its transparency, durability, and aesthetic appeal. Shifting preferences towards alternatives such as plastics, composite materials, and biodegradable options requires significant consumer education and adaptation from manufacturers. Additionally, many alternative materials still struggle with quality control issues, such as durability or safety, especially in high-performance applications. There are also logistical challenges in scaling production of these alternatives to meet demand and ensuring their cost competitiveness against traditional glass.
Investment opportunities in the Market
With rising environmental concerns and the push for sustainability, the Australian glass alternative materials market presents a promising investment opportunity. Companies focusing on the development of alternative materials such as bioplastics, recycled composites, or innovative substances that mimic glass properties are likely to see growth. These alternatives offer a more sustainable approach to glass, appealing to eco-conscious consumers and industries. Investment in research and development for these materials, as well as establishing a supply chain for their mass production, could provide high returns as the market moves toward greener alternatives.
Government Policy of the market
Australias government policies promoting sustainability and reducing carbon footprints are significantly influencing the glass alternative materials market. Policies related to reducing energy consumption and promoting green building practices have led to an increasing demand for alternative materials to traditional glass. These materials, often used in construction and packaging, are designed to be more energy-efficient and environmentally friendly. The government also incentivizes research and development into new materials, and there are subsidies available for businesses adopting these innovations.
Key Highlights of the Report:
- Australia Glass Alternative Materials Market Outlook
- Market Size of Australia Glass Alternative Materials Market, 2025
- Forecast of Australia Glass Alternative Materials Market, 2032
- Historical Data and Forecast of Australia Glass Alternative Materials Revenues & Volume for the Period 2022 - 2032F
- Australia Glass Alternative Materials Market Trend Evolution
- Australia Glass Alternative Materials Market Drivers and Challenges
- Australia Glass Alternative Materials Price Trends
- Australia Glass Alternative Materials Porter's Five Forces
- Australia Glass Alternative Materials Industry Life Cycle
- Historical Data and Forecast of Australia Glass Alternative Materials Market Revenues & Volume By Type for the Period 2022 - 2032F
- Historical Data and Forecast of Australia Glass Alternative Materials Market Revenues & Volume By Acrylic for the Period 2022 - 2032F
- Historical Data and Forecast of Australia Glass Alternative Materials Market Revenues & Volume By Polycarbonate for the Period 2022 - 2032F
- Historical Data and Forecast of Australia Glass Alternative Materials Market Revenues & Volume By Transparent Wood for the Period 2022 - 2032F
- Historical Data and Forecast of Australia Glass Alternative Materials Market Revenues & Volume By Others (Polymers) for the Period 2022 - 2032F
- Historical Data and Forecast of Australia Glass Alternative Materials Market Revenues & Volume By Light Transmission for the Period 2022 - 2032F
- Historical Data and Forecast of Australia Glass Alternative Materials Market Revenues & Volume By Up To 80% for the Period 2022 - 2032F
- Historical Data and Forecast of Australia Glass Alternative Materials Market Revenues & Volume By >80%-90% for the Period 2022 - 2032F
- Historical Data and Forecast of Australia Glass Alternative Materials Market Revenues & Volume By >90% for the Period 2022 - 2032F
- Historical Data and Forecast of Australia Glass Alternative Materials Market Revenues & Volume By Application for the Period 2022 - 2032F
- Historical Data and Forecast of Australia Glass Alternative Materials Market Revenues & Volume By Visual Application for the Period 2022 - 2032F
- Historical Data and Forecast of Australia Glass Alternative Materials Market Revenues & Volume By Automotive for the Period 2022 - 2032F
- Historical Data and Forecast of Australia Glass Alternative Materials Market Revenues & Volume By Electronic for the Period 2022 - 2032F
- Historical Data and Forecast of Australia Glass Alternative Materials Market Revenues & Volume By Construction for the Period 2022 - 2032F
- Historical Data and Forecast of Australia Glass Alternative Materials Market Revenues & Volume By Medical Devices for the Period 2022 - 2032F
- Historical Data and Forecast of Australia Glass Alternative Materials Market Revenues & Volume By Cuvettes for the Period 2022 - 2032F
- Historical Data and Forecast of Australia Glass Alternative Materials Market Revenues & Volume By Aviation for the Period 2022 - 2032F
- Australia Glass Alternative Materials Import Export Trade Statistics
- Market Opportunity Assessment By Type
- Market Opportunity Assessment By Light Transmission
- Market Opportunity Assessment By Application
- Australia Glass Alternative Materials Top Companies Market Share
- Australia Glass Alternative Materials Competitive Benchmarking By Technical and Operational Parameters
- Australia Glass Alternative Materials Company Profiles
- Australia Glass Alternative Materials Key Strategic Recommendations
Australia Glass Alternative Materials Market (2026-2032): FAQs
6Wresearch actively monitors the Australia Glass Alternative Materials Market and publishes its comprehensive annual report, highlighting emerging trends, growth drivers, revenue analysis, and forecast outlook. Our insights help businesses to make data-backed strategic decisions with ongoing market dynamics. Our analysts track relevent industries related to the Australia Glass Alternative Materials Market, allowing our clients with actionable intelligence and reliable forecasts tailored to emerging regional needs.
Yes, we provide customisation as per your requirements. To learn more, feel free to contact us on sales@6wresearch.com
1 Executive Summary |
2 Introduction |
2.1 Key Highlights of the Report |
2.2 Report Description |
2.3 Market Scope & Segmentation |
2.4 Research Methodology |
2.5 Assumptions |
3 Australia Glass Alternative Materials Market Overview |
3.1 Australia Country Macro Economic Indicators |
3.2 Australia Glass Alternative Materials Market Revenues & Volume, 2022 & 2032F |
3.3 Australia Glass Alternative Materials Market - Industry Life Cycle |
3.4 Australia Glass Alternative Materials Market - Porter's Five Forces |
3.5 Australia Glass Alternative Materials Market Revenues & Volume Share, By Type, 2022 & 2032F |
3.6 Australia Glass Alternative Materials Market Revenues & Volume Share, By Light Transmission, 2022 & 2032F |
3.7 Australia Glass Alternative Materials Market Revenues & Volume Share, By Application, 2022 & 2032F |
4 Australia Glass Alternative Materials Market Dynamics |
4.1 Impact Analysis |
4.2 Market Drivers |
4.2.1 Increasing focus on sustainability and eco-friendly materials in construction |
4.2.2 Growing demand for energy-efficient building materials |
4.2.3 Government initiatives promoting the use of alternative materials in construction |
4.3 Market Restraints |
4.3.1 High initial costs associated with glass alternative materials |
4.3.2 Limited availability of skilled labor for installation and maintenance |
4.3.3 Lack of awareness and education about the benefits of glass alternative materials |
5 Australia Glass Alternative Materials Market Trends |
6 Australia Glass Alternative Materials Market, By Types |
6.1 Australia Glass Alternative Materials Market, By Type |
6.1.1 Overview and Analysis |
6.1.2 Australia Glass Alternative Materials Market Revenues & Volume, By Type, 2022 - 2032F |
6.1.3 Australia Glass Alternative Materials Market Revenues & Volume, By Acrylic, 2022 - 2032F |
6.1.4 Australia Glass Alternative Materials Market Revenues & Volume, By Polycarbonate, 2022 - 2032F |
6.1.5 Australia Glass Alternative Materials Market Revenues & Volume, By Transparent Wood, 2022 - 2032F |
6.1.6 Australia Glass Alternative Materials Market Revenues & Volume, By Others (Polymers), 2022 - 2032F |
6.2 Australia Glass Alternative Materials Market, By Light Transmission |
6.2.1 Overview and Analysis |
6.2.2 Australia Glass Alternative Materials Market Revenues & Volume, By Up To 80%, 2022 - 2032F |
6.2.3 Australia Glass Alternative Materials Market Revenues & Volume, By >80%-90%, 2022 - 2032F |
6.2.4 Australia Glass Alternative Materials Market Revenues & Volume, By >90%, 2022 - 2032F |
6.3 Australia Glass Alternative Materials Market, By Application |
6.3.1 Overview and Analysis |
6.3.2 Australia Glass Alternative Materials Market Revenues & Volume, By Visual Application, 2022 - 2032F |
6.3.3 Australia Glass Alternative Materials Market Revenues & Volume, By Automotive, 2022 - 2032F |
6.3.4 Australia Glass Alternative Materials Market Revenues & Volume, By Electronic, 2022 - 2032F |
6.3.5 Australia Glass Alternative Materials Market Revenues & Volume, By Construction, 2022 - 2032F |
6.3.6 Australia Glass Alternative Materials Market Revenues & Volume, By Medical Devices, 2022 - 2032F |
6.3.7 Australia Glass Alternative Materials Market Revenues & Volume, By Cuvettes, 2022 - 2032F |
7 Australia Glass Alternative Materials Market Import-Export Trade Statistics |
7.1 Australia Glass Alternative Materials Market Export to Major Countries |
7.2 Australia Glass Alternative Materials Market Imports from Major Countries |
8 Australia Glass Alternative Materials Market Key Performance Indicators |
8.1 Energy efficiency ratings of buildings using glass alternative materials |
8.2 Number of green building certifications achieved by projects using glass alternative materials |
8.3 Adoption rate of glass alternative materials in new construction projects |
9 Australia Glass Alternative Materials Market - Opportunity Assessment |
9.1 Australia Glass Alternative Materials Market Opportunity Assessment, By Type, 2022 & 2032F |
9.2 Australia Glass Alternative Materials Market Opportunity Assessment, By Light Transmission, 2022 & 2032F |
9.3 Australia Glass Alternative Materials Market Opportunity Assessment, By Application, 2022 & 2032F |
10 Australia Glass Alternative Materials Market - Competitive Landscape |
10.1 Australia Glass Alternative Materials Market Revenue Share, By Companies, 2025 |
10.2 Australia Glass Alternative Materials Market Competitive Benchmarking, By Operating and Technical Parameters |
11 Company Profiles |
12 Recommendations |
13 Disclaimer |
Global Go To Market Strategy - 2030
Export potential enables firms to identify high-growth global markets with greater confidence by combining advanced trade intelligence with a structured quantitative methodology. The framework analyzes emerging demand trends and country-level import patterns while integrating macroeconomic and trade datasets such as GDP and population forecasts, bilateral import–export flows, tariff structures, elasticity differentials between developed and developing economies, geographic distance, and import demand projections. Using weighted trade values from 2020–2024 as the base period to project country-to-country export potential for 2030, these inputs are operationalized through calculated drivers such as gravity model parameters, tariff impact factors, and projected GDP per-capita growth. Through an analysis of hidden potentials, demand hotspots, and market conditions that are most favorable to success, this method enables firms to focus on target countries, maximize returns, and global expansion with data, backed by accuracy.
By factoring in the projected importer demand gap that is currently unmet and could be potential opportunity, it identifies the potential for the Exporter (Country) among 190 countries, against the general trade analysis, which identifies the biggest importer or exporter.
To discover high-growth global markets and optimize your business strategy:
Click Here
Pricing
- Single User License$ 1,995
- Department License$ 2,400
- Site License$ 3,120
- Global License$ 3,795

Leadership Perspectives from Industry Events
Search
Thought Leadership and Analyst Meet


Our Clients
6WResearch In News
- India Export Attractiveness Tracker 2026
- India Air Conditioner Market Set for Strong Rebound in 2026 After Weather-Led Correction and GST-Driven Recovery: 6Wresearch
- ADAS in India: How Automatic Emergency Braking, Blind Spot Detection & Driver Monitoring are Transforming Road Safety
- Doha a strategic location for EV manufacturing hub: IPA Qatar
- Demand for luxury TVs surging in the GCC, says Samsung
- Empowering Growth: The Thriving Journey of Bangladesh’s Cable Industry
Latest Reports
- Nicaragua RPG Gaming Market (2026-2032)
- New Zealand RPG Gaming Market (2026-2032)
- Netherlands RPG Gaming Market (2026-2032)
- Nauru RPG Gaming Market (2026-2032)
- Namibia RPG Gaming Market (2026-2032)
- Mozambique RPG Gaming Market (2026-2032)
- Montenegro RPG Gaming Market (2026-2032)
- Mongolia RPG Gaming Market (2026-2032)
- Monaco RPG Gaming Market (2026-2032)
- Micronesia RPG Gaming Market (2026-2032)
Industry Events and Analyst Meet

EV India Expo 2026

HIMTEX 2026

India Refining Summit 2026

India EV Show 2026

EV tech India Expo 2026
Whitepaper
- Middle East & Africa Commercial Security Market Click here to view more.
- Middle East & Africa Fire Safety Systems & Equipment Market Click here to view more.
- GCC Drone Market Click here to view more.
- Middle East Lighting Fixture Market Click here to view more.
- GCC Physical & Perimeter Security Market Click here to view more.