Australia Graphic Film Market (2026-2032) Outlook | Size, Analysis, Forecast, Industry, Revenue, Share, Growth, Companies, Value & Trends
Market Forecast By Polymer (PVC, PP, PE), By Film Type (Opaque, Reflective, Transparent, Translucent), By End Use (Promotional & Advertisement, Industrial, Automotive) And Competitive Landscape
| Product Code: ETC4600836 | Publication Date: Jul 2023 | Updated Date: Mar 2026 | Product Type: Report | |
| Publisher: 6Wresearch | Author: Summon Dutta | No. of Pages: 85 | No. of Figures: 45 | No. of Tables: 25 |
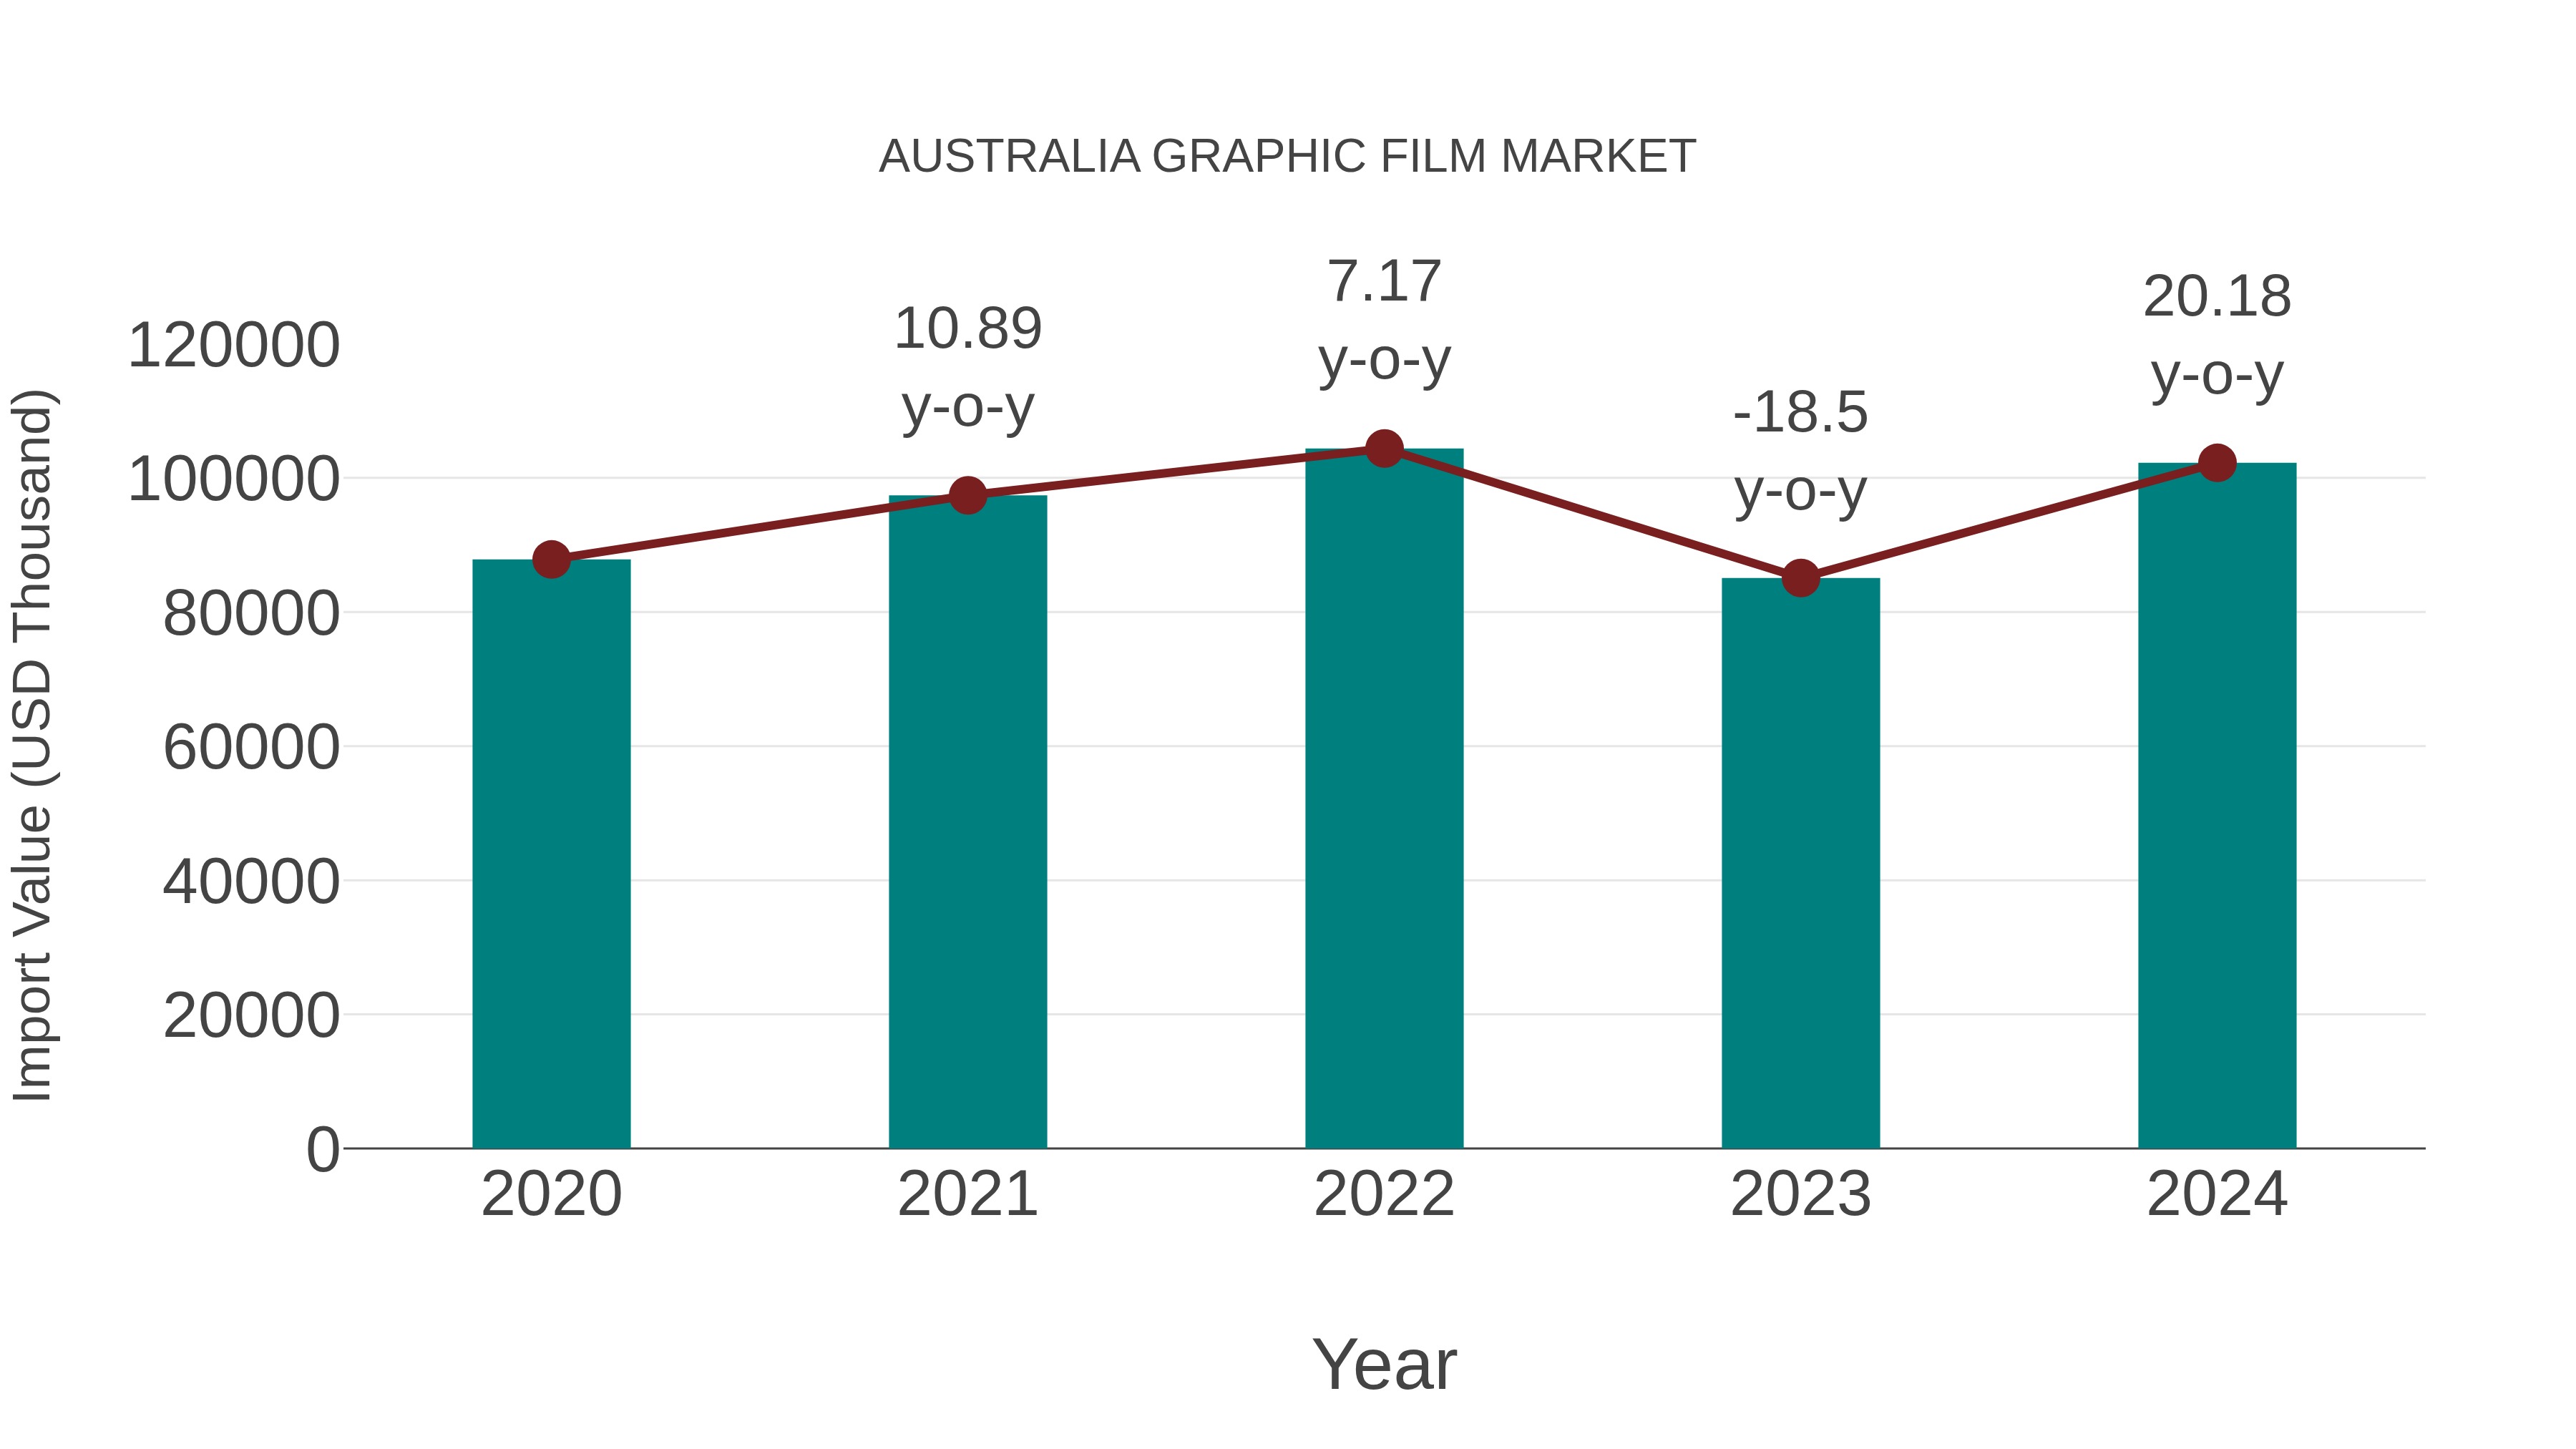
Australia Graphic Film Market: Import Trend Analysis
In the Australia graphic film market, the import trend exhibited a notable growth rate of 20.18% from 2023 to 2024, with a compound annual growth rate (CAGR) of 3.87% from 2020 to 2024. This uptrend could be attributed to increased demand for specialized graphic films, potentially driven by evolving consumer preferences or advancements in printing technology.
Australia Graphic Film Market Overview
Graphic films serve as versatile materials for signage, advertising, vehicle wraps, and architectural applications. In Australia, the graphic film market caters to sign makers, printers, and advertising agencies seeking high-quality films with durability, color vibrancy, and ease of application for visual communication projects.
Drivers of the market
In Australia, the graphic film market is experiencing growth due to the expanding advertising and signage industry, coupled with advancements in printing and graphics technology. Graphic films are widely used for outdoor advertising, vehicle wraps, architectural signage, and promotional displays, driving demand from businesses seeking effective marketing solutions. Furthermore, the versatility, durability, and cost-effectiveness of graphic films make them popular choices for both short-term and long-term advertising campaigns, contributing to market expansion.
Challenges of the market
Challenges in the Australia graphic film market include competition from digital media, environmental concerns, and technological advancements. As digital platforms continue to gain prominence, traditional graphic films face challenges in maintaining market share and relevance. Additionally, environmental regulations and sustainability initiatives drive the demand for eco-friendly alternatives, posing challenges for manufacturers to innovate and adapt.
Government Policy of the market
The Australia government may implement policies to support the film industry, promote cultural diversity, and regulate film production standards. Regulations concerning content classification, censorship, and intellectual property rights may influence the graphic film market. Additionally, initiatives promoting local film production, supporting film festivals, and fostering creative talent development may shape market dynamics.
Key Highlights of the Report:
- Australia Graphic Film Market Outlook
- Market Size of Australia Graphic Film Market, 2025
- Forecast of Australia Graphic Film Market, 2032
- Historical Data and Forecast of Australia Graphic Film Revenues & Volume for the Period 2022-2032F
- Australia Graphic Film Market Trend Evolution
- Australia Graphic Film Market Drivers and Challenges
- Australia Graphic Film Price Trends
- Australia Graphic Film Porter's Five Forces
- Australia Graphic Film Industry Life Cycle
- Historical Data and Forecast of Australia Graphic Film Market Revenues & Volume By Polymer for the Period 2022-2032F
- Historical Data and Forecast of Australia Graphic Film Market Revenues & Volume By PVC for the Period 2022-2032F
- Historical Data and Forecast of Australia Graphic Film Market Revenues & Volume By PP for the Period 2022-2032F
- Historical Data and Forecast of Australia Graphic Film Market Revenues & Volume By PE for the Period 2022-2032F
- Historical Data and Forecast of Australia Graphic Film Market Revenues & Volume By Film Type for the Period 2022-2032F
- Historical Data and Forecast of Australia Graphic Film Market Revenues & Volume By Opaque for the Period 2022-2032F
- Historical Data and Forecast of Australia Graphic Film Market Revenues & Volume By Reflective for the Period 2022-2032F
- Historical Data and Forecast of Australia Graphic Film Market Revenues & Volume By Transparent for the Period 2022-2032F
- Historical Data and Forecast of Australia Graphic Film Market Revenues & Volume By Translucent for the Period 2022-2032F
- Historical Data and Forecast of Australia Graphic Film Market Revenues & Volume By End Use for the Period 2022-2032F
- Historical Data and Forecast of Australia Graphic Film Market Revenues & Volume By Promotional & Advertisement for the Period 2022-2032F
- Historical Data and Forecast of Australia Graphic Film Market Revenues & Volume By Industrial for the Period 2022-2032F
- Historical Data and Forecast of Australia Graphic Film Market Revenues & Volume By Automotive for the Period 2022-2032F
- Australia Graphic Film Import Export Trade Statistics
- Market Opportunity Assessment By Polymer
- Market Opportunity Assessment By Film Type
- Market Opportunity Assessment By End Use
- Australia Graphic Film Top Companies Market Share
- Australia Graphic Film Competitive Benchmarking By Technical and Operational Parameters
- Australia Graphic Film Company Profiles
- Australia Graphic Film Key Strategic Recommendations
Australia Graphic Film Market (2026-2032): FAQs
6Wresearch actively monitors the Australia Graphic Film Market and publishes its comprehensive annual report, highlighting emerging trends, growth drivers, revenue analysis, and forecast outlook. Our insights help businesses to make data-backed strategic decisions with ongoing market dynamics. Our analysts track relevent industries related to the Australia Graphic Film Market, allowing our clients with actionable intelligence and reliable forecasts tailored to emerging regional needs.
Yes, we provide customisation as per your requirements. To learn more, feel free to contact us on sales@6wresearch.com
1 Executive Summary |
2 Introduction |
2.1 Key Highlights of the Report |
2.2 Report Description |
2.3 Market Scope & Segmentation |
2.4 Research Methodology |
2.5 Assumptions |
3 Australia Graphic Film Market Overview |
3.1 Australia Country Macro Economic Indicators |
3.2 Australia Graphic Film Market Revenues & Volume, 2022 & 2032F |
3.3 Australia Graphic Film Market - Industry Life Cycle |
3.4 Australia Graphic Film Market - Porter's Five Forces |
3.5 Australia Graphic Film Market Revenues & Volume Share, By Polymer, 2022 & 2032F |
3.6 Australia Graphic Film Market Revenues & Volume Share, By Film Type, 2022 & 2032F |
3.7 Australia Graphic Film Market Revenues & Volume Share, By End Use, 2022 & 2032F |
4 Australia Graphic Film Market Dynamics |
4.1 Impact Analysis |
4.2 Market Drivers |
4.2.1 Increasing demand for digital printing technologies in various industries |
4.2.2 Growing adoption of graphic films in advertising and promotional activities |
4.2.3 Technological advancements leading to the development of innovative graphic films |
4.3 Market Restraints |
4.3.1 High initial investment required for advanced graphic film technologies |
4.3.2 Fluctuating prices of raw materials impacting the production cost |
4.3.3 Environmental concerns and regulations regarding the disposal of graphic films |
5 Australia Graphic Film Market Trends |
6 Australia Graphic Film Market, By Types |
6.1 Australia Graphic Film Market, By Polymer |
6.1.1 Overview and Analysis |
6.1.2 Australia Graphic Film Market Revenues & Volume, By Polymer, 2022-2032F |
6.1.3 Australia Graphic Film Market Revenues & Volume, By PVC, 2022-2032F |
6.1.4 Australia Graphic Film Market Revenues & Volume, By PP, 2022-2032F |
6.1.5 Australia Graphic Film Market Revenues & Volume, By PE, 2022-2032F |
6.2 Australia Graphic Film Market, By Film Type |
6.2.1 Overview and Analysis |
6.2.2 Australia Graphic Film Market Revenues & Volume, By Opaque, 2022-2032F |
6.2.3 Australia Graphic Film Market Revenues & Volume, By Reflective, 2022-2032F |
6.2.4 Australia Graphic Film Market Revenues & Volume, By Transparent, 2022-2032F |
6.2.5 Australia Graphic Film Market Revenues & Volume, By Translucent, 2022-2032F |
6.3 Australia Graphic Film Market, By End Use |
6.3.1 Overview and Analysis |
6.3.2 Australia Graphic Film Market Revenues & Volume, By Promotional & Advertisement, 2022-2032F |
6.3.3 Australia Graphic Film Market Revenues & Volume, By Industrial, 2022-2032F |
6.3.4 Australia Graphic Film Market Revenues & Volume, By Automotive, 2022-2032F |
7 Australia Graphic Film Market Import-Export Trade Statistics |
7.1 Australia Graphic Film Market Export to Major Countries |
7.2 Australia Graphic Film Market Imports from Major Countries |
8 Australia Graphic Film Market Key Performance Indicators |
8.1 Adoption rate of digital printing technologies in the Australian market |
8.2 Number of companies incorporating graphic films in their marketing strategies |
8.3 Innovation rate in the graphic film industry, measured by the number of patents filed for new products |
9 Australia Graphic Film Market - Opportunity Assessment |
9.1 Australia Graphic Film Market Opportunity Assessment, By Polymer, 2022 & 2032F |
9.2 Australia Graphic Film Market Opportunity Assessment, By Film Type, 2022 & 2032F |
9.3 Australia Graphic Film Market Opportunity Assessment, By End Use, 2022 & 2032F |
10 Australia Graphic Film Market - Competitive Landscape |
10.1 Australia Graphic Film Market Revenue Share, By Companies, 2025 |
10.2 Australia Graphic Film Market Competitive Benchmarking, By Operating and Technical Parameters |
11 Company Profiles |
12 Recommendations |
13 Disclaimer |
Global Go To Market Strategy - 2030
Export potential enables firms to identify high-growth global markets with greater confidence by combining advanced trade intelligence with a structured quantitative methodology. The framework analyzes emerging demand trends and country-level import patterns while integrating macroeconomic and trade datasets such as GDP and population forecasts, bilateral import–export flows, tariff structures, elasticity differentials between developed and developing economies, geographic distance, and import demand projections. Using weighted trade values from 2020–2024 as the base period to project country-to-country export potential for 2030, these inputs are operationalized through calculated drivers such as gravity model parameters, tariff impact factors, and projected GDP per-capita growth. Through an analysis of hidden potentials, demand hotspots, and market conditions that are most favorable to success, this method enables firms to focus on target countries, maximize returns, and global expansion with data, backed by accuracy.
By factoring in the projected importer demand gap that is currently unmet and could be potential opportunity, it identifies the potential for the Exporter (Country) among 190 countries, against the general trade analysis, which identifies the biggest importer or exporter.
To discover high-growth global markets and optimize your business strategy:
Click Here
Pricing
- Single User License$ 1,995
- Department License$ 2,400
- Site License$ 3,120
- Global License$ 3,795

Leadership Perspectives from Industry Events
Search
Thought Leadership and Analyst Meet


Our Clients
6WResearch In News
- India Export Attractiveness Tracker 2026
- India Air Conditioner Market Set for Strong Rebound in 2026 After Weather-Led Correction and GST-Driven Recovery: 6Wresearch
- ADAS in India: How Automatic Emergency Braking, Blind Spot Detection & Driver Monitoring are Transforming Road Safety
- Doha a strategic location for EV manufacturing hub: IPA Qatar
- Demand for luxury TVs surging in the GCC, says Samsung
- Empowering Growth: The Thriving Journey of Bangladesh’s Cable Industry
Latest Reports
- Nicaragua RPG Gaming Market (2026-2032)
- New Zealand RPG Gaming Market (2026-2032)
- Netherlands RPG Gaming Market (2026-2032)
- Nauru RPG Gaming Market (2026-2032)
- Namibia RPG Gaming Market (2026-2032)
- Mozambique RPG Gaming Market (2026-2032)
- Montenegro RPG Gaming Market (2026-2032)
- Mongolia RPG Gaming Market (2026-2032)
- Monaco RPG Gaming Market (2026-2032)
- Micronesia RPG Gaming Market (2026-2032)
Industry Events and Analyst Meet

EV India Expo 2026

HIMTEX 2026

India Refining Summit 2026

India EV Show 2026

EV tech India Expo 2026
Whitepaper
- Middle East & Africa Commercial Security Market Click here to view more.
- Middle East & Africa Fire Safety Systems & Equipment Market Click here to view more.
- GCC Drone Market Click here to view more.
- Middle East Lighting Fixture Market Click here to view more.
- GCC Physical & Perimeter Security Market Click here to view more.