Australia High Purity MTBE Market (2026-2032) | Trends, Value, Growth, Competitive Landscape, Analysis, Forecast, Companies, Share, Outlook, Industry, Size & Revenue, Segmentation
Market Forecast By Application (Agriculture, Pharmaceutical, Cosmetics, Food, Chemical intermediate, Others) And Competitive Landscape
| Product Code: ETC6182540 | Publication Date: Sep 2024 | Updated Date: Mar 2026 | Product Type: Market Research Report | |
| Publisher: 6Wresearch | Author: Sumit Sagar | No. of Pages: 75 | No. of Figures: 35 | No. of Tables: 20 |
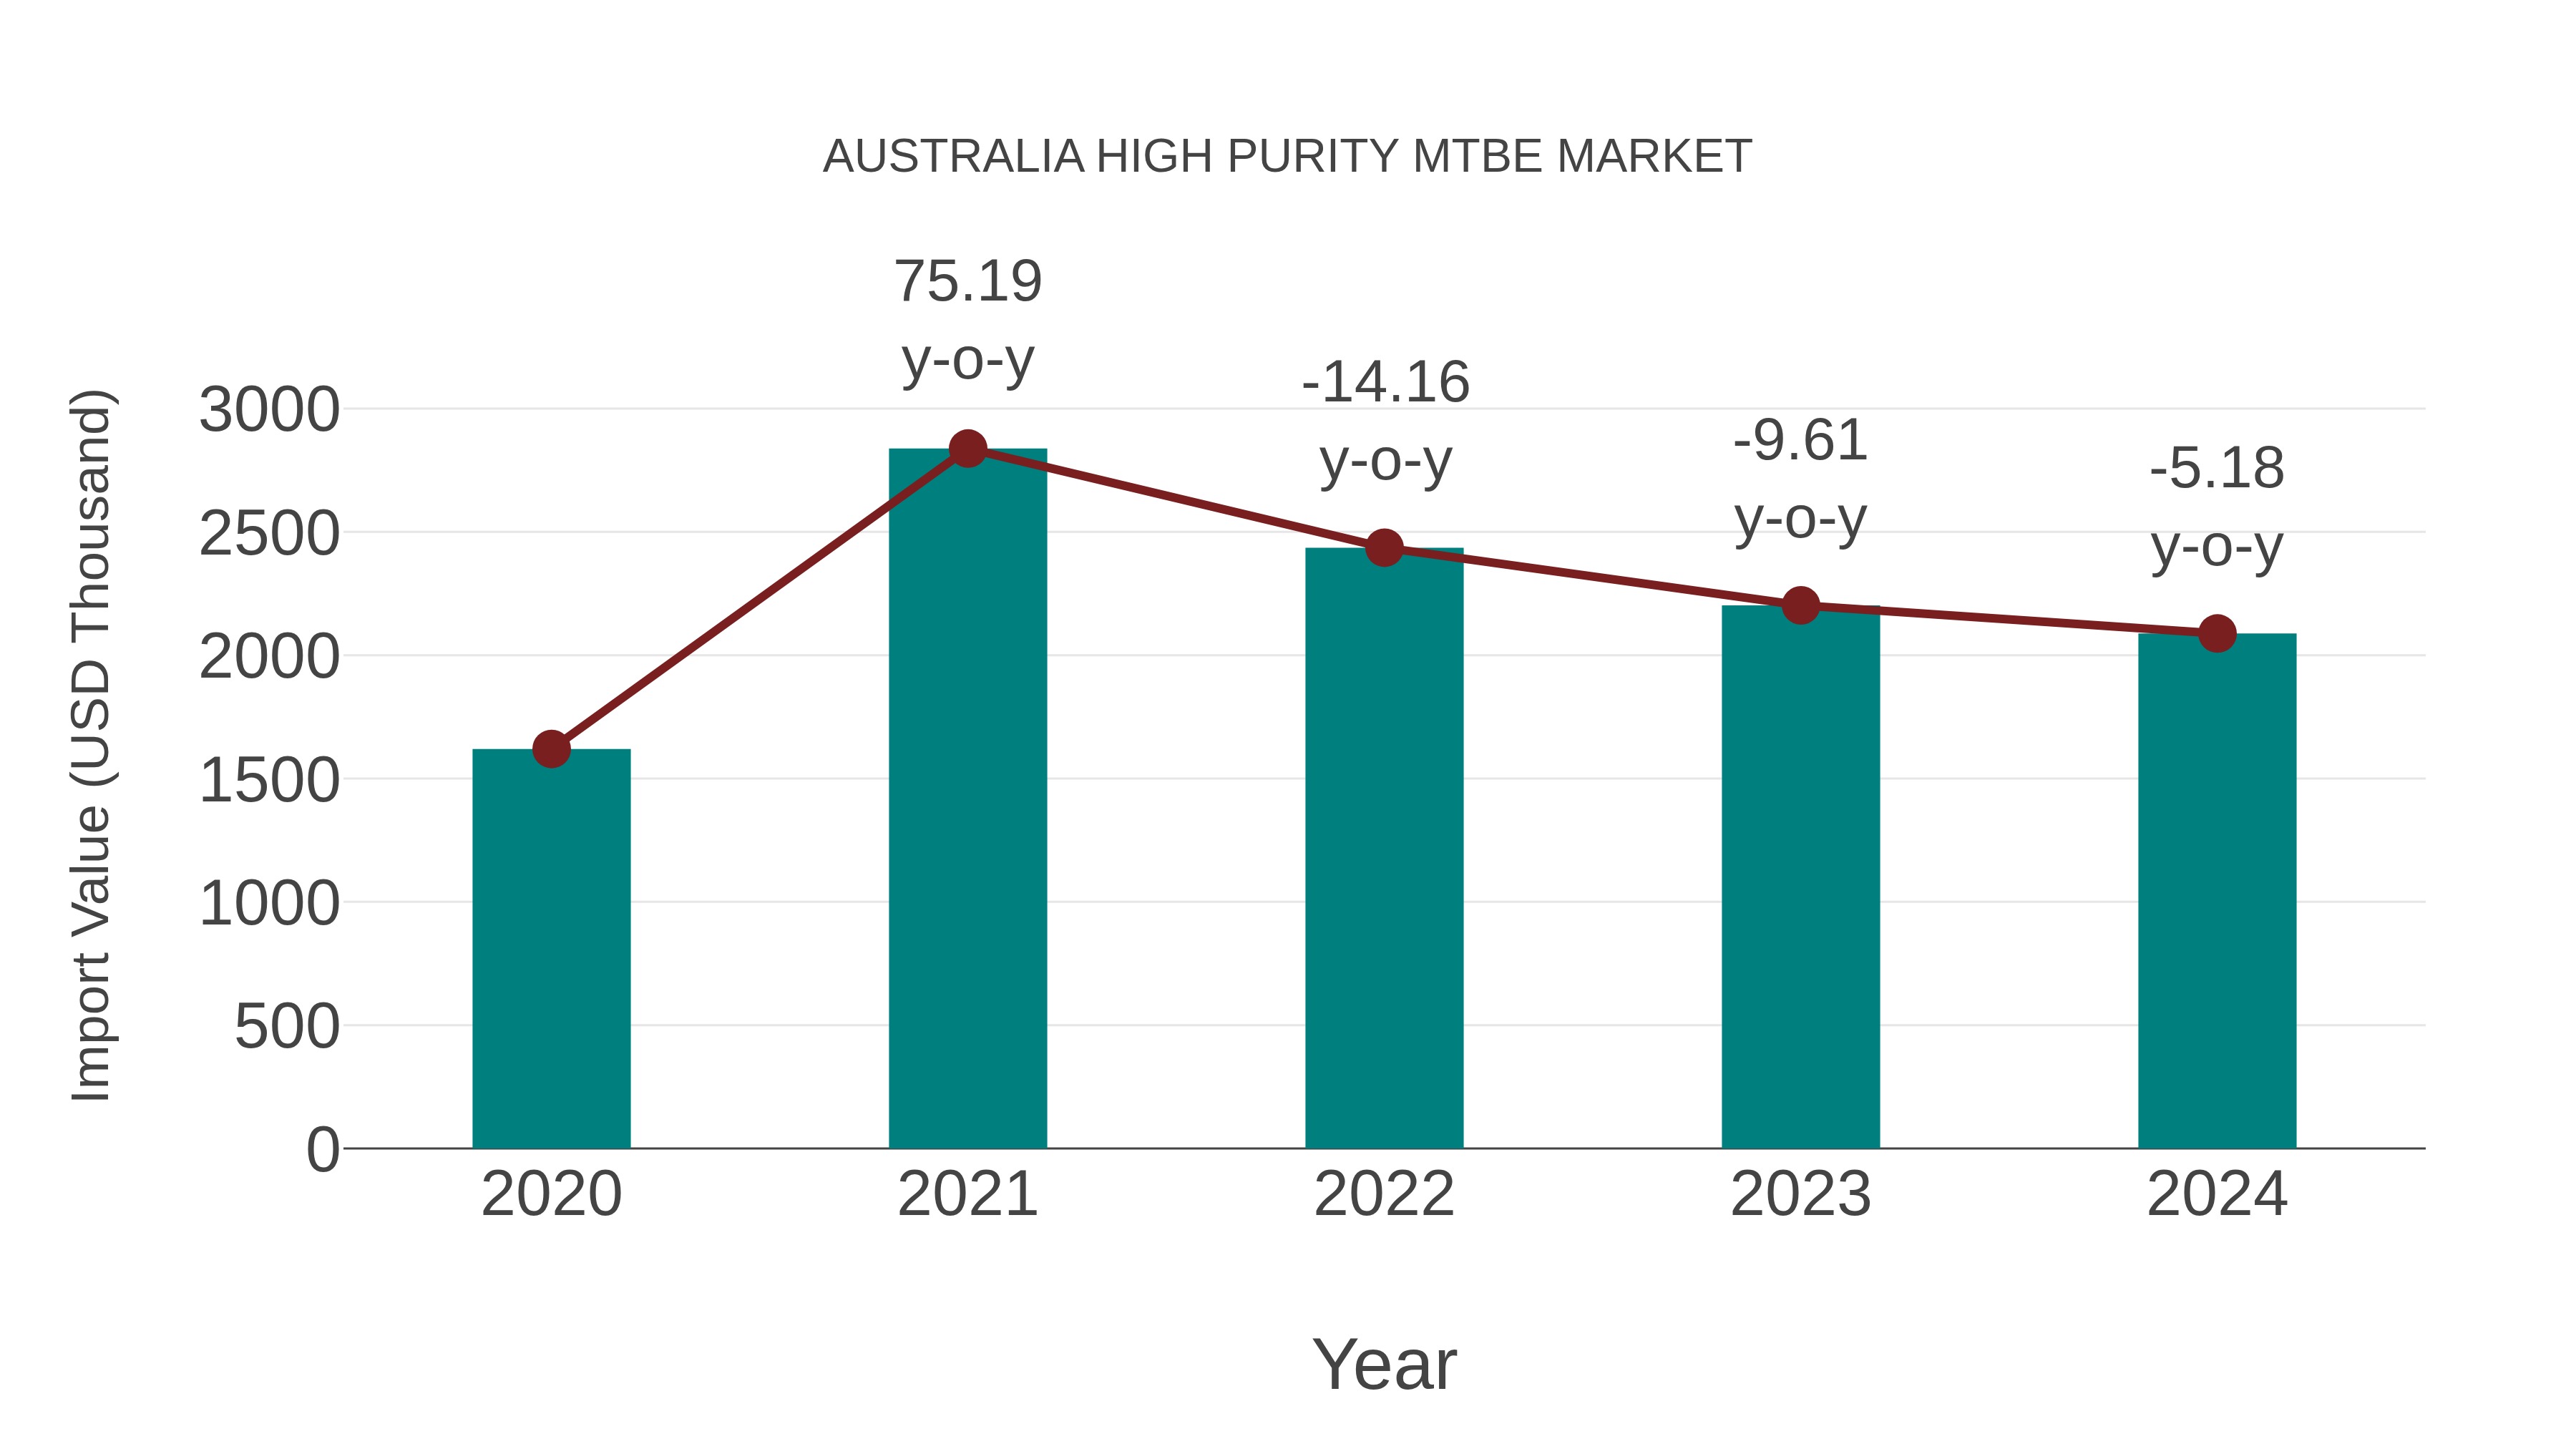
Australia High Purity Mtbe Market: Import Trend Analysis
In 2024, Australia`s high purity MTBE import trend experienced a decline, with a growth rate of -5.18% compared to the previous year. However, the compound annual growth rate (CAGR) for the period 2020-2024 stood at a positive 6.55%. This dip in import momentum could be attributed to shifts in demand dynamics or changes in trade policies affecting the market stability.
Australia High Purity Mtbe Market Overview
The high-purity methyl tertiary-butyl ether (MTBE) market in Australia is driven by its use as an oxygenate in gasoline to improve combustion efficiency and reduce emissions. The demand for high-purity MTBE is largely influenced by the automotive industry and environmental regulations that mandate cleaner fuels. As Australia moves towards cleaner energy sources and stricter emissions standards, the market for high-purity MTBE is expected to grow. The increasing demand for clean fuels will likely sustain market expansion in the coming years.
Trends of the market
The Australian high purity methyl tertiary butyl ether (MTBE) market is influenced by its use as a gasoline additive to increase octane levels and reduce vehicle emissions. With growing environmental concerns, the demand for cleaner-burning fuels is increasing, contributing to the markets growth. Additionally, high purity MTBE is used in the production of chemicals, including those used in the pharmaceutical and agrochemical industries. As regulations tighten on fuel emissions, the Australian market for high purity MTBE is expected to expand.
Challenges of the market
The Australia high purity MTBE (Methyl Tertiary Butyl Ether) market is constrained by environmental concerns and shifting fuel regulations. MTBE is under scrutiny for potential groundwater contamination, leading to restrictions or bans in certain applications, which suppress market demand.
Investment opportunities in the Market
The high purity MTBE (Methyl Tertiary Butyl Ether) market offers niche opportunities tied to fuel additive demand and petrochemical applications. While environmental concerns have limited MTBE use in some regions, Australias fuel industry still relies on it for octane enhancement. Investment in cleaner production techniques and export-oriented supply chains can be strategic.
Government Policy of the market
MTBE (Methyl Tertiary Butyl Ether) usage and production are influenced by Australia`s environmental regulations concerning groundwater contamination and volatile organic compounds (VOCs). Although Australia has not outright banned MTBE as some countries have, there are strict standards for storage, transport, and environmental protection to mitigate risks associated with its use in fuel blending.
Key Highlights of the Report:
- Australia High Purity MTBE Market Outlook
- Market Size of Australia High Purity MTBE Market, 2025
- Forecast of Australia High Purity MTBE Market, 2032
- Historical Data and Forecast of Australia High Purity MTBE Revenues & Volume for the Period 2022 - 2032F
- Australia High Purity MTBE Market Trend Evolution
- Australia High Purity MTBE Market Drivers and Challenges
- Australia High Purity MTBE Price Trends
- Australia High Purity MTBE Porter's Five Forces
- Australia High Purity MTBE Industry Life Cycle
- Historical Data and Forecast of Australia High Purity MTBE Market Revenues & Volume By Application for the Period 2022 - 2032F
- Historical Data and Forecast of Australia High Purity MTBE Market Revenues & Volume By Agriculture for the Period 2022 - 2032F
- Historical Data and Forecast of Australia High Purity MTBE Market Revenues & Volume By Pharmaceutical for the Period 2022 - 2032F
- Historical Data and Forecast of Australia High Purity MTBE Market Revenues & Volume By Cosmetics for the Period 2022 - 2032F
- Historical Data and Forecast of Australia High Purity MTBE Market Revenues & Volume By Food for the Period 2022 - 2032F
- Historical Data and Forecast of Australia High Purity MTBE Market Revenues & Volume By Chemical intermediate for the Period 2022 - 2032F
- Historical Data and Forecast of Australia High Purity MTBE Market Revenues & Volume By Others for the Period 2022 - 2032F
- Australia High Purity MTBE Import Export Trade Statistics
- Market Opportunity Assessment By Application
- Australia High Purity MTBE Top Companies Market Share
- Australia High Purity MTBE Competitive Benchmarking By Technical and Operational Parameters
- Australia High Purity MTBE Company Profiles
- Australia High Purity MTBE Key Strategic Recommendations
Australia High Purity MTBE Market (2026-2032): FAQs
6Wresearch actively monitors the Australia High Purity MTBE Market and publishes its comprehensive annual report, highlighting emerging trends, growth drivers, revenue analysis, and forecast outlook. Our insights help businesses to make data-backed strategic decisions with ongoing market dynamics. Our analysts track relevent industries related to the Australia High Purity MTBE Market, allowing our clients with actionable intelligence and reliable forecasts tailored to emerging regional needs.
Yes, we provide customisation as per your requirements. To learn more, feel free to contact us on sales@6wresearch.com
1 Executive Summary |
2 Introduction |
2.1 Key Highlights of the Report |
2.2 Report Description |
2.3 Market Scope & Segmentation |
2.4 Research Methodology |
2.5 Assumptions |
3 Australia High Purity MTBE Market Overview |
3.1 Australia Country Macro Economic Indicators |
3.2 Australia High Purity MTBE Market Revenues & Volume, 2022 & 2032F |
3.3 Australia High Purity MTBE Market - Industry Life Cycle |
3.4 Australia High Purity MTBE Market - Porter's Five Forces |
3.5 Australia High Purity MTBE Market Revenues & Volume Share, By Application, 2022 & 2032F |
4 Australia High Purity MTBE Market Dynamics |
4.1 Impact Analysis |
4.2 Market Drivers |
4.2.1 Increasing demand for high purity MTBE in the automotive and chemical industries in Australia |
4.2.2 Growth in the construction and infrastructure sector driving the demand for high purity MTBE as a solvent |
4.2.3 Rising investments in research and development for the production of high purity MTBE |
4.3 Market Restraints |
4.3.1 Fluctuating crude oil prices impacting the production cost of high purity MTBE |
4.3.2 Stringent regulations on emissions and environmental concerns affecting the market growth |
4.3.3 Competition from alternative fuel additives and solvents limiting market expansion |
5 Australia High Purity MTBE Market Trends |
6 Australia High Purity MTBE Market, By Types |
6.1 Australia High Purity MTBE Market, By Application |
6.1.1 Overview and Analysis |
6.1.2 Australia High Purity MTBE Market Revenues & Volume, By Application, 2022 - 2032F |
6.1.3 Australia High Purity MTBE Market Revenues & Volume, By Agriculture, 2022 - 2032F |
6.1.4 Australia High Purity MTBE Market Revenues & Volume, By Pharmaceutical, 2022 - 2032F |
6.1.5 Australia High Purity MTBE Market Revenues & Volume, By Cosmetics, 2022 - 2032F |
6.1.6 Australia High Purity MTBE Market Revenues & Volume, By Food, 2022 - 2032F |
6.1.7 Australia High Purity MTBE Market Revenues & Volume, By Chemical intermediate, 2022 - 2032F |
6.1.8 Australia High Purity MTBE Market Revenues & Volume, By Others, 2022 - 2032F |
7 Australia High Purity MTBE Market Import-Export Trade Statistics |
7.1 Australia High Purity MTBE Market Export to Major Countries |
7.2 Australia High Purity MTBE Market Imports from Major Countries |
8 Australia High Purity MTBE Market Key Performance Indicators |
8.1 Average selling price of high purity MTBE in Australia |
8.2 Adoption rate of high purity MTBE in key industries |
8.3 Number of research collaborations and partnerships in the high purity MTBE market in Australia |
9 Australia High Purity MTBE Market - Opportunity Assessment |
9.1 Australia High Purity MTBE Market Opportunity Assessment, By Application, 2022 & 2032F |
10 Australia High Purity MTBE Market - Competitive Landscape |
10.1 Australia High Purity MTBE Market Revenue Share, By Companies, 2025 |
10.2 Australia High Purity MTBE Market Competitive Benchmarking, By Operating and Technical Parameters |
11 Company Profiles |
12 Recommendations |
13 Disclaimer |
Export potential assessment - trade Analytics for 2030
Export potential enables firms to identify high-growth global markets with greater confidence by combining advanced trade intelligence with a structured quantitative methodology. The framework analyzes emerging demand trends and country-level import patterns while integrating macroeconomic and trade datasets such as GDP and population forecasts, bilateral import–export flows, tariff structures, elasticity differentials between developed and developing economies, geographic distance, and import demand projections. Using weighted trade values from 2020–2024 as the base period to project country-to-country export potential for 2030, these inputs are operationalized through calculated drivers such as gravity model parameters, tariff impact factors, and projected GDP per-capita growth. Through an analysis of hidden potentials, demand hotspots, and market conditions that are most favorable to success, this method enables firms to focus on target countries, maximize returns, and global expansion with data, backed by accuracy.
By factoring in the projected importer demand gap that is currently unmet and could be potential opportunity, it identifies the potential for the Exporter (Country) among 190 countries, against the general trade analysis, which identifies the biggest importer or exporter.
To discover high-growth global markets and optimize your business strategy:
Click Here
Pricing
- Single User License$ 1,995
- Department License$ 2,400
- Site License$ 3,120
- Global License$ 3,795

Search
Thought Leadership and Analyst Meet


Our Clients
Latest Reports
- Taiwan Food Delivery Platform Market (2026-2032) | Companies, Outlook, Analysis, Trends, Value, Revenue, Segmentation, Share, Forecast, Competitive Landscape, Growth, Size & Forecast
- United Kingdom (UK) Long-term Care Insurance Market (2026-2032) | Growth, Share, Consumer Insights, Drivers, Opportunities, Competition, Pricing Analysis, Segments, Restraints, Companies, Competitive, Value, Outlook, Size, Demand, Analysis, Challenges, Strategic Insights, Investment Trends, Revenue, Trends, Supply, Forecast
- United Kingdom (UK) Long Term Care Market (2026-2032) | Companies, Outlook, Analysis, Trends, Value, Revenue, Segmentation, Share, Forecast, Competitive Landscape, Growth, Size & Forecast
- Iraq Insulation and Waterproofing Market (2026-2032) | Outlook, Drivers, Growth, Size, Share, Industry, Revenue, Trends, Demand, Competitive, Strategic Insights, Opportunities, Segments, Companies, Challenges, Strategy, Consumer Insights, Analysis, Investment Trends, Value, Segmentation, Forecast, Restraints
- India Switchgear Market Outlook (2026-2032) | Size, Share, Trends, Growth, Revenue, Forecast, Analysis, Value, Outlook
- Pakistan Contraceptive Implants Market (2025-2031) | Demand, Growth, Size, Share, Industry, Pricing Analysis, Competitive, Strategic Insights, Strategy, Consumer Insights, Analysis, Investment Trends, Opportunities, Revenue, Segments, Value, Segmentation, Supply, Forecast, Restraints, Outlook, Competition, Drivers, Trends, Companies, Challenges
- Sri Lanka Packaging Market (2026-2032) | Outlook, Competition, Drivers, Trends, Demand, Pricing Analysis, Competitive, Strategic Insights, Companies, Challenges, Strategy, Consumer Insights, Analysis, Investment Trends, Opportunities, Growth, Size, Share, Industry, Revenue, Segments, Value, Segmentation, Supply, Forecast, Restraints
- India Kids Watches Market (2026-2032) | Strategy, Consumer Insights, Analysis, Investment Trends, Opportunities, Growth, Size, Share, Industry, Revenue, Segments, Value, Segmentation, Supply, Forecast, Restraints, Outlook, Competition, Drivers, Trends, Demand, Pricing Analysis, Competitive, Strategic Insights, Companies, Challenges
- Saudi Arabia Core Assurance Service Market (2025-2031) | Strategy, Consumer Insights, Analysis, Investment Trends, Opportunities, Growth, Size, Share, Industry, Revenue, Segments, Value, Segmentation, Supply, Forecast, Restraints, Outlook, Competition, Drivers, Trends, Demand, Pricing Analysis, Competitive, Strategic Insights, Companies, Challenges
- Romania Uninterruptible Power Supply (UPS) Market (2026-2032) | Industry, Analysis, Revenue, Size, Forecast, Outlook, Value, Trends, Share, Growth & Companies
Industry Events and Analyst Meet

India EV Show 2026

EV tech India Expo 2026

Auto Tech Asia 2026

Battery Tech India 2026

Smart Production Solutions Guangzhou 2026
Whitepaper
- Middle East & Africa Commercial Security Market Click here to view more.
- Middle East & Africa Fire Safety Systems & Equipment Market Click here to view more.
- GCC Drone Market Click here to view more.
- Middle East Lighting Fixture Market Click here to view more.
- GCC Physical & Perimeter Security Market Click here to view more.
6WResearch In News
- Doha a strategic location for EV manufacturing hub: IPA Qatar
- Demand for luxury TVs surging in the GCC, says Samsung
- Empowering Growth: The Thriving Journey of Bangladesh’s Cable Industry
- Demand for luxury TVs surging in the GCC, says Samsung
- Video call with a traditional healer? Once unthinkable, it’s now common in South Africa
- Intelligent Buildings To Smooth GCC’s Path To Net Zero