Australia industrial vehicles Market (2026-2032) | Growth, Share, Revenue, Size, Forecast, Outlook, Industry, Value, Analysis, Companies & Trends
Market Forecast By Product Type (Forklift, Aisle Truck, Tow Tractor, Container Handler), By Drive Type (Internal Combustion Engine, Battery-Operated, Gas-Powered), By Application (Industrial , Cargo) And Competitive Landscape
| Product Code: ETC029755 | Publication Date: Oct 2020 | Updated Date: Jun 2026 | Product Type: Report | |
| Publisher: 6Wresearch | Author: Ravi Bhandari | No. of Pages: 70 | No. of Figures: 35 | No. of Tables: 5 |
Australia industrial vehicles Market Summary
The australia industrial vehicles market was estimated at USD 214 Million in 2025 and is projected to reach USD 251 Million by 2032, growing at a CAGR of 2.4% from 2026 to 2032.
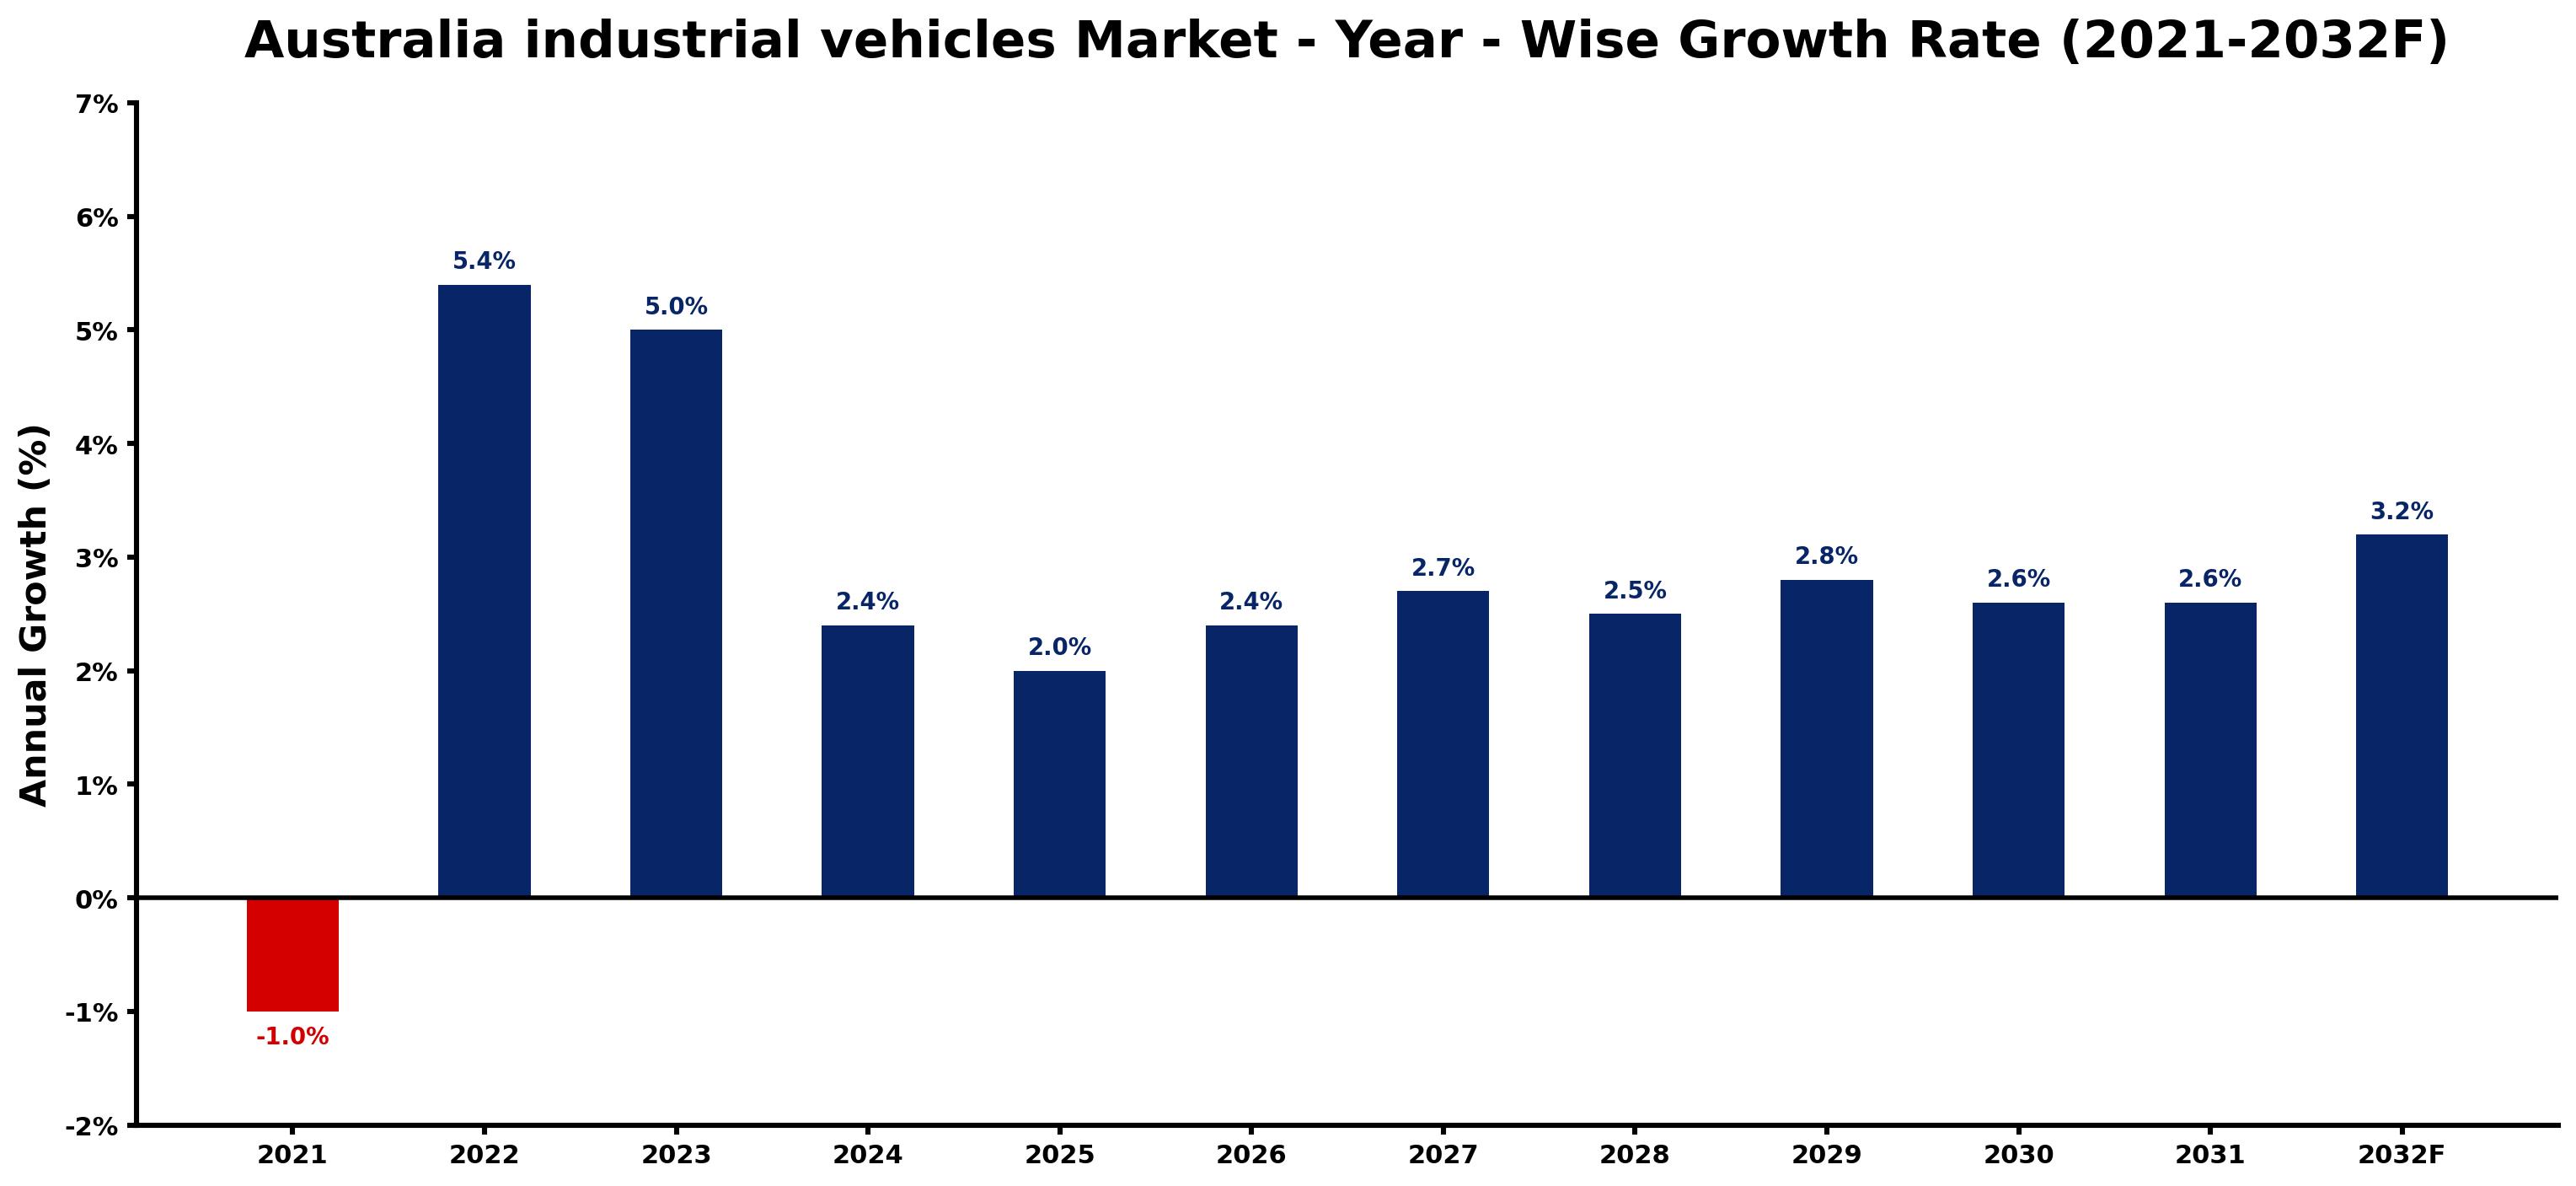
Australia industrial vehicles Market Growth Rate Analysis (2021-2032)
The Australian industrial vehicles market experienced a challenging phase in 2021, contracting by 1.0% due to pandemic-related disruptions. However, recovery was robust in 2022, with growth rebounding to 5.4%, fueled by heightened demand for logistics and manufacturing capabilities as businesses adapted to evolving supply chain needs. The trend continued into 2023 with a solid 5.0% growth, reflecting ongoing investments in infrastructure and a shift towards automation. Projections indicate a more moderated growth trajectory, with yearly expansions hovering around 2.4% to 3.2% through 2032, driven by increasing digitalization, energy transition efforts, and the integration of advanced technologies in industrial operations.
Australia industrial vehicles Market Year-wise Growth Rate and Key Drivers
This graph highlights how the Australia industrial vehicles Market has steadily grown over the past five years, supported by major growth factors.
The table below presents the year wise growth rates along with the key drivers influencing the market
| Year | Growth Rate | Major Drivers |
| 2021 | -1.0% | Supply chain disruptions limited production availability, causing delays that dampened customer demand for industrial vehicles. |
| 2022 | 5.4% | Infrastructure upgrades accelerate, leading to heightened demand for specialized industrial vehicles. |
| 2023 | 5.0% | Sustainability trends encourage adoption of eco-friendly vehicles across multiple industrial sectors. |
| 2024 | 2.4% | Technological innovations in automation significantly improve vehicle efficiency and operational costs. |
| 2025 | 2.0% | Growing construction projects in urban areas create a need for robust material handling vehicles. |
| 2026 | 2.4% | Increased investment in logistics and supply chains directly influences industrial vehicle procurement. |
| 2027 | 2.7% | Focus on workforce safety drives the development of advanced vehicle safety features. |
| 2028 | 2.5% | Economic expansion and trade agreements foster an environment ripe for vehicle market growth. |
| 2029 | 2.8% | Adoption of electric vehicles becomes mainstream, reshaping fleet management strategies across sectors. |
| 2030 | 2.6% | Demand for smart vehicles rises, integrating IoT technology for improved fleet management. |
| 2031 | 2.6% | Global supply chain shifts encourage local production, enhancing vehicle availability in Australia. |
| 2032 | 3.2% | Emerging markets in renewable energy create niche opportunities for specialized industrial vehicles. |
Note - Market size estimations and growth projections presented in this report are based on 6Wresearch's advanced forecasting approach, validated with industry datasets as of June 2026.
Australia industrial vehicles Market Synopsis
The Australia industrial vehicles Market is projected to reach 2.4% and witness significant growth during the forecast period (2026-2032). This growth is influenced by various factors, including the increasing demand for material handling solutions across multiple sectors such as logistics, manufacturing, and distribution. The expanding e-commerce landscape and the need for efficient supply chain management further propel the adoption of industrial vehicles, particularly forklifts, pallet trucks, and order pickers.
Australia industrial vehicles Market Growth Drivers
The Australia industrial vehicles market is supported by a range of drivers that enhance its growth potential. Key factors include:
- The rising demand for automated material handling solutions that improve operational efficiency in warehouses and industrial settings.
- A booming logistics industry fueled by the acceleration of e-commerce, necessitating efficient transportation and storage solutions.
- An increasing focus on workplace safety and productivity, which drives businesses to invest in advanced industrial vehicles.
- Technological advancements in vehicle design, including features like telematics and energy-efficient drivetrains, enhancing overall performance.
- Regulatory pressures for sustainability and emissions reduction, prompting a shift towards electric and alternative fuel vehicles.
Australia industrial vehicles Market Challenges and Restraints
Despite its growth trajectory, the Australia industrial vehicles market faces inherent challenges that may affect its pace. Notable challenges include:
- The necessity for manufacturers to comply with stringent safety standards and regulations that dictate vehicle design and functionality.
- The need for continuous technological innovation to address the demand for autonomous and connected industrial vehicles.
- Economic fluctuations which can impact investment decisions within the logistics and manufacturing sectors.
- The challenge of integrating new technologies into existing operations without disrupting workflows.
- Competition from alternative material handling solutions, such as automated guided vehicles (AGVs) and drones, which may attract investments away from traditional industrial vehicles.
Australia industrial vehicles Market Government Investment and Initiatives
Government initiatives play a pivotal role in shaping the Australia industrial vehicles market. Policies aimed at enhancing safety, operational efficiency, and sustainability are underway, including:
- Regulations encouraging the adoption of electric vehicles and alternative fuel options to reduce emissions in industrial operations.
- Incentives for businesses to invest in advanced material handling technologies that improve safety and productivity.
- Public spending on infrastructure development which supports logistics and manufacturing sectors, indirectly benefiting the industrial vehicles market.
- Support for research and development aimed at advancing autonomous vehicle technologies relevant to industrial applications.
- Collaborations between government bodies and industry stakeholders to promote best practices in vehicle design and deployment that enhance operational efficiency.
Australia industrial vehicles Market Latest Developments (May 2025 - June 2026)
In the period from May 2025 to June 2026, the Australia industrial vehicles market has witnessed several notable developments. These include:
- Increased investment in automated vehicle technologies as companies seek to enhance operational efficiency while addressing labor shortages.
- A significant shift towards electric and hybrid vehicles due to regulatory pressure and market demand for sustainable solutions.
- Implementation of advanced telematics systems in industrial vehicles, allowing for real-time tracking and operational insights that improve efficiency and safety.
- Growing partnerships between technology firms and vehicle manufacturers to create innovative solutions that cater to the evolving needs of the industry.
- Heightened focus on training and upskilling of personnel to effectively manage new technology integrations in industrial settings.
Australia industrial vehicles Market - Key Attractiveness of the Report
- 10 Years of Market Numbers
- Historical Data Starting from 2022 to 2025
- Base Year: 2025
- Forecast Data until 2032
- Key Performance Indicators Impacting the Market
- Major Upcoming Developments and Projects
Key Highlights of the Report:
- Australia industrial vehicles Market Outlook
- Market Size of Australia industrial vehicles Market, 2025
- Forecast of Australia industrial vehicles Market, 2032
- Historical Data and Forecast of Australia industrial vehicles Revenues & Volume for the Period 2022-2032F
- Australia industrial vehicles Market Trend Evolution
- Australia industrial vehicles Market Drivers and Challenges
- Australia industrial vehicles Price Trends
- Australia industrial vehicles Porter's Five Forces
- Australia industrial vehicles Industry Life Cycle
- Historical Data and Forecast of Australia industrial vehicles Market Revenues & Volume By Product Type for the Period 2022-2032F
- Historical Data and Forecast of Australia industrial vehicles Market Revenues & Volume By Forklift for the Period 2022-2032F
- Historical Data and Forecast of Australia industrial vehicles Market Revenues & Volume By Aisle Truck for the Period 2022-2032F
- Historical Data and Forecast of Australia industrial vehicles Market Revenues & Volume By Tow Tractor for the Period 2022-2032F
- Historical Data and Forecast of Australia industrial vehicles Market Revenues & Volume By Container Handler for the Period 2022-2032F
- Historical Data and Forecast of Australia industrial vehicles Market Revenues & Volume By Drive Type for the Period 2022-2032F
- Historical Data and Forecast of Australia industrial vehicles Market Revenues & Volume By Internal Combustion Engine for the Period 2022-2032F
- Historical Data and Forecast of Australia industrial vehicles Market Revenues & Volume By Battery-Operated for the Period 2022-2032F
- Historical Data and Forecast of Australia industrial vehicles Market Revenues & Volume By Gas-Powered for the Period 2022-2032F
- Historical Data and Forecast of Australia industrial vehicles Market Revenues & Volume By Application for the Period 2022-2032F
- Historical Data and Forecast of Australia industrial vehicles Market Revenues & Volume By Industrial for the Period 2022-2032F
- Historical Data and Forecast of Australia industrial vehicles Market Revenues & Volume By Cargo for the Period 2022-2032F
- Australia industrial vehicles Import Export Trade Statistics
- Market Opportunity Assessment By Product Type
- Market Opportunity Assessment By Drive Type
- Market Opportunity Assessment By Application
- Australia industrial vehicles Top Companies Market Share
- Australia industrial vehicles Competitive Benchmarking By Technical and Operational Parameters
- Australia industrial vehicles Company Profiles
- Australia industrial vehicles Key Strategic Recommendations
Frequently Asked Questions About the Market Study (FAQs):
The growth is primarily driven by the increasing demand for material handling solutions, the rise of e-commerce, and the need for improved operational efficiency in various sectors.
Challenges include regulatory compliance, the need for technological advancements, and competition from alternative material handling solutions.
The government supports this market through regulations, incentives for adopting sustainable technologies, and investments in infrastructure that benefit logistics and manufacturing sectors.
Recent developments include increased investment in automation, a shift towards electric vehicles, and the integration of advanced telematics systems into industrial vehicles.
6Wresearch actively monitors the Australia industrial vehicles Market and publishes its comprehensive annual report, highlighting emerging trends, growth drivers, revenue analysis, and forecast outlook. Our insights help businesses to make data-backed strategic decisions with ongoing market dynamics. Our analysts track relevent industries related to the Australia industrial vehicles Market, allowing our clients with actionable intelligence and reliable forecasts tailored to emerging regional needs.
Yes, we provide customisation as per your requirements. To learn more, feel free to contact us on sales@6wresearch.com
1 Executive Summary |
2 Introduction |
2.1 Key Highlights of the Report |
2.2 Report Description |
2.3 Market Scope & Segmentation |
2.4 Research Methodology |
2.5 Assumptions |
3 Australia industrial vehicles Market Overview |
3.1 Australia Country Macro Economic Indicators |
3.2 Australia industrial vehicles Market Revenues & Volume, 2022 & 2032F |
3.3 Australia industrial vehicles Market - Industry Life Cycle |
3.4 Australia industrial vehicles Market - Porter's Five Forces |
3.5 Australia industrial vehicles Market Revenues & Volume Share, By Product Type, 2022 & 2032F |
3.6 Australia industrial vehicles Market Revenues & Volume Share, By Drive Type, 2022 & 2032F |
3.7 Australia industrial vehicles Market Revenues & Volume Share, By Application, 2022 & 2032F |
4 Australia industrial vehicles Market Dynamics |
4.1 Impact Analysis |
4.2 Market Drivers |
4.2.1 Growing demand for industrial vehicles due to expansion in the industrial sector in Australia |
4.2.2 Technological advancements leading to the development of more efficient and sustainable industrial vehicles |
4.2.3 Increasing focus on safety regulations driving the adoption of industrial vehicles in Australia |
4.3 Market Restraints |
4.3.1 High initial investment required for purchasing industrial vehicles |
4.3.2 Fluctuating raw material prices impacting the manufacturing cost of industrial vehicles |
4.3.3 Stringent environmental regulations increasing the costs of compliance for industrial vehicle manufacturers |
5 Australia industrial vehicles Market Trends |
6 Australia industrial vehicles Market, By Types |
6.1 Australia industrial vehicles Market, By Product Type |
6.1.1 Overview and Analysis |
6.1.2 Australia industrial vehicles Market Revenues & Volume, By Product Type, 2022-2032F |
6.1.3 Australia industrial vehicles Market Revenues & Volume, By Forklift, 2022-2032F |
6.1.4 Australia industrial vehicles Market Revenues & Volume, By Aisle Truck, 2022-2032F |
6.1.5 Australia industrial vehicles Market Revenues & Volume, By Tow Tractor, 2022-2032F |
6.1.6 Australia industrial vehicles Market Revenues & Volume, By Container Handler, 2022-2032F |
6.2 Australia industrial vehicles Market, By Drive Type |
6.2.1 Overview and Analysis |
6.2.2 Australia industrial vehicles Market Revenues & Volume, By Internal Combustion Engine, 2022-2032F |
6.2.3 Australia industrial vehicles Market Revenues & Volume, By Battery-Operated, 2022-2032F |
6.2.4 Australia industrial vehicles Market Revenues & Volume, By Gas-Powered, 2022-2032F |
6.3 Australia industrial vehicles Market, By Application |
6.3.1 Overview and Analysis |
6.3.2 Australia industrial vehicles Market Revenues & Volume, By Industrial , 2022-2032F |
6.3.3 Australia industrial vehicles Market Revenues & Volume, By Cargo, 2022-2032F |
7 Australia industrial vehicles Market Import-Export Trade Statistics |
7.1 Australia industrial vehicles Market Export to Major Countries |
7.2 Australia industrial vehicles Market Imports from Major Countries |
8 Australia industrial vehicles Market Key Performance Indicators |
8.1 Average age of industrial vehicles in operation |
8.2 Adoption rate of electric or hybrid industrial vehicles |
8.3 Number of safety certifications obtained by industrial vehicle manufacturers |
9 Australia industrial vehicles Market - Opportunity Assessment |
9.1 Australia industrial vehicles Market Opportunity Assessment, By Product Type, 2022 & 2032F |
9.2 Australia industrial vehicles Market Opportunity Assessment, By Drive Type, 2022 & 2032F |
9.3 Australia industrial vehicles Market Opportunity Assessment, By Application, 2022 & 2032F |
10 Australia industrial vehicles Market - Competitive Landscape |
10.1 Australia industrial vehicles Market Revenue Share, By Companies, 2025 |
10.2 Australia industrial vehicles Market Competitive Benchmarking, By Operating and Technical Parameters |
11 Company Profiles |
12 Recommendations |
13 Disclaimer |
Global Go To Market Strategy - 2030
Export potential enables firms to identify high-growth global markets with greater confidence by combining advanced trade intelligence with a structured quantitative methodology. The framework analyzes emerging demand trends and country-level import patterns while integrating macroeconomic and trade datasets such as GDP and population forecasts, bilateral import–export flows, tariff structures, elasticity differentials between developed and developing economies, geographic distance, and import demand projections. Using weighted trade values from 2020–2024 as the base period to project country-to-country export potential for 2030, these inputs are operationalized through calculated drivers such as gravity model parameters, tariff impact factors, and projected GDP per-capita growth. Through an analysis of hidden potentials, demand hotspots, and market conditions that are most favorable to success, this method enables firms to focus on target countries, maximize returns, and global expansion with data, backed by accuracy.
By factoring in the projected importer demand gap that is currently unmet and could be potential opportunity, it identifies the potential for the Exporter (Country) among 190 countries, against the general trade analysis, which identifies the biggest importer or exporter.
To discover high-growth global markets and optimize your business strategy:
Click Here
Pricing
- Single User License$ 1,995
- Department License$ 2,400
- Site License$ 3,120
- Global License$ 3,795

Leadership Perspectives from Industry Events
Search
Thought Leadership and Analyst Meet


Our Clients
6WResearch In News
- India Air Conditioner Market Set for Strong Rebound in 2026 After Weather-Led Correction and GST-Driven Recovery: 6Wresearch
- ADAS in India: How Automatic Emergency Braking, Blind Spot Detection & Driver Monitoring are Transforming Road Safety
- Doha a strategic location for EV manufacturing hub: IPA Qatar
- Demand for luxury TVs surging in the GCC, says Samsung
- Empowering Growth: The Thriving Journey of Bangladesh’s Cable Industry
- Demand for luxury TVs surging in the GCC, says Samsung
Latest Reports
- Nicaragua RPG Gaming Market (2026-2032)
- New Zealand RPG Gaming Market (2026-2032)
- Netherlands RPG Gaming Market (2026-2032)
- Nauru RPG Gaming Market (2026-2032)
- Namibia RPG Gaming Market (2026-2032)
- Mozambique RPG Gaming Market (2026-2032)
- Montenegro RPG Gaming Market (2026-2032)
- Mongolia RPG Gaming Market (2026-2032)
- Monaco RPG Gaming Market (2026-2032)
- Micronesia RPG Gaming Market (2026-2032)
Industry Events and Analyst Meet

HIMTEX 2026

India Refining Summit 2026

India EV Show 2026

EV tech India Expo 2026

Auto Tech Asia 2026
Whitepaper
- Middle East & Africa Commercial Security Market Click here to view more.
- Middle East & Africa Fire Safety Systems & Equipment Market Click here to view more.
- GCC Drone Market Click here to view more.
- Middle East Lighting Fixture Market Click here to view more.
- GCC Physical & Perimeter Security Market Click here to view more.