Australia Inulin and Fructooligosaccharide Market (2026-2032) | Industry, Value, Growth, Forecast, Outlook, Analysis, Share, Trends, Segmentation, Size & Revenue, Competitive Landscape, Companies
Market Forecast By Source (Agave, Chicory, Jerusalem Artichoke, Others), By Form (Powder, Liquid), By Nature (Organic, Conventional), By Type (Fructo-oligosaccharide, Inulin), By End user (Clinical Nutrition, Dietary Supplements, Functional Food& Beverages, Dairy Products, Infant Formula, Breakfast Cereals &Cereal Bars, Meat Product, Animal Nutrition) And Competitive Landscape
| Product Code: ETC6183294 | Publication Date: Sep 2024 | Updated Date: Mar 2026 | Product Type: Market Research Report | |
| Publisher: 6Wresearch | Author: Shubham Padhi | No. of Pages: 75 | No. of Figures: 35 | No. of Tables: 20 |
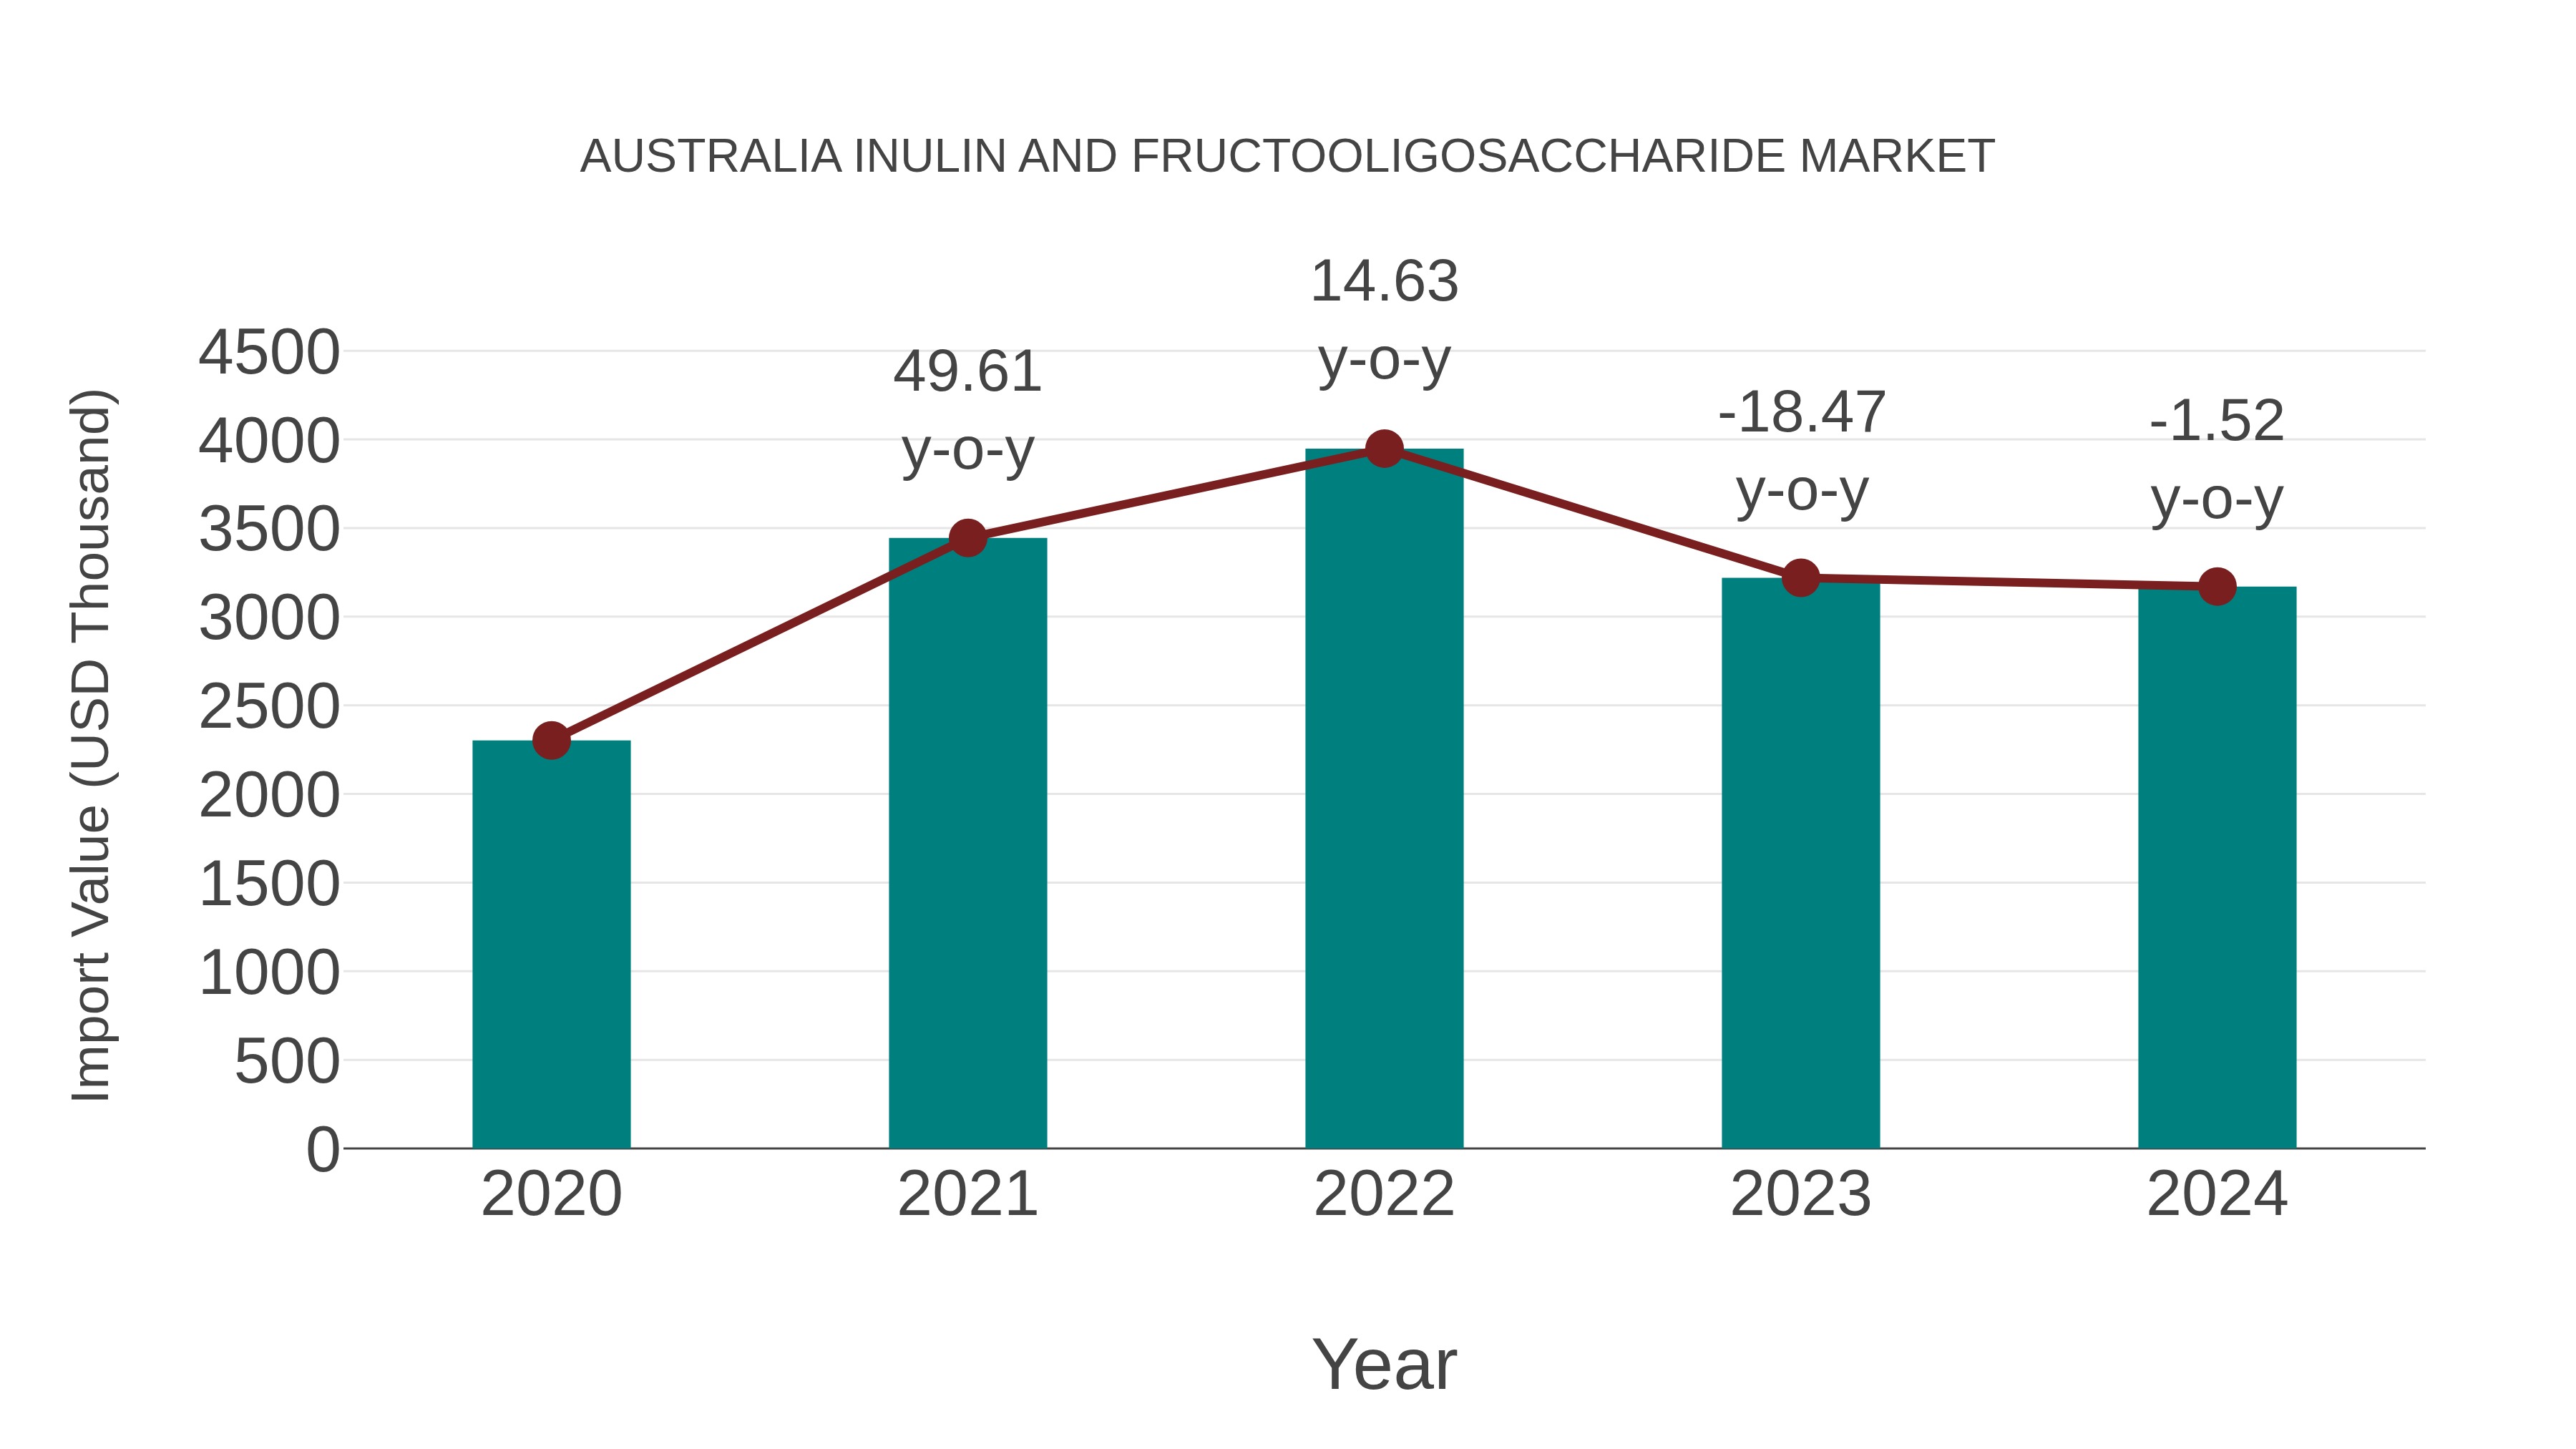
Australia Inulin and Fructooligosaccharide Market: Import Trend Analysis
Australia`s import trend for inulin and fructooligosaccharide experienced a -1.52% growth rate from 2023 to 2024, with a compound annual growth rate (CAGR) of 8.33% from 2020 to 2024. This decline in growth could be attributed to shifting consumer preferences, changes in dietary habits, or market saturation affecting import momentum in the sector.
Australia Inulin And Fructooligosaccharide Market Overview
The market for inulin and fructooligosaccharides in Australia is growing due to rising health awareness and consumer preference for prebiotic ingredients. These non-digestible fibers are increasingly used in functional foods, beverages, and dietary supplements. A strong push towards plant-based and gut-health-supporting products has also expanded their applications in the food industry, particularly within vegan and gluten-free categories.
Trends of the market
The Australian inulin and fructooligosaccharide (FOS) market is witnessing an upward trend due to the rising popularity of prebiotics and functional foods. Health-conscious consumers are increasingly drawn to natural dietary fibers for their digestive health and immune system benefits. The demand is particularly strong in the food and beverage industry, including dairy alternatives, baked goods, and health supplements. Additionally, the increasing prevalence of lactose intolerance and the growing vegan population are fostering product innovations using inulin and FOS as fat and sugar replacers.
Challenges of the market
The market for Inulin and Fructooligosaccharide in Australia faces the challenge of increasing competition from synthetic alternatives and cheaper substitutes in the food and beverage sector. Consumer demand for these prebiotic ingredients is rising, but manufacturers must educate the market on the benefits of using natural fiber supplements over other alternatives. Additionally, fluctuations in raw material supply and the costs associated with sourcing high-quality inulin and fructooligosaccharides affect pricing and market dynamics.
Investment opportunities in the Market
The inulin and fructooligosaccharide (FOS) market in Australia is seeing growth due to increasing consumer demand for dietary fibers and prebiotic foods. These ingredients, commonly used in functional foods and beverages, offer health benefits such as improved digestive health and enhanced immunity. As Australian consumers become more health-conscious, the market for inulin and FOS is expanding, creating opportunities for investment in production and distribution. Moreover, the growing trend toward plant-based and low-sugar alternatives presents a unique opportunity to innovate in the food and beverage sectors by developing products that cater to these emerging consumer preferences.
Government Policy of the market
The inulin and fructooligosaccharide market in Australia benefits from increasing consumer demand for functional foods, dietary supplements, and prebiotics. Government health policies that emphasize the importance of nutrition and healthy eating habits drive the adoption of products containing inulin and fructooligosaccharides. The Australian government, through initiatives like the National Nutrition Policy, promotes consumer awareness of dietary fiber and gut health. Food safety regulations, particularly those enforced by Food Standards Australia New Zealand (FSANZ), ensure that inulin and fructooligosaccharides meet the necessary quality and safety standards. Additionally, policies that support the growing organic food sector also contribute to the markets expansion.
Key Highlights of the Report:
- Australia Inulin and Fructooligosaccharide Market Outlook
- Market Size of Australia Inulin and Fructooligosaccharide Market, 2025
- Forecast of Australia Inulin and Fructooligosaccharide Market, 2032
- Historical Data and Forecast of Australia Inulin and Fructooligosaccharide Revenues & Volume for the Period 2022 - 2032F
- Australia Inulin and Fructooligosaccharide Market Trend Evolution
- Australia Inulin and Fructooligosaccharide Market Drivers and Challenges
- Australia Inulin and Fructooligosaccharide Price Trends
- Australia Inulin and Fructooligosaccharide Porter's Five Forces
- Australia Inulin and Fructooligosaccharide Industry Life Cycle
- Historical Data and Forecast of Australia Inulin and Fructooligosaccharide Market Revenues & Volume By Source for the Period 2022 - 2032F
- Historical Data and Forecast of Australia Inulin and Fructooligosaccharide Market Revenues & Volume By Agave for the Period 2022 - 2032F
- Historical Data and Forecast of Australia Inulin and Fructooligosaccharide Market Revenues & Volume By Chicory for the Period 2022 - 2032F
- Historical Data and Forecast of Australia Inulin and Fructooligosaccharide Market Revenues & Volume By Jerusalem Artichoke for the Period 2022 - 2032F
- Historical Data and Forecast of Australia Inulin and Fructooligosaccharide Market Revenues & Volume By Others for the Period 2022 - 2032F
- Historical Data and Forecast of Australia Inulin and Fructooligosaccharide Market Revenues & Volume By Form for the Period 2022 - 2032F
- Historical Data and Forecast of Australia Inulin and Fructooligosaccharide Market Revenues & Volume By Powder for the Period 2022 - 2032F
- Historical Data and Forecast of Australia Inulin and Fructooligosaccharide Market Revenues & Volume By Liquid for the Period 2022 - 2032F
- Historical Data and Forecast of Australia Inulin and Fructooligosaccharide Market Revenues & Volume By Nature for the Period 2022 - 2032F
- Historical Data and Forecast of Australia Inulin and Fructooligosaccharide Market Revenues & Volume By Organic for the Period 2022 - 2032F
- Historical Data and Forecast of Australia Inulin and Fructooligosaccharide Market Revenues & Volume By Conventional for the Period 2022 - 2032F
- Historical Data and Forecast of Australia Inulin and Fructooligosaccharide Market Revenues & Volume By Type for the Period 2022 - 2032F
- Historical Data and Forecast of Australia Inulin and Fructooligosaccharide Market Revenues & Volume By Fructo-oligosaccharide for the Period 2022 - 2032F
- Historical Data and Forecast of Australia Inulin and Fructooligosaccharide Market Revenues & Volume By Inulin for the Period 2022 - 2032F
- Historical Data and Forecast of Australia Inulin and Fructooligosaccharide Market Revenues & Volume By End user for the Period 2022 - 2032F
- Historical Data and Forecast of Australia Inulin and Fructooligosaccharide Market Revenues & Volume By Clinical Nutrition for the Period 2022 - 2032F
- Historical Data and Forecast of Australia Inulin and Fructooligosaccharide Market Revenues & Volume By Dietary Supplements for the Period 2022 - 2032F
- Historical Data and Forecast of Australia Inulin and Fructooligosaccharide Market Revenues & Volume By Functional Food& Beverages for the Period 2022 - 2032F
- Historical Data and Forecast of Australia Inulin and Fructooligosaccharide Market Revenues & Volume By Dairy Products for the Period 2022 - 2032F
- Historical Data and Forecast of Australia Inulin and Fructooligosaccharide Market Revenues & Volume By Infant Formula for the Period 2022 - 2032F
- Historical Data and Forecast of Australia Inulin and Fructooligosaccharide Market Revenues & Volume By Breakfast Cereals &Cereal Bars for the Period 2022 - 2032F
- Historical Data and Forecast of Australia Inulin and Fructooligosaccharide Market Revenues & Volume By Meat Product for the Period 2022 - 2032F
- Historical Data and Forecast of Australia Inulin and Fructooligosaccharide Market Revenues & Volume By Animal Nutrition for the Period 2022 - 2032F
- Australia Inulin and Fructooligosaccharide Import Export Trade Statistics
- Market Opportunity Assessment By Source
- Market Opportunity Assessment By Form
- Market Opportunity Assessment By Nature
- Market Opportunity Assessment By Type
- Market Opportunity Assessment By End user
- Australia Inulin and Fructooligosaccharide Top Companies Market Share
- Australia Inulin and Fructooligosaccharide Competitive Benchmarking By Technical and Operational Parameters
- Australia Inulin and Fructooligosaccharide Company Profiles
- Australia Inulin and Fructooligosaccharide Key Strategic Recommendations
Australia Inulin and Fructooligosaccharide Market (2026-2032): FAQs
6Wresearch actively monitors the Australia Inulin and Fructooligosaccharide Market and publishes its comprehensive annual report, highlighting emerging trends, growth drivers, revenue analysis, and forecast outlook. Our insights help businesses to make data-backed strategic decisions with ongoing market dynamics. Our analysts track relevent industries related to the Australia Inulin and Fructooligosaccharide Market, allowing our clients with actionable intelligence and reliable forecasts tailored to emerging regional needs.
Yes, we provide customisation as per your requirements. To learn more, feel free to contact us on sales@6wresearch.com
1 Executive Summary |
2 Introduction |
2.1 Key Highlights of the Report |
2.2 Report Description |
2.3 Market Scope & Segmentation |
2.4 Research Methodology |
2.5 Assumptions |
3 Australia Inulin and Fructooligosaccharide Market Overview |
3.1 Australia Country Macro Economic Indicators |
3.2 Australia Inulin and Fructooligosaccharide Market Revenues & Volume, 2022 & 2032F |
3.3 Australia Inulin and Fructooligosaccharide Market - Industry Life Cycle |
3.4 Australia Inulin and Fructooligosaccharide Market - Porter's Five Forces |
3.5 Australia Inulin and Fructooligosaccharide Market Revenues & Volume Share, By Source, 2022 & 2032F |
3.6 Australia Inulin and Fructooligosaccharide Market Revenues & Volume Share, By Form, 2022 & 2032F |
3.7 Australia Inulin and Fructooligosaccharide Market Revenues & Volume Share, By Nature, 2022 & 2032F |
3.8 Australia Inulin and Fructooligosaccharide Market Revenues & Volume Share, By Type, 2022 & 2032F |
3.9 Australia Inulin and Fructooligosaccharide Market Revenues & Volume Share, By End user, 2022 & 2032F |
4 Australia Inulin and Fructooligosaccharide Market Dynamics |
4.1 Impact Analysis |
4.2 Market Drivers |
4.2.1 Increasing consumer awareness about the health benefits of inulin and fructooligosaccharides |
4.2.2 Growing demand for natural and functional food ingredients |
4.2.3 Rise in prevalence of lifestyle diseases such as obesity and diabetes, driving the demand for healthier food alternatives |
4.3 Market Restraints |
4.3.1 High production costs associated with inulin and fructooligosaccharides |
4.3.2 Lack of standardized regulations and labeling requirements for these ingredients |
4.3.3 Limited availability of raw materials for production, affecting supply chain stability |
5 Australia Inulin and Fructooligosaccharide Market Trends |
6 Australia Inulin and Fructooligosaccharide Market, By Types |
6.1 Australia Inulin and Fructooligosaccharide Market, By Source |
6.1.1 Overview and Analysis |
6.1.2 Australia Inulin and Fructooligosaccharide Market Revenues & Volume, By Source, 2022 - 2032F |
6.1.3 Australia Inulin and Fructooligosaccharide Market Revenues & Volume, By Agave, 2022 - 2032F |
6.1.4 Australia Inulin and Fructooligosaccharide Market Revenues & Volume, By Chicory, 2022 - 2032F |
6.1.5 Australia Inulin and Fructooligosaccharide Market Revenues & Volume, By Jerusalem Artichoke, 2022 - 2032F |
6.1.6 Australia Inulin and Fructooligosaccharide Market Revenues & Volume, By Others, 2022 - 2032F |
6.2 Australia Inulin and Fructooligosaccharide Market, By Form |
6.2.1 Overview and Analysis |
6.2.2 Australia Inulin and Fructooligosaccharide Market Revenues & Volume, By Powder, 2022 - 2032F |
6.2.3 Australia Inulin and Fructooligosaccharide Market Revenues & Volume, By Liquid, 2022 - 2032F |
6.3 Australia Inulin and Fructooligosaccharide Market, By Nature |
6.3.1 Overview and Analysis |
6.3.2 Australia Inulin and Fructooligosaccharide Market Revenues & Volume, By Organic, 2022 - 2032F |
6.3.3 Australia Inulin and Fructooligosaccharide Market Revenues & Volume, By Conventional, 2022 - 2032F |
6.4 Australia Inulin and Fructooligosaccharide Market, By Type |
6.4.1 Overview and Analysis |
6.4.2 Australia Inulin and Fructooligosaccharide Market Revenues & Volume, By Fructo-oligosaccharide, 2022 - 2032F |
6.4.3 Australia Inulin and Fructooligosaccharide Market Revenues & Volume, By Inulin, 2022 - 2032F |
6.5 Australia Inulin and Fructooligosaccharide Market, By End user |
6.5.1 Overview and Analysis |
6.5.2 Australia Inulin and Fructooligosaccharide Market Revenues & Volume, By Clinical Nutrition, 2022 - 2032F |
6.5.3 Australia Inulin and Fructooligosaccharide Market Revenues & Volume, By Dietary Supplements, 2022 - 2032F |
6.5.4 Australia Inulin and Fructooligosaccharide Market Revenues & Volume, By Functional Food& Beverages, 2022 - 2032F |
6.5.5 Australia Inulin and Fructooligosaccharide Market Revenues & Volume, By Dairy Products, 2022 - 2032F |
6.5.6 Australia Inulin and Fructooligosaccharide Market Revenues & Volume, By Infant Formula, 2022 - 2032F |
6.5.7 Australia Inulin and Fructooligosaccharide Market Revenues & Volume, By Breakfast Cereals &Cereal Bars, 2022 - 2032F |
6.5.8 Australia Inulin and Fructooligosaccharide Market Revenues & Volume, By Animal Nutrition, 2022 - 2032F |
6.5.9 Australia Inulin and Fructooligosaccharide Market Revenues & Volume, By Animal Nutrition, 2022 - 2032F |
7 Australia Inulin and Fructooligosaccharide Market Import-Export Trade Statistics |
7.1 Australia Inulin and Fructooligosaccharide Market Export to Major Countries |
7.2 Australia Inulin and Fructooligosaccharide Market Imports from Major Countries |
8 Australia Inulin and Fructooligosaccharide Market Key Performance Indicators |
8.1 Consumer adoption rate of products containing inulin and fructooligosaccharides |
8.2 Number of new product launches featuring inulin and fructooligosaccharides |
8.3 Research and development investments in innovative applications of these ingredients |
9 Australia Inulin and Fructooligosaccharide Market - Opportunity Assessment |
9.1 Australia Inulin and Fructooligosaccharide Market Opportunity Assessment, By Source, 2022 & 2032F |
9.2 Australia Inulin and Fructooligosaccharide Market Opportunity Assessment, By Form, 2022 & 2032F |
9.3 Australia Inulin and Fructooligosaccharide Market Opportunity Assessment, By Nature, 2022 & 2032F |
9.4 Australia Inulin and Fructooligosaccharide Market Opportunity Assessment, By Type, 2022 & 2032F |
9.5 Australia Inulin and Fructooligosaccharide Market Opportunity Assessment, By End user, 2022 & 2032F |
10 Australia Inulin and Fructooligosaccharide Market - Competitive Landscape |
10.1 Australia Inulin and Fructooligosaccharide Market Revenue Share, By Companies, 2025 |
10.2 Australia Inulin and Fructooligosaccharide Market Competitive Benchmarking, By Operating and Technical Parameters |
11 Company Profiles |
12 Recommendations |
13 Disclaimer |
Global Go To Market Strategy - 2030
Export potential enables firms to identify high-growth global markets with greater confidence by combining advanced trade intelligence with a structured quantitative methodology. The framework analyzes emerging demand trends and country-level import patterns while integrating macroeconomic and trade datasets such as GDP and population forecasts, bilateral import–export flows, tariff structures, elasticity differentials between developed and developing economies, geographic distance, and import demand projections. Using weighted trade values from 2020–2024 as the base period to project country-to-country export potential for 2030, these inputs are operationalized through calculated drivers such as gravity model parameters, tariff impact factors, and projected GDP per-capita growth. Through an analysis of hidden potentials, demand hotspots, and market conditions that are most favorable to success, this method enables firms to focus on target countries, maximize returns, and global expansion with data, backed by accuracy.
By factoring in the projected importer demand gap that is currently unmet and could be potential opportunity, it identifies the potential for the Exporter (Country) among 190 countries, against the general trade analysis, which identifies the biggest importer or exporter.
To discover high-growth global markets and optimize your business strategy:
Click Here
Pricing
- Single User License$ 1,995
- Department License$ 2,400
- Site License$ 3,120
- Global License$ 3,795

Leadership Perspectives from Industry Events
Search
Thought Leadership and Analyst Meet


Our Clients
6WResearch In News
- India Export Attractiveness Tracker 2026
- India Air Conditioner Market Set for Strong Rebound in 2026 After Weather-Led Correction and GST-Driven Recovery: 6Wresearch
- ADAS in India: How Automatic Emergency Braking, Blind Spot Detection & Driver Monitoring are Transforming Road Safety
- Doha a strategic location for EV manufacturing hub: IPA Qatar
- Demand for luxury TVs surging in the GCC, says Samsung
- Empowering Growth: The Thriving Journey of Bangladesh’s Cable Industry
Latest Reports
- Nicaragua RPG Gaming Market (2026-2032)
- New Zealand RPG Gaming Market (2026-2032)
- Netherlands RPG Gaming Market (2026-2032)
- Nauru RPG Gaming Market (2026-2032)
- Namibia RPG Gaming Market (2026-2032)
- Mozambique RPG Gaming Market (2026-2032)
- Montenegro RPG Gaming Market (2026-2032)
- Mongolia RPG Gaming Market (2026-2032)
- Monaco RPG Gaming Market (2026-2032)
- Micronesia RPG Gaming Market (2026-2032)
Industry Events and Analyst Meet

EV India Expo 2026

HIMTEX 2026

India Refining Summit 2026

India EV Show 2026

EV tech India Expo 2026
Whitepaper
- Middle East & Africa Commercial Security Market Click here to view more.
- Middle East & Africa Fire Safety Systems & Equipment Market Click here to view more.
- GCC Drone Market Click here to view more.
- Middle East Lighting Fixture Market Click here to view more.
- GCC Physical & Perimeter Security Market Click here to view more.