Australia Jam Jelly and Preserve Market (2026-2032) | Consumer Insights, Outlook, Drivers, Segmentation, Restraints, Revenue, Competitive, Share, Challenges, Pricing Analysis, Growth, Strategy, Companies, Industry, Size, Competition, Segments, Forecast, Demand, Opportunities, Trends, Supply, Value, Analysis, Investment Trends, Strategic Insights
Market Forecast By Product Type (Jam, Jelly, Preserves), By Ingredient Type (Fruit-Based, Sugar-Free, Organic), By Distribution Channel (Supermarkets, Online Stores, Specialty Stores), By Packaging Type (Glass Jar, Plastic Container, Squeeze Bottle) And Competitive Landscape
| Product Code: ETC12878270 | Publication Date: Apr 2025 | Updated Date: Feb 2026 | Product Type: Market Research Report | |
| Publisher: 6Wresearch | Author: Sachin Kumar Rai | No. of Pages: 65 | No. of Figures: 34 | No. of Tables: 19 |
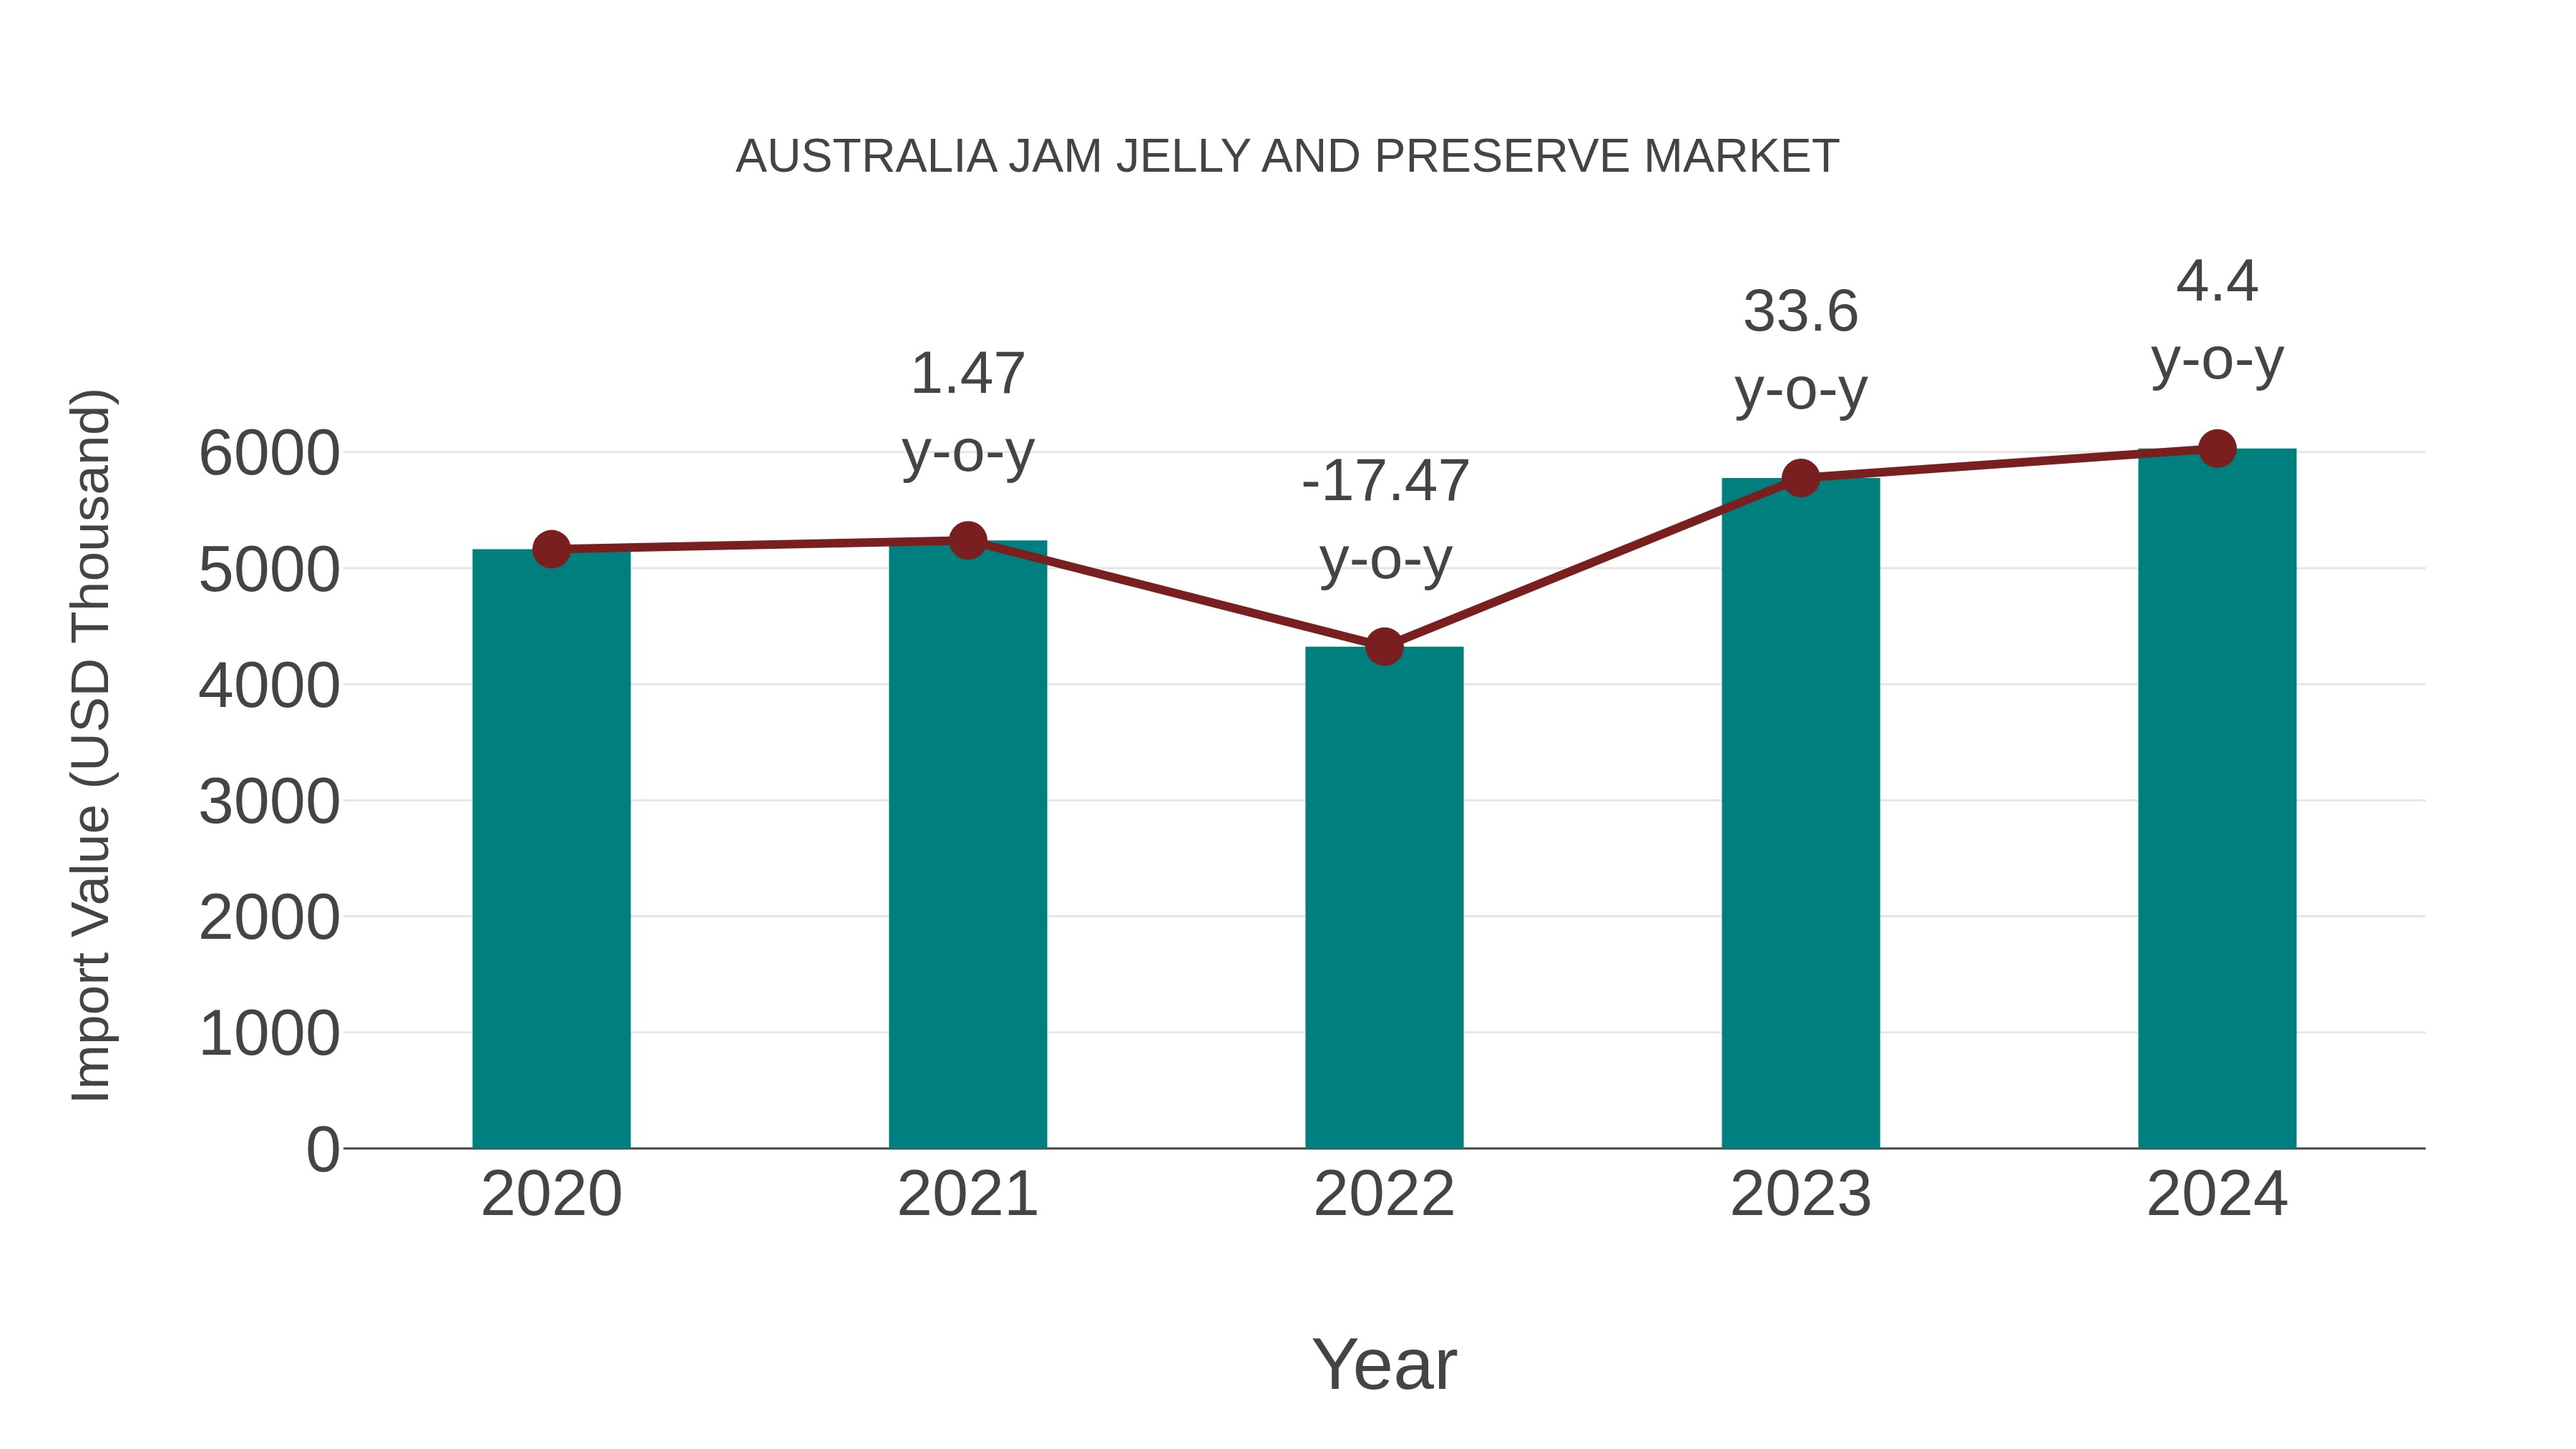
Australia Jam Jelly and Preserve Market: Import Trend Analysis
In the Australia jam, jelly, and preserve market, the import trend showed a growth rate of 4.4% from 2023 to 2024, with a compound annual growth rate (CAGR) of 3.96% from 2020 to 2024. This import momentum can be attributed to shifting consumer preferences towards diverse flavors and healthier product options, indicating a potential demand shift in the market.
Key Highlights of the Report:
- Australia Jam Jelly and Preserve Market Outlook
- Market Size of Australia Jam Jelly and Preserve Market, 2025
- Forecast of Australia Jam Jelly and Preserve Market, 2032
- Historical Data and Forecast of Australia Jam Jelly and Preserve Revenues & Volume for the Period 2022-2032F
- Australia Jam Jelly and Preserve Market Trend Evolution
- Australia Jam Jelly and Preserve Market Drivers and Challenges
- Australia Jam Jelly and Preserve Price Trends
- Australia Jam Jelly and Preserve Porter's Five Forces
- Australia Jam Jelly and Preserve Industry Life Cycle
- Historical Data and Forecast of Australia Jam Jelly and Preserve Market Revenues & Volume By Product Type for the Period 2022-2032F
- Historical Data and Forecast of Australia Jam Jelly and Preserve Market Revenues & Volume By Jam for the Period 2022-2032F
- Historical Data and Forecast of Australia Jam Jelly and Preserve Market Revenues & Volume By Jelly for the Period 2022-2032F
- Historical Data and Forecast of Australia Jam Jelly and Preserve Market Revenues & Volume By Preserves for the Period 2022-2032F
- Historical Data and Forecast of Australia Jam Jelly and Preserve Market Revenues & Volume By Ingredient Type for the Period 2022-2032F
- Historical Data and Forecast of Australia Jam Jelly and Preserve Market Revenues & Volume By Fruit-Based for the Period 2022-2032F
- Historical Data and Forecast of Australia Jam Jelly and Preserve Market Revenues & Volume By Sugar-Free for the Period 2022-2032F
- Historical Data and Forecast of Australia Jam Jelly and Preserve Market Revenues & Volume By Organic for the Period 2022-2032F
- Historical Data and Forecast of Australia Jam Jelly and Preserve Market Revenues & Volume By Distribution Channel for the Period 2022-2032F
- Historical Data and Forecast of Australia Jam Jelly and Preserve Market Revenues & Volume By Supermarkets for the Period 2022-2032F
- Historical Data and Forecast of Australia Jam Jelly and Preserve Market Revenues & Volume By Online Stores for the Period 2022-2032F
- Historical Data and Forecast of Australia Jam Jelly and Preserve Market Revenues & Volume By Specialty Stores for the Period 2022-2032F
- Historical Data and Forecast of Australia Jam Jelly and Preserve Market Revenues & Volume By Packaging Type for the Period 2022-2032F
- Historical Data and Forecast of Australia Jam Jelly and Preserve Market Revenues & Volume By Glass Jar for the Period 2022-2032F
- Historical Data and Forecast of Australia Jam Jelly and Preserve Market Revenues & Volume By Plastic Container for the Period 2022-2032F
- Historical Data and Forecast of Australia Jam Jelly and Preserve Market Revenues & Volume By Squeeze Bottle for the Period 2022-2032F
- Australia Jam Jelly and Preserve Import Export Trade Statistics
- Market Opportunity Assessment By Product Type
- Market Opportunity Assessment By Ingredient Type
- Market Opportunity Assessment By Distribution Channel
- Market Opportunity Assessment By Packaging Type
- Australia Jam Jelly and Preserve Top Companies Market Share
- Australia Jam Jelly and Preserve Competitive Benchmarking By Technical and Operational Parameters
- Australia Jam Jelly and Preserve Company Profiles
- Australia Jam Jelly and Preserve Key Strategic Recommendations
Frequently Asked Questions About the Market Study (FAQs):
6Wresearch actively monitors the Australia Jam Jelly and Preserve Market and publishes its comprehensive annual report, highlighting emerging trends, growth drivers, revenue analysis, and forecast outlook. Our insights help businesses to make data-backed strategic decisions with ongoing market dynamics. Our analysts track relevent industries related to the Australia Jam Jelly and Preserve Market, allowing our clients with actionable intelligence and reliable forecasts tailored to emerging regional needs.
Yes, we provide customisation as per your requirements. To learn more, feel free to contact us on sales@6wresearch.com
1 Executive Summary |
2 Introduction |
2.1 Key Highlights of the Report |
2.2 Report Description |
2.3 Market Scope & Segmentation |
2.4 Research Methodology |
2.5 Assumptions |
3 Australia Jam Jelly and Preserve Market Overview |
3.1 Australia Country Macro Economic Indicators |
3.2 Australia Jam Jelly and Preserve Market Revenues & Volume, 2022 & 2032F |
3.3 Australia Jam Jelly and Preserve Market - Industry Life Cycle |
3.4 Australia Jam Jelly and Preserve Market - Porter's Five Forces |
3.5 Australia Jam Jelly and Preserve Market Revenues & Volume Share, By Product Type, 2022 & 2032F |
3.6 Australia Jam Jelly and Preserve Market Revenues & Volume Share, By Ingredient Type, 2022 & 2032F |
3.7 Australia Jam Jelly and Preserve Market Revenues & Volume Share, By Distribution Channel, 2022 & 2032F |
3.8 Australia Jam Jelly and Preserve Market Revenues & Volume Share, By Packaging Type, 2022 & 2032F |
4 Australia Jam Jelly and Preserve Market Dynamics |
4.1 Impact Analysis |
4.2 Market Drivers |
4.2.1 Increasing health consciousness among consumers leading to a preference for natural and organic ingredients in jams, jellies, and preserves. |
4.2.2 Growing demand for premium and gourmet products in the food industry, driving innovation and new product development in the jam, jelly, and preserve market. |
4.2.3 Rising popularity of homemade and artisanal food products, creating opportunities for small-scale producers in the Australian market. |
4.3 Market Restraints |
4.3.1 Fluctuating prices of key ingredients such as fruits and sugar, impacting production costs and potentially leading to price volatility in the market. |
4.3.2 Intense competition from substitute products like spreads and nut butters, challenging the market share of traditional jam, jelly, and preserve products. |
4.3.3 Stringent regulations and standards for food labeling, packaging, and quality control, increasing compliance costs for manufacturers in the market. |
5 Australia Jam Jelly and Preserve Market Trends |
6 Australia Jam Jelly and Preserve Market, By Types |
6.1 Australia Jam Jelly and Preserve Market, By Product Type |
6.1.1 Overview and Analysis |
6.1.2 Australia Jam Jelly and Preserve Market Revenues & Volume, By Product Type, 2022 - 2032F |
6.1.3 Australia Jam Jelly and Preserve Market Revenues & Volume, By Jam, 2022 - 2032F |
6.1.4 Australia Jam Jelly and Preserve Market Revenues & Volume, By Jelly, 2022 - 2032F |
6.1.5 Australia Jam Jelly and Preserve Market Revenues & Volume, By Preserves, 2022 - 2032F |
6.2 Australia Jam Jelly and Preserve Market, By Ingredient Type |
6.2.1 Overview and Analysis |
6.2.2 Australia Jam Jelly and Preserve Market Revenues & Volume, By Fruit-Based, 2022 - 2032F |
6.2.3 Australia Jam Jelly and Preserve Market Revenues & Volume, By Sugar-Free, 2022 - 2032F |
6.2.4 Australia Jam Jelly and Preserve Market Revenues & Volume, By Organic, 2022 - 2032F |
6.3 Australia Jam Jelly and Preserve Market, By Distribution Channel |
6.3.1 Overview and Analysis |
6.3.2 Australia Jam Jelly and Preserve Market Revenues & Volume, By Supermarkets, 2022 - 2032F |
6.3.3 Australia Jam Jelly and Preserve Market Revenues & Volume, By Online Stores, 2022 - 2032F |
6.3.4 Australia Jam Jelly and Preserve Market Revenues & Volume, By Specialty Stores, 2022 - 2032F |
6.4 Australia Jam Jelly and Preserve Market, By Packaging Type |
6.4.1 Overview and Analysis |
6.4.2 Australia Jam Jelly and Preserve Market Revenues & Volume, By Glass Jar, 2022 - 2032F |
6.4.3 Australia Jam Jelly and Preserve Market Revenues & Volume, By Plastic Container, 2022 - 2032F |
6.4.4 Australia Jam Jelly and Preserve Market Revenues & Volume, By Squeeze Bottle, 2022 - 2032F |
7 Australia Jam Jelly and Preserve Market Import-Export Trade Statistics |
7.1 Australia Jam Jelly and Preserve Market Export to Major Countries |
7.2 Australia Jam Jelly and Preserve Market Imports from Major Countries |
8 Australia Jam Jelly and Preserve Market Key Performance Indicators |
8.1 Consumer engagement metrics such as social media interactions, website visits, and online reviews indicating the level of interest and engagement with jam, jelly, and preserve products. |
8.2 Number of new product launches and product innovations in the market, reflecting the pace of product development and market competitiveness. |
8.3 Customer retention rate and loyalty metrics, measuring the ability of brands to retain and attract repeat customers through product quality and marketing strategies. |
9 Australia Jam Jelly and Preserve Market - Opportunity Assessment |
9.1 Australia Jam Jelly and Preserve Market Opportunity Assessment, By Product Type, 2022 & 2032F |
9.2 Australia Jam Jelly and Preserve Market Opportunity Assessment, By Ingredient Type, 2022 & 2032F |
9.3 Australia Jam Jelly and Preserve Market Opportunity Assessment, By Distribution Channel, 2022 & 2032F |
9.4 Australia Jam Jelly and Preserve Market Opportunity Assessment, By Packaging Type, 2022 & 2032F |
10 Australia Jam Jelly and Preserve Market - Competitive Landscape |
10.1 Australia Jam Jelly and Preserve Market Revenue Share, By Companies, 2025 |
10.2 Australia Jam Jelly and Preserve Market Competitive Benchmarking, By Operating and Technical Parameters |
11 Company Profiles |
12 Recommendations |
13 Disclaimer |
Export potential assessment - trade Analytics for 2030
Export potential enables firms to identify high-growth global markets with greater confidence by combining advanced trade intelligence with a structured quantitative methodology. The framework analyzes emerging demand trends and country-level import patterns while integrating macroeconomic and trade datasets such as GDP and population forecasts, bilateral import–export flows, tariff structures, elasticity differentials between developed and developing economies, geographic distance, and import demand projections. Using weighted trade values from 2020–2024 as the base period to project country-to-country export potential for 2030, these inputs are operationalized through calculated drivers such as gravity model parameters, tariff impact factors, and projected GDP per-capita growth. Through an analysis of hidden potentials, demand hotspots, and market conditions that are most favorable to success, this method enables firms to focus on target countries, maximize returns, and global expansion with data, backed by accuracy.
By factoring in the projected importer demand gap that is currently unmet and could be potential opportunity, it identifies the potential for the Exporter (Country) among 190 countries, against the general trade analysis, which identifies the biggest importer or exporter.
To discover high-growth global markets and optimize your business strategy:
Click Here
Pricing
- Single User License$ 1,995
- Department License$ 2,400
- Site License$ 3,120
- Global License$ 3,795

Thought Leadership
Search
Thought Leadership and Analyst Meet


Our Clients
Latest Reports
- New Zealand Aseptic Manufacturing Market (2026-2032)
- Netherlands Aseptic Manufacturing Market (2026-2032)
- Nauru Aseptic Manufacturing Market (2026-2032)
- Namibia Aseptic Manufacturing Market (2026-2032)
- Mozambique Aseptic Manufacturing Market (2026-2032)
- Montenegro Aseptic Manufacturing Market (2026-2032)
- Mongolia Aseptic Manufacturing Market (2026-2032)
- Monaco Aseptic Manufacturing Market (2026-2032)
- Micronesia Aseptic Manufacturing Market (2026-2032)
- Mauritius Aseptic Manufacturing Market (2026-2032)
Industry Events and Analyst Meet

HIMTEX 2026

India Refining Summit 2026

India EV Show 2026

EV tech India Expo 2026

Auto Tech Asia 2026
Whitepaper
- Middle East & Africa Commercial Security Market Click here to view more.
- Middle East & Africa Fire Safety Systems & Equipment Market Click here to view more.
- GCC Drone Market Click here to view more.
- Middle East Lighting Fixture Market Click here to view more.
- GCC Physical & Perimeter Security Market Click here to view more.
6WResearch In News
- Doha a strategic location for EV manufacturing hub: IPA Qatar
- Demand for luxury TVs surging in the GCC, says Samsung
- Empowering Growth: The Thriving Journey of Bangladesh’s Cable Industry
- Demand for luxury TVs surging in the GCC, says Samsung
- Video call with a traditional healer? Once unthinkable, it’s now common in South Africa
- Intelligent Buildings To Smooth GCC’s Path To Net Zero