Australia Metal Closures Market (2026-2032) | Companies, Forecast, Trends, Industry, Analysis, Segmentation, Growth, Size & Revenue, Value, Share, Outlook, Competitive Landscape
Market Forecast By End-user (Food, Beverage, Pharmaceuticals, Other) And Competitive Landscape
| Product Code: ETC6184950 | Publication Date: Sep 2024 | Updated Date: Mar 2026 | Product Type: Market Research Report | |
| Publisher: 6Wresearch | Author: Sumit Sagar | No. of Pages: 75 | No. of Figures: 35 | No. of Tables: 20 |
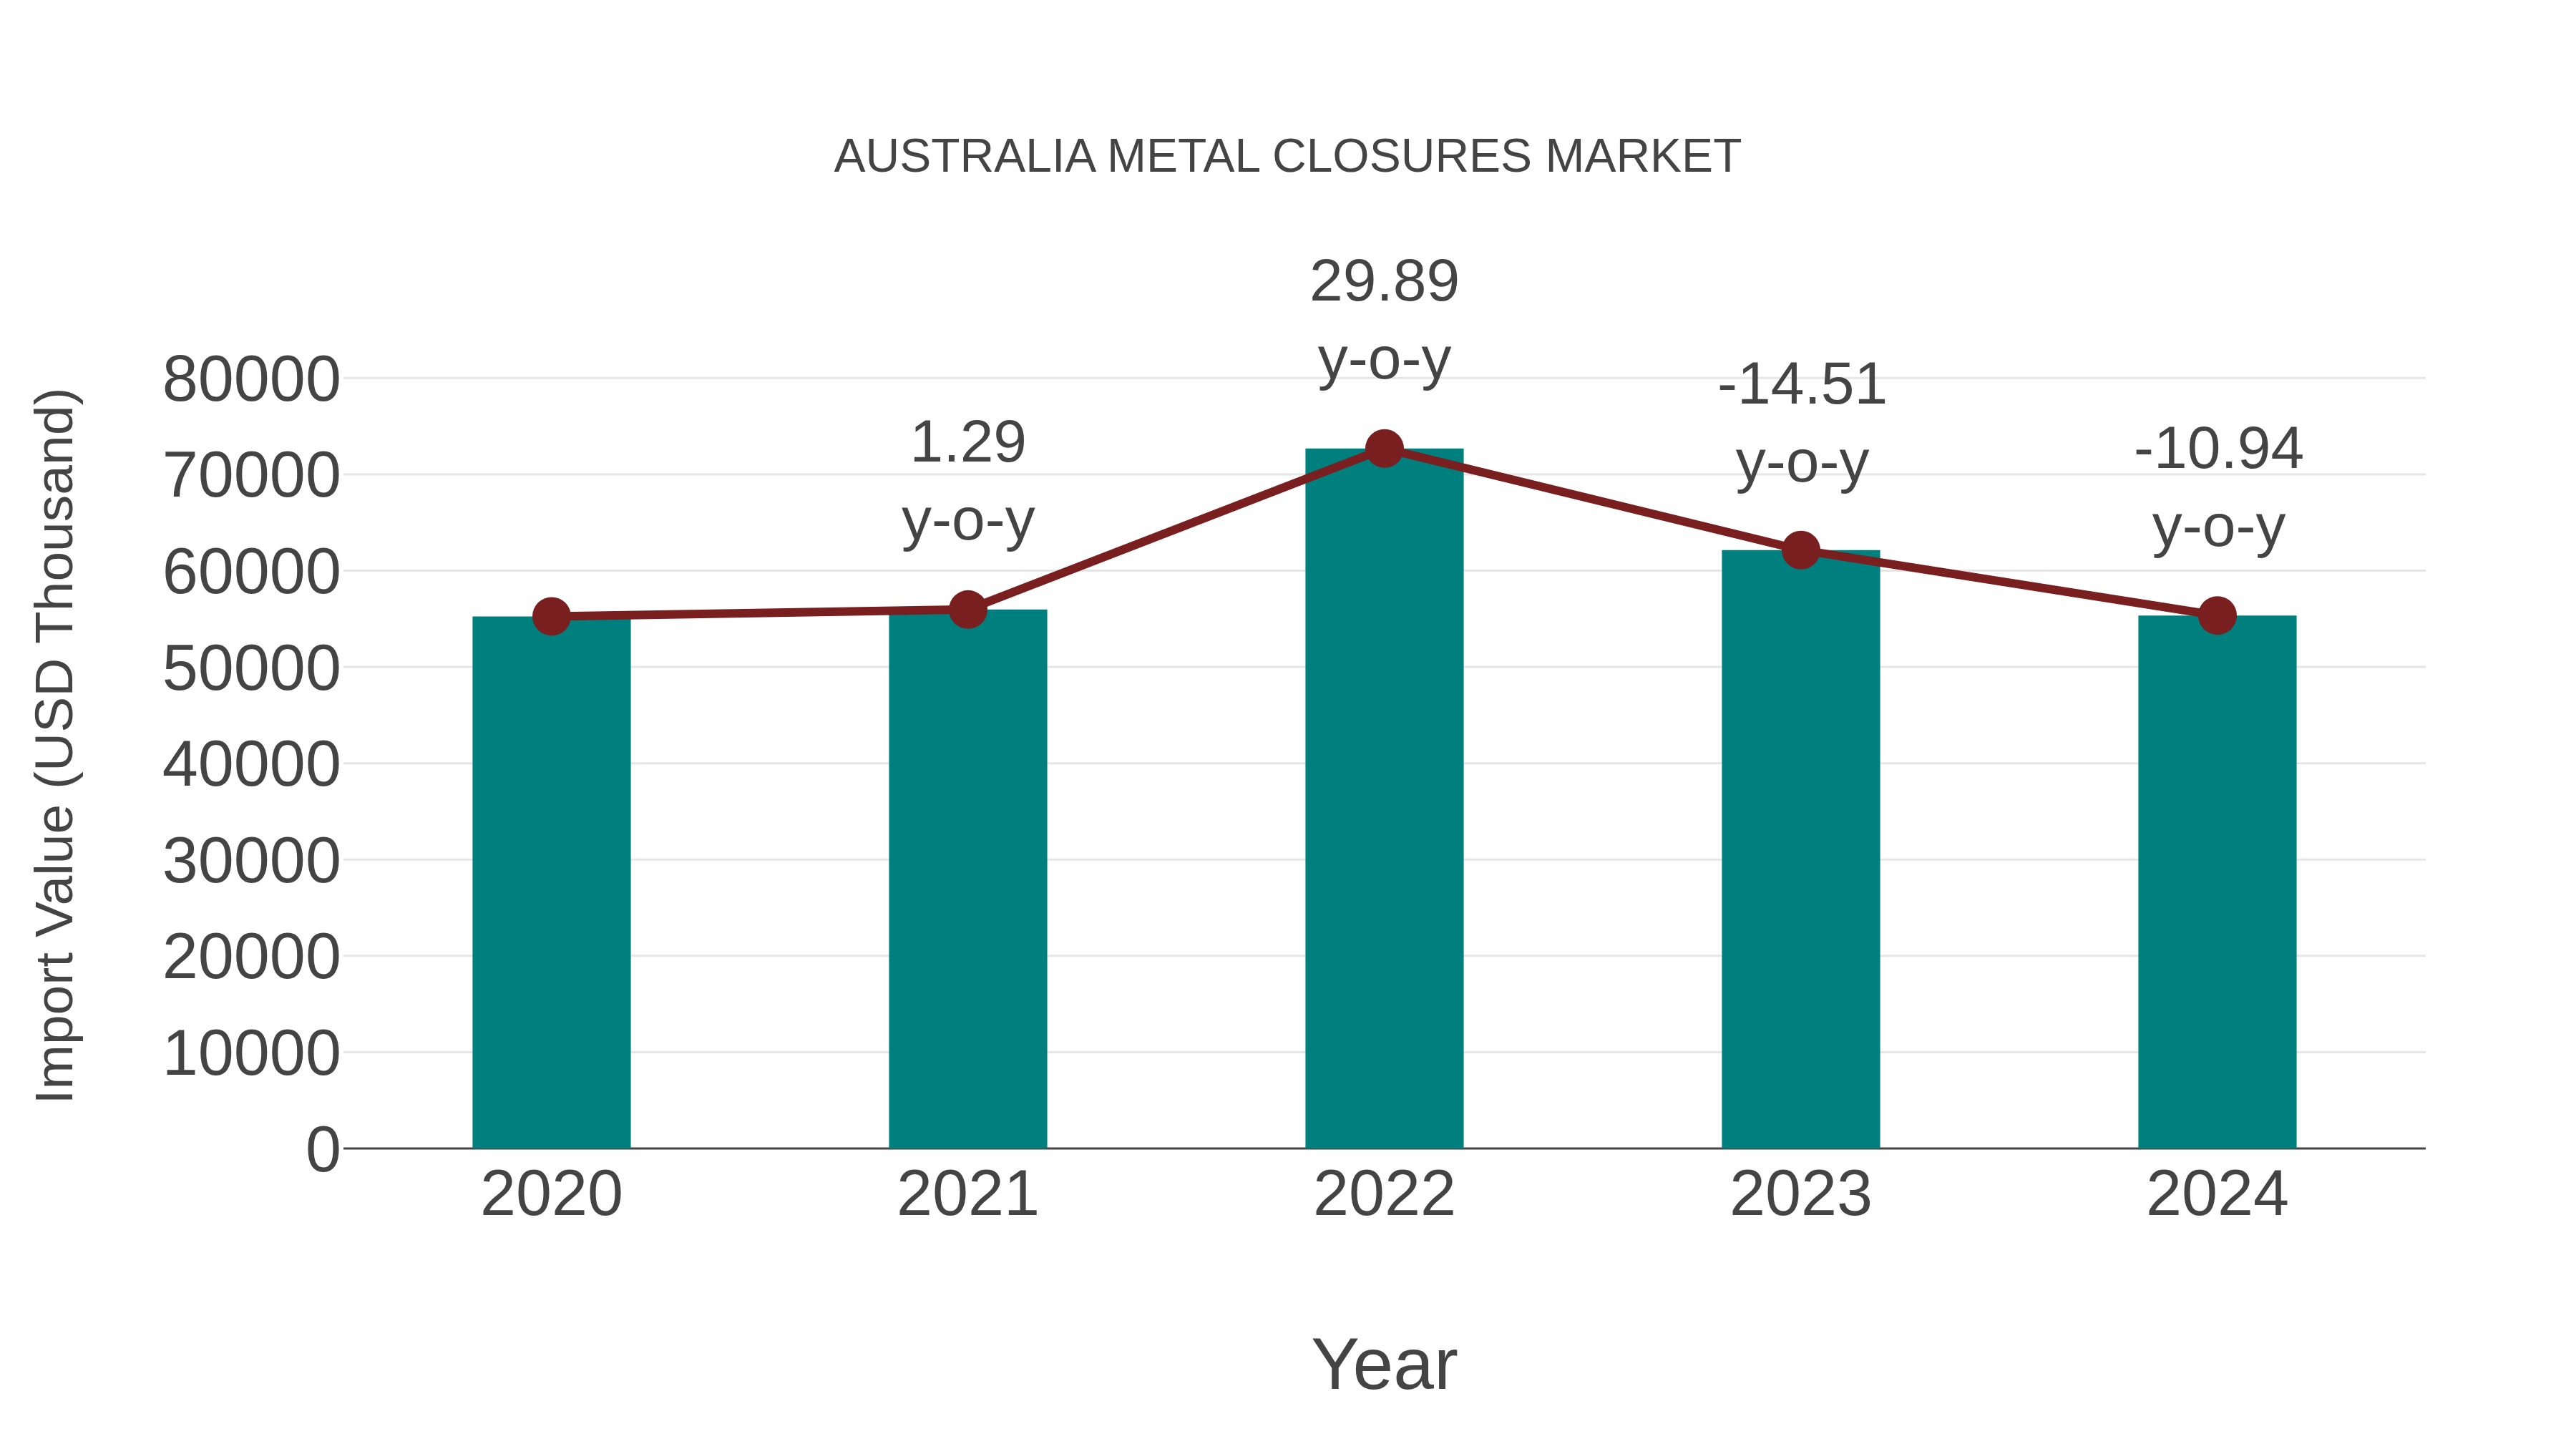
Australia Metal Closures Market: Import Trend Analysis
In the Australia metal closures market, the import trend experienced a decline with a growth rate of -10.94% from 2023 to 2024. The compound annual growth rate (CAGR) for imports over the period 2020-2024 was 0.04%. This decline could be attributed to shifts in demand dynamics or changes in trade policies impacting market stability.
Australia Metal Closures Market Overview
Australias metal closures market is witnessing steady growth due to their wide usage in food and beverage packaging. Metal closures, including lug caps, screw caps, and crown caps, provide superior sealing performance and product protection. The shift towards metal packaging for product safety and sustainability, along with government initiatives encouraging recycling, supports this market`s expansion. Local players are also focusing on decorative and embossed closures to appeal to brand-conscious consumers.
Trends of the market
Australia`s metal closures market is driven by packaging innovation and the growing preference for airtight and corrosion-resistant materials. The market is seeing a resurgence with the rise of craft breweries and gourmet food segments that prefer metal over plastic closures. Regulatory pressure to minimize plastic waste is also encouraging a return to traditional metal packaging components.
Challenges of the market
The metal closures market in Australia is under pressure from the growing demand for resealable and convenient packaging options that are often made using polymer-based materials. This shift, coupled with stringent regulations regarding food safety and packaging waste, is making it difficult for manufacturers to maintain profitability. Additionally, the sector is affected by the rising costs of logistics and energy, which inflate the overall cost of production.
Investment opportunities in the Market
The increasing consumer preference for environmentally friendly and premium packaging opens avenues for companies producing innovative metal closures. Startups offering smart closure solutionslike QR-coded caps or resealable designscould attract attention. Investments in localized manufacturing hubs and export-driven production can also benefit from Australia`s proximity to Southeast Asian markets.
Government Policy of the market
The Australian government enforces policies related to waste management, recycling, and environmental sustainability that impact the metal closures market. Programs like the Australasian Recycling Label and the National Packaging Targets drive companies to focus on producing closures that are easier to recycle and made from more sustainable materials. Additionally, the government has introduced extended producer responsibility (EPR) schemes, pushing manufacturers to take responsibility for the full lifecycle of their products. While these policies encourage the development of more sustainable packaging, they also impose compliance costs and can influence the market dynamics.
Key Highlights of the Report:
- Australia Metal Closures Market Outlook
- Market Size of Australia Metal Closures Market, 2025
- Forecast of Australia Metal Closures Market, 2032
- Historical Data and Forecast of Australia Metal Closures Revenues & Volume for the Period 2022 - 2032F
- Australia Metal Closures Market Trend Evolution
- Australia Metal Closures Market Drivers and Challenges
- Australia Metal Closures Price Trends
- Australia Metal Closures Porter's Five Forces
- Australia Metal Closures Industry Life Cycle
- Historical Data and Forecast of Australia Metal Closures Market Revenues & Volume By End-user for the Period 2022 - 2032F
- Historical Data and Forecast of Australia Metal Closures Market Revenues & Volume By Food for the Period 2022 - 2032F
- Historical Data and Forecast of Australia Metal Closures Market Revenues & Volume By Beverage for the Period 2022 - 2032F
- Historical Data and Forecast of Australia Metal Closures Market Revenues & Volume By Pharmaceuticals for the Period 2022 - 2032F
- Historical Data and Forecast of Australia Metal Closures Market Revenues & Volume By Other for the Period 2022 - 2032F
- Australia Metal Closures Import Export Trade Statistics
- Market Opportunity Assessment By End-user
- Australia Metal Closures Top Companies Market Share
- Australia Metal Closures Competitive Benchmarking By Technical and Operational Parameters
- Australia Metal Closures Company Profiles
- Australia Metal Closures Key Strategic Recommendations
Australia Metal Closures Market (2026-2032): FAQs
6Wresearch actively monitors the Australia Metal Closures Market and publishes its comprehensive annual report, highlighting emerging trends, growth drivers, revenue analysis, and forecast outlook. Our insights help businesses to make data-backed strategic decisions with ongoing market dynamics. Our analysts track relevent industries related to the Australia Metal Closures Market, allowing our clients with actionable intelligence and reliable forecasts tailored to emerging regional needs.
Yes, we provide customisation as per your requirements. To learn more, feel free to contact us on sales@6wresearch.com
1 Executive Summary |
2 Introduction |
2.1 Key Highlights of the Report |
2.2 Report Description |
2.3 Market Scope & Segmentation |
2.4 Research Methodology |
2.5 Assumptions |
3 Australia Metal Closures Market Overview |
3.1 Australia Country Macro Economic Indicators |
3.2 Australia Metal Closures Market Revenues & Volume, 2022 & 2032F |
3.3 Australia Metal Closures Market - Industry Life Cycle |
3.4 Australia Metal Closures Market - Porter's Five Forces |
3.5 Australia Metal Closures Market Revenues & Volume Share, By End-user, 2022 & 2032F |
4 Australia Metal Closures Market Dynamics |
4.1 Impact Analysis |
4.2 Market Drivers |
4.2.1 Increasing demand for convenient packaging solutions in the food and beverage industry |
4.2.2 Growing preference for sustainable and recyclable packaging materials |
4.2.3 Technological advancements leading to improved metal closure designs and functionalities |
4.3 Market Restraints |
4.3.1 Fluctuating raw material prices impacting manufacturing costs |
4.3.2 Intense competition from alternative packaging solutions such as plastic closures |
4.3.3 Stringent regulations and standards regarding packaging materials and recycling practices |
5 Australia Metal Closures Market Trends |
6 Australia Metal Closures Market, By Types |
6.1 Australia Metal Closures Market, By End-user |
6.1.1 Overview and Analysis |
6.1.2 Australia Metal Closures Market Revenues & Volume, By End-user, 2022 - 2032F |
6.1.3 Australia Metal Closures Market Revenues & Volume, By Food, 2022 - 2032F |
6.1.4 Australia Metal Closures Market Revenues & Volume, By Beverage, 2022 - 2032F |
6.1.5 Australia Metal Closures Market Revenues & Volume, By Pharmaceuticals, 2022 - 2032F |
6.1.6 Australia Metal Closures Market Revenues & Volume, By Other, 2022 - 2032F |
7 Australia Metal Closures Market Import-Export Trade Statistics |
7.1 Australia Metal Closures Market Export to Major Countries |
7.2 Australia Metal Closures Market Imports from Major Countries |
8 Australia Metal Closures Market Key Performance Indicators |
8.1 Adoption rate of metal closures in new product launches within the food and beverage sector |
8.2 Rate of innovation in metal closure designs and functionalities |
8.3 Percentage of metal closures that meet sustainability and recyclability standards |
8.4 Customer satisfaction levels with metal closures in terms of ease of use and product freshness maintenance. |
9 Australia Metal Closures Market - Opportunity Assessment |
9.1 Australia Metal Closures Market Opportunity Assessment, By End-user, 2022 & 2032F |
10 Australia Metal Closures Market - Competitive Landscape |
10.1 Australia Metal Closures Market Revenue Share, By Companies, 2025 |
10.2 Australia Metal Closures Market Competitive Benchmarking, By Operating and Technical Parameters |
11 Company Profiles |
12 Recommendations |
13 Disclaimer |
Export potential assessment - trade Analytics for 2030
Export potential enables firms to identify high-growth global markets with greater confidence by combining advanced trade intelligence with a structured quantitative methodology. The framework analyzes emerging demand trends and country-level import patterns while integrating macroeconomic and trade datasets such as GDP and population forecasts, bilateral import–export flows, tariff structures, elasticity differentials between developed and developing economies, geographic distance, and import demand projections. Using weighted trade values from 2020–2024 as the base period to project country-to-country export potential for 2030, these inputs are operationalized through calculated drivers such as gravity model parameters, tariff impact factors, and projected GDP per-capita growth. Through an analysis of hidden potentials, demand hotspots, and market conditions that are most favorable to success, this method enables firms to focus on target countries, maximize returns, and global expansion with data, backed by accuracy.
By factoring in the projected importer demand gap that is currently unmet and could be potential opportunity, it identifies the potential for the Exporter (Country) among 190 countries, against the general trade analysis, which identifies the biggest importer or exporter.
To discover high-growth global markets and optimize your business strategy:
Click Here
Pricing
- Single User License$ 1,995
- Department License$ 2,400
- Site License$ 3,120
- Global License$ 3,795

Search
Thought Leadership and Analyst Meet


Our Clients
Latest Reports
- Canada Cloud CFD Market (2026-2032) | Size & Revenue, Industry, Growth, Competitive Landscape, Forecast, Segmentation, Value, Outlook, Trends, Share, Analysis, Companies
- Taiwan Food Delivery Platform Market (2026-2032) | Companies, Outlook, Analysis, Trends, Value, Revenue, Segmentation, Share, Forecast, Competitive Landscape, Growth, Size & Forecast
- United Kingdom (UK) Long-term Care Insurance Market (2026-2032) | Growth, Share, Consumer Insights, Drivers, Opportunities, Competition, Pricing Analysis, Segments, Restraints, Companies, Competitive, Value, Outlook, Size, Demand, Analysis, Challenges, Strategic Insights, Investment Trends, Revenue, Trends, Supply, Forecast
- United Kingdom (UK) Long Term Care Market (2026-2032) | Companies, Outlook, Analysis, Trends, Value, Revenue, Segmentation, Share, Forecast, Competitive Landscape, Growth, Size & Forecast
- Iraq Insulation and Waterproofing Market (2026-2032) | Outlook, Drivers, Growth, Size, Share, Industry, Revenue, Trends, Demand, Competitive, Strategic Insights, Opportunities, Segments, Companies, Challenges, Strategy, Consumer Insights, Analysis, Investment Trends, Value, Segmentation, Forecast, Restraints
- India Switchgear Market Outlook (2026-2032) | Size, Share, Trends, Growth, Revenue, Forecast, Analysis, Value, Outlook
- Pakistan Contraceptive Implants Market (2025-2031) | Demand, Growth, Size, Share, Industry, Pricing Analysis, Competitive, Strategic Insights, Strategy, Consumer Insights, Analysis, Investment Trends, Opportunities, Revenue, Segments, Value, Segmentation, Supply, Forecast, Restraints, Outlook, Competition, Drivers, Trends, Companies, Challenges
- Sri Lanka Packaging Market (2026-2032) | Outlook, Competition, Drivers, Trends, Demand, Pricing Analysis, Competitive, Strategic Insights, Companies, Challenges, Strategy, Consumer Insights, Analysis, Investment Trends, Opportunities, Growth, Size, Share, Industry, Revenue, Segments, Value, Segmentation, Supply, Forecast, Restraints
- India Kids Watches Market (2026-2032) | Strategy, Consumer Insights, Analysis, Investment Trends, Opportunities, Growth, Size, Share, Industry, Revenue, Segments, Value, Segmentation, Supply, Forecast, Restraints, Outlook, Competition, Drivers, Trends, Demand, Pricing Analysis, Competitive, Strategic Insights, Companies, Challenges
- Saudi Arabia Core Assurance Service Market (2025-2031) | Strategy, Consumer Insights, Analysis, Investment Trends, Opportunities, Growth, Size, Share, Industry, Revenue, Segments, Value, Segmentation, Supply, Forecast, Restraints, Outlook, Competition, Drivers, Trends, Demand, Pricing Analysis, Competitive, Strategic Insights, Companies, Challenges
Industry Events and Analyst Meet

India EV Show 2026

EV tech India Expo 2026

Auto Tech Asia 2026

Battery Tech India 2026

Smart Production Solutions Guangzhou 2026
Whitepaper
- Middle East & Africa Commercial Security Market Click here to view more.
- Middle East & Africa Fire Safety Systems & Equipment Market Click here to view more.
- GCC Drone Market Click here to view more.
- Middle East Lighting Fixture Market Click here to view more.
- GCC Physical & Perimeter Security Market Click here to view more.
6WResearch In News
- Doha a strategic location for EV manufacturing hub: IPA Qatar
- Demand for luxury TVs surging in the GCC, says Samsung
- Empowering Growth: The Thriving Journey of Bangladesh’s Cable Industry
- Demand for luxury TVs surging in the GCC, says Samsung
- Video call with a traditional healer? Once unthinkable, it’s now common in South Africa
- Intelligent Buildings To Smooth GCC’s Path To Net Zero