Australia Metal Metallic Salts Market (2026-2032) | Outlook, Size & Revenue, Growth, Forecast, Industry, Companies, Analysis, Share, Competitive Landscape, Trends, Segmentation, Value
Market Forecast By Application (Phototransistors, Photo Voltaic Cells, Transparent Electrodes, Liquid Crystal Displays, IR Detectors, Anti-Reflection Coatings, Fireworks, Others), By End User (Mining Industry, Electroplating Industry, Others) And Competitive Landscape
| Product Code: ETC6184969 | Publication Date: Sep 2024 | Updated Date: Mar 2026 | Product Type: Market Research Report | |
| Publisher: 6Wresearch | Author: Sachin Kumar Rai | No. of Pages: 75 | No. of Figures: 35 | No. of Tables: 20 |
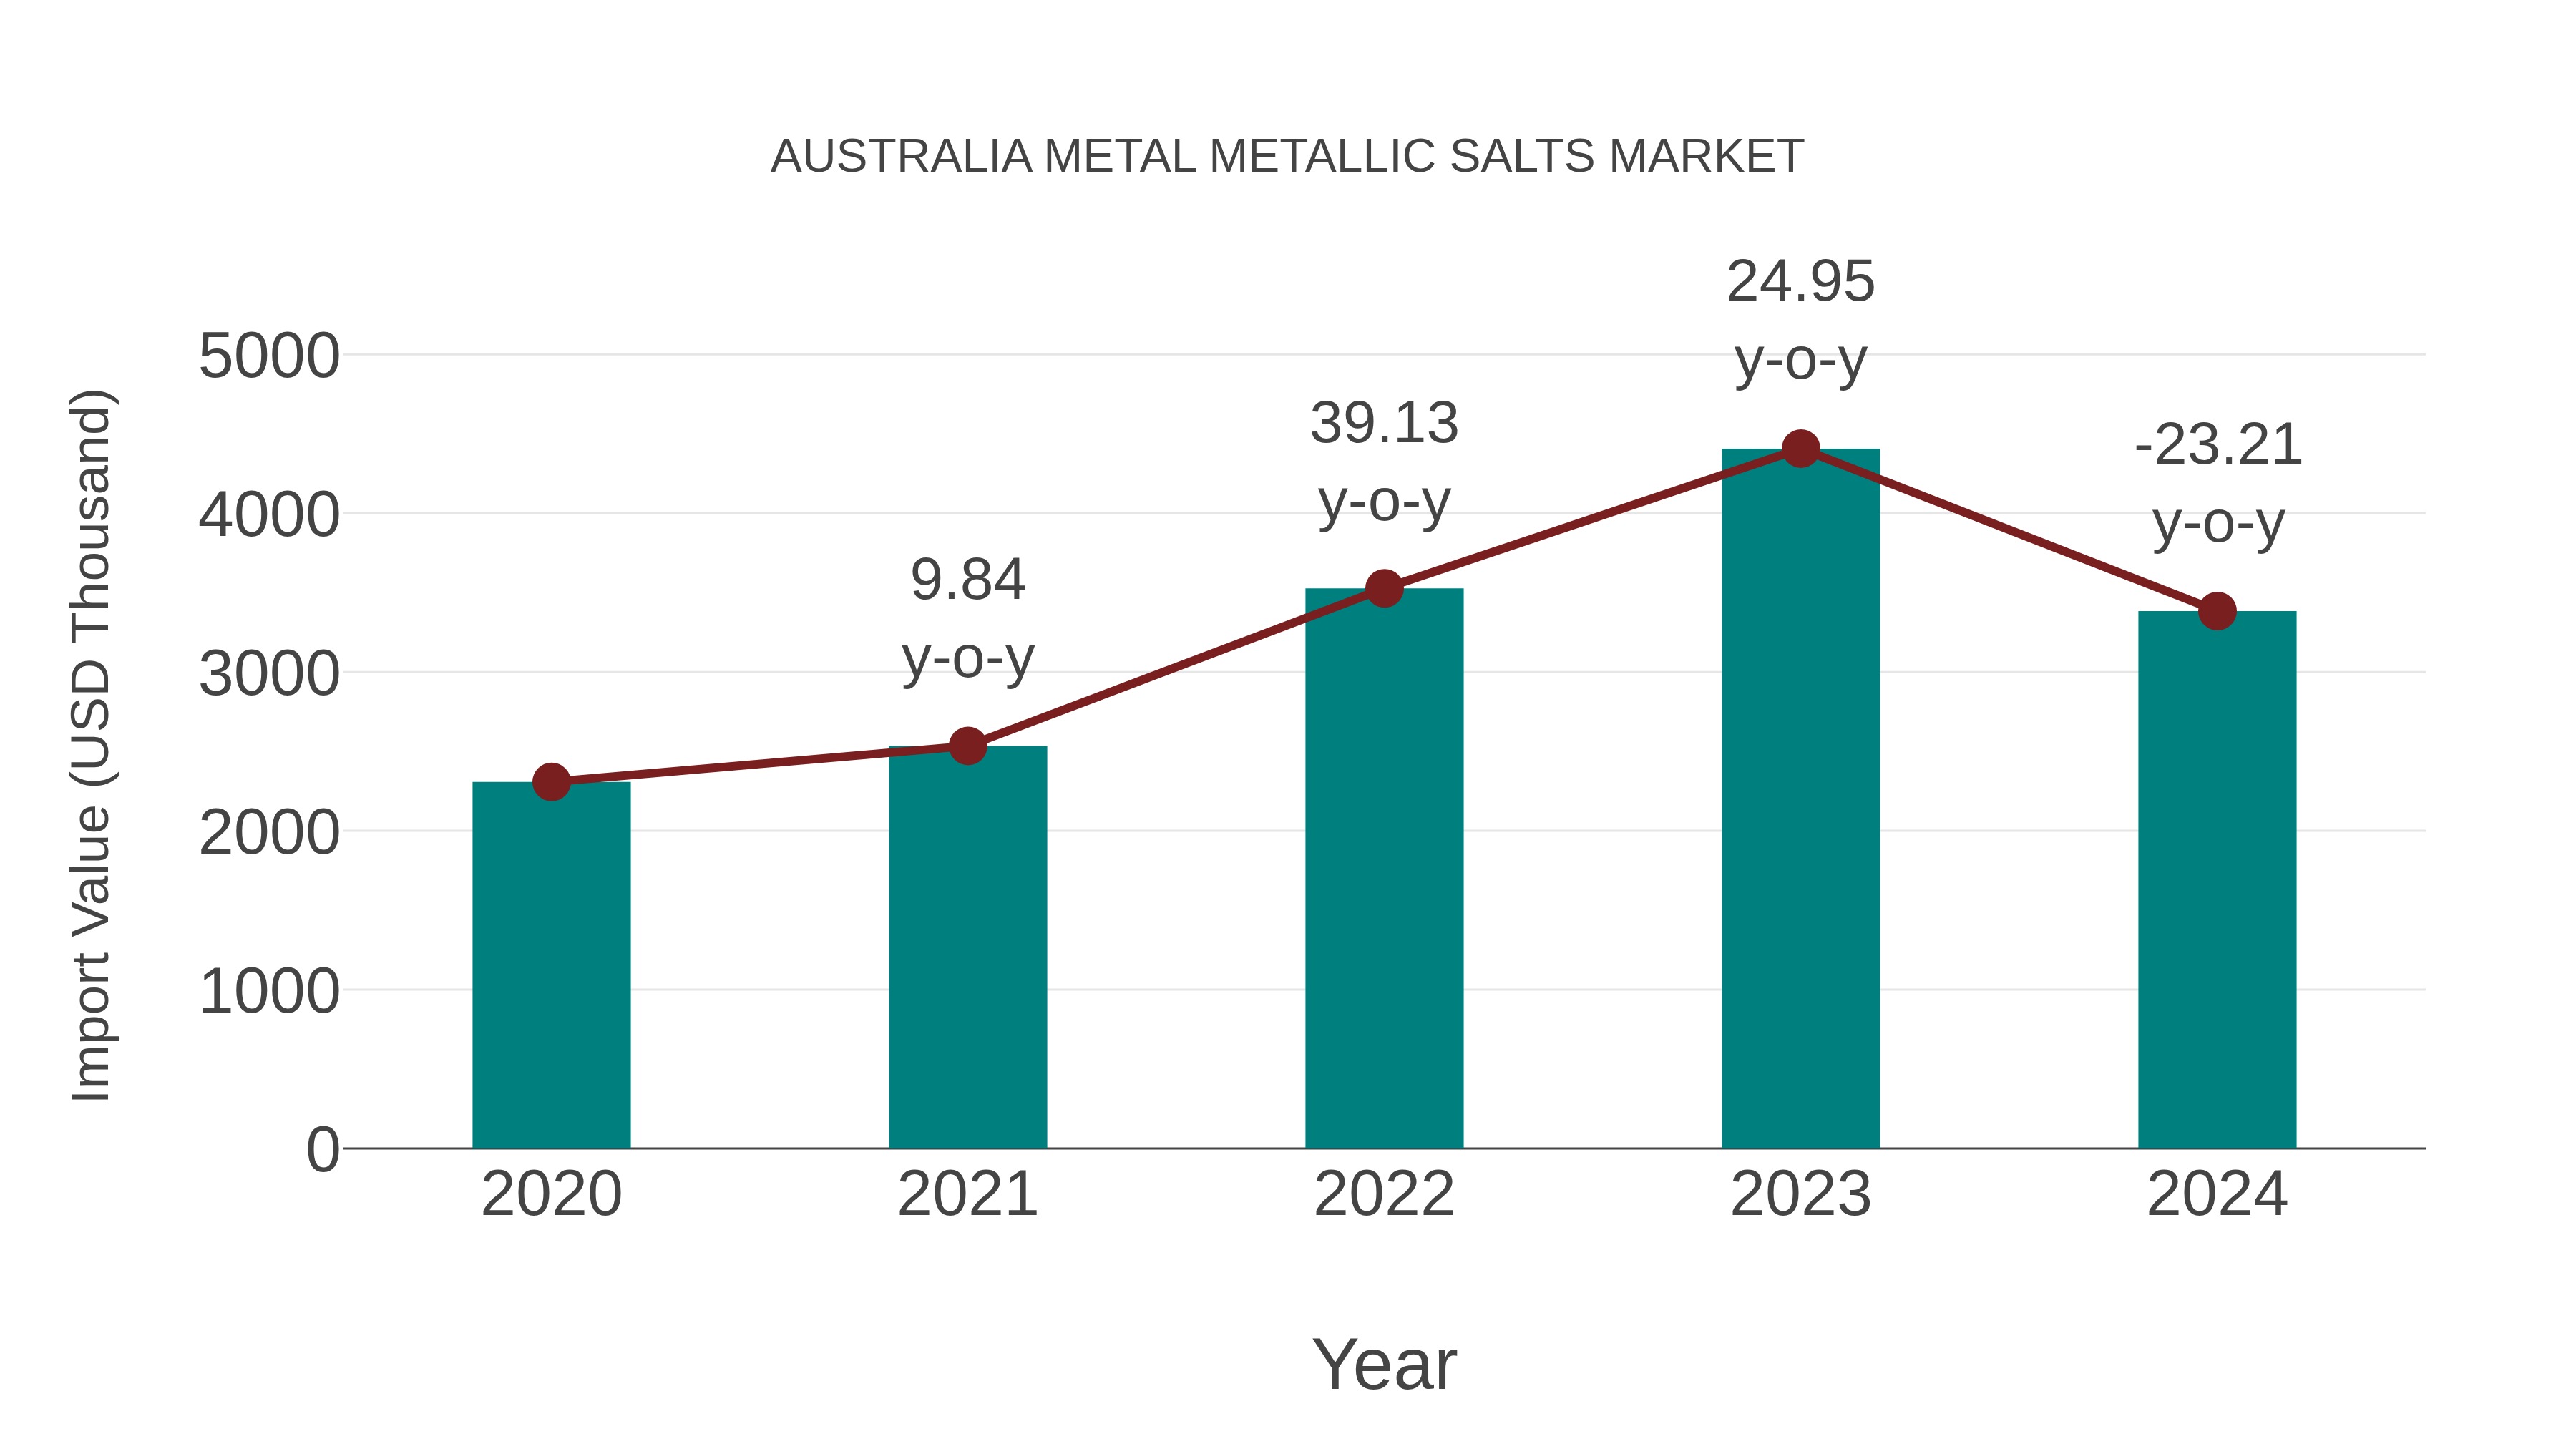
Australia Metal Metallic Salts Market: Import Trend Analysis
In the Australia metal metallic salts market, the import trend experienced a decline from 2023 to 2024, with a growth rate of -23.21%. However, the compound annual growth rate (CAGR) for the period 2020-2024 stood at 10.04%. This decline in import momentum could be attributed to shifts in demand dynamics or changes in trade policies impacting market stability.
Australia Metal Metallic Salts Market Overview
The market for metallic salts in Australia includes compounds used in catalysts, pigments, electroplating, and water treatment processes. Growth is supported by industrial expansion and demand for specialty chemicals. Metallic salts such as zinc sulfate, copper sulfate, and iron salts play a crucial role in both manufacturing and agricultural applications, with a growing focus on sustainable production methods.
Trends of the market
The market for metallic salts in Australia is influenced by their broad applications in agriculture, chemical synthesis, and metallurgy. There is increasing demand for high-purity salts used in catalyst production and battery materials. The agricultural sector is also driving growth, especially with the use of metallic micronutrient salts like zinc and copper in fertilizers to improve crop yields.
Challenges of the market
The metal metallic salts market in Australia contends with stringent environmental and safety regulations concerning the handling and disposal of chemical byproducts. This increases operational costs and regulatory compliance burdens. Moreover, the market is sensitive to fluctuations in the mining and chemical industries, which are major sources and consumers of these salts. Variability in quality and purity requirements across applications like agriculture, pharmaceuticals, and electroplating adds to production complexity. The dominance of international suppliers offering lower-cost alternatives also makes it difficult for local producers to remain competitive.
Investment opportunities in the Market
With demand increasing in agriculture, energy storage, and metallurgy, investing in high-purity metallic salts production facilities presents a viable opportunity. Domestic production of battery-grade salts (like cobalt and lithium derivatives) also aligns with Australias ambitions in the critical minerals and battery value chain. Export-oriented businesses targeting APAC agricultural markets can additionally attract private and institutional capital.
Government Policy of the market
The metal metallic salts market in Australia is impacted by government policies concerning chemical manufacturing and environmental protection. The Australian government regulates the production and disposal of chemicals through agencies like the National Industrial Chemicals Notification and Assessment Scheme (NICNAS) to ensure that the chemicals do not harm human health or the environment. Furthermore, the governments focus on sustainability and reducing industrial waste pushes manufacturers to innovate in the production of more environmentally-friendly metallic salts. Additionally, trade policies related to raw materials, such as metals and minerals, influence the availability and cost of metallic salts in the local market.
Key Highlights of the Report:
- Australia Metal Metallic Salts Market Outlook
- Market Size of Australia Metal Metallic Salts Market, 2025
- Forecast of Australia Metal Metallic Salts Market, 2032
- Historical Data and Forecast of Australia Metal Metallic Salts Revenues & Volume for the Period 2022 - 2032F
- Australia Metal Metallic Salts Market Trend Evolution
- Australia Metal Metallic Salts Market Drivers and Challenges
- Australia Metal Metallic Salts Price Trends
- Australia Metal Metallic Salts Porter's Five Forces
- Australia Metal Metallic Salts Industry Life Cycle
- Historical Data and Forecast of Australia Metal Metallic Salts Market Revenues & Volume By Application for the Period 2022 - 2032F
- Historical Data and Forecast of Australia Metal Metallic Salts Market Revenues & Volume By Phototransistors for the Period 2022 - 2032F
- Historical Data and Forecast of Australia Metal Metallic Salts Market Revenues & Volume By Photo Voltaic Cells for the Period 2022 - 2032F
- Historical Data and Forecast of Australia Metal Metallic Salts Market Revenues & Volume By Transparent Electrodes for the Period 2022 - 2032F
- Historical Data and Forecast of Australia Metal Metallic Salts Market Revenues & Volume By Liquid Crystal Displays for the Period 2022 - 2032F
- Historical Data and Forecast of Australia Metal Metallic Salts Market Revenues & Volume By IR Detectors for the Period 2022 - 2032F
- Historical Data and Forecast of Australia Metal Metallic Salts Market Revenues & Volume By Anti-Reflection Coatings for the Period 2022 - 2032F
- Historical Data and Forecast of Australia Metal Metallic Salts Market Revenues & Volume By Fireworks for the Period 2022 - 2032F
- Historical Data and Forecast of Australia Phototransistors Metal Metallic Salts Market Revenues & Volume By Others for the Period 2022 - 2032F
- Historical Data and Forecast of Australia Metal Metallic Salts Market Revenues & Volume By End User for the Period 2022 - 2032F
- Historical Data and Forecast of Australia Metal Metallic Salts Market Revenues & Volume By Mining Industry for the Period 2022 - 2032F
- Historical Data and Forecast of Australia Metal Metallic Salts Market Revenues & Volume By Electroplating Industry for the Period 2022 - 2032F
- Historical Data and Forecast of Australia Metal Metallic Salts Market Revenues & Volume By Others for the Period 2022 - 2032F
- Australia Metal Metallic Salts Import Export Trade Statistics
- Market Opportunity Assessment By Application
- Market Opportunity Assessment By End User
- Australia Metal Metallic Salts Top Companies Market Share
- Australia Metal Metallic Salts Competitive Benchmarking By Technical and Operational Parameters
- Australia Metal Metallic Salts Company Profiles
- Australia Metal Metallic Salts Key Strategic Recommendations
Australia Metal Metallic Salts Market (2026-2032): FAQs
6Wresearch actively monitors the Australia Metal Metallic Salts Market and publishes its comprehensive annual report, highlighting emerging trends, growth drivers, revenue analysis, and forecast outlook. Our insights help businesses to make data-backed strategic decisions with ongoing market dynamics. Our analysts track relevent industries related to the Australia Metal Metallic Salts Market, allowing our clients with actionable intelligence and reliable forecasts tailored to emerging regional needs.
Yes, we provide customisation as per your requirements. To learn more, feel free to contact us on sales@6wresearch.com
1 Executive Summary |
2 Introduction |
2.1 Key Highlights of the Report |
2.2 Report Description |
2.3 Market Scope & Segmentation |
2.4 Research Methodology |
2.5 Assumptions |
3 Australia Metal Metallic Salts Market Overview |
3.1 Australia Country Macro Economic Indicators |
3.2 Australia Metal Metallic Salts Market Revenues & Volume, 2022 & 2032F |
3.3 Australia Metal Metallic Salts Market - Industry Life Cycle |
3.4 Australia Metal Metallic Salts Market - Porter's Five Forces |
3.5 Australia Metal Metallic Salts Market Revenues & Volume Share, By Application, 2022 & 2032F |
3.6 Australia Metal Metallic Salts Market Revenues & Volume Share, By End User, 2022 & 2032F |
4 Australia Metal Metallic Salts Market Dynamics |
4.1 Impact Analysis |
4.2 Market Drivers |
4.2.1 Increasing demand from industries such as agriculture, pharmaceuticals, and chemicals driving the growth of the Australia metal metallic salts market. |
4.2.2 Growing awareness about the benefits and applications of metal metallic salts in various sectors. |
4.2.3 Technological advancements leading to the development of innovative metal metallic salt products. |
4.3 Market Restraints |
4.3.1 Fluctuations in raw material prices impacting the production costs of metal metallic salts. |
4.3.2 Stringent regulations and environmental concerns related to the usage and disposal of metal metallic salts. |
4.3.3 Competition from alternative products and substitutes affecting the market growth. |
5 Australia Metal Metallic Salts Market Trends |
6 Australia Metal Metallic Salts Market, By Types |
6.1 Australia Metal Metallic Salts Market, By Application |
6.1.1 Overview and Analysis |
6.1.2 Australia Metal Metallic Salts Market Revenues & Volume, By Application, 2022 - 2032F |
6.1.3 Australia Metal Metallic Salts Market Revenues & Volume, By Phototransistors, 2022 - 2032F |
6.1.4 Australia Metal Metallic Salts Market Revenues & Volume, By Photo Voltaic Cells, 2022 - 2032F |
6.1.5 Australia Metal Metallic Salts Market Revenues & Volume, By Transparent Electrodes, 2022 - 2032F |
6.1.6 Australia Metal Metallic Salts Market Revenues & Volume, By Liquid Crystal Displays, 2022 - 2032F |
6.1.7 Australia Metal Metallic Salts Market Revenues & Volume, By IR Detectors, 2022 - 2032F |
6.1.8 Australia Metal Metallic Salts Market Revenues & Volume, By Anti-Reflection Coatings, 2022 - 2032F |
6.1.9 Australia Metal Metallic Salts Market Revenues & Volume, By Others, 2022 - 2032F |
6.1.10 Australia Metal Metallic Salts Market Revenues & Volume, By Others, 2022 - 2032F |
6.2 Australia Metal Metallic Salts Market, By End User |
6.2.1 Overview and Analysis |
6.2.2 Australia Metal Metallic Salts Market Revenues & Volume, By Mining Industry, 2022 - 2032F |
6.2.3 Australia Metal Metallic Salts Market Revenues & Volume, By Electroplating Industry, 2022 - 2032F |
6.2.4 Australia Metal Metallic Salts Market Revenues & Volume, By Others, 2022 - 2032F |
7 Australia Metal Metallic Salts Market Import-Export Trade Statistics |
7.1 Australia Metal Metallic Salts Market Export to Major Countries |
7.2 Australia Metal Metallic Salts Market Imports from Major Countries |
8 Australia Metal Metallic Salts Market Key Performance Indicators |
8.1 Research and development investment in new metal metallic salt formulations. |
8.2 Number of patents filed for metal metallic salt products. |
8.3 Rate of adoption of metal metallic salts in emerging applications. |
8.4 Environmental sustainability metrics related to the production and use of metal metallic salts. |
8.5 Customer satisfaction and loyalty towards metal metallic salt products. |
9 Australia Metal Metallic Salts Market - Opportunity Assessment |
9.1 Australia Metal Metallic Salts Market Opportunity Assessment, By Application, 2022 & 2032F |
9.2 Australia Metal Metallic Salts Market Opportunity Assessment, By End User, 2022 & 2032F |
10 Australia Metal Metallic Salts Market - Competitive Landscape |
10.1 Australia Metal Metallic Salts Market Revenue Share, By Companies, 2025 |
10.2 Australia Metal Metallic Salts Market Competitive Benchmarking, By Operating and Technical Parameters |
11 Company Profiles |
12 Recommendations |
13 Disclaimer |
Export potential assessment - trade Analytics for 2030
Export potential enables firms to identify high-growth global markets with greater confidence by combining advanced trade intelligence with a structured quantitative methodology. The framework analyzes emerging demand trends and country-level import patterns while integrating macroeconomic and trade datasets such as GDP and population forecasts, bilateral import–export flows, tariff structures, elasticity differentials between developed and developing economies, geographic distance, and import demand projections. Using weighted trade values from 2020–2024 as the base period to project country-to-country export potential for 2030, these inputs are operationalized through calculated drivers such as gravity model parameters, tariff impact factors, and projected GDP per-capita growth. Through an analysis of hidden potentials, demand hotspots, and market conditions that are most favorable to success, this method enables firms to focus on target countries, maximize returns, and global expansion with data, backed by accuracy.
By factoring in the projected importer demand gap that is currently unmet and could be potential opportunity, it identifies the potential for the Exporter (Country) among 190 countries, against the general trade analysis, which identifies the biggest importer or exporter.
To discover high-growth global markets and optimize your business strategy:
Click Here
Pricing
- Single User License$ 1,995
- Department License$ 2,400
- Site License$ 3,120
- Global License$ 3,795

Search
Thought Leadership and Analyst Meet


Our Clients
Latest Reports
- Canada Cloud CFD Market (2026-2032) | Size & Revenue, Industry, Growth, Competitive Landscape, Forecast, Segmentation, Value, Outlook, Trends, Share, Analysis, Companies
- Taiwan Food Delivery Platform Market (2026-2032) | Companies, Outlook, Analysis, Trends, Value, Revenue, Segmentation, Share, Forecast, Competitive Landscape, Growth, Size & Forecast
- United Kingdom (UK) Long-term Care Insurance Market (2026-2032) | Growth, Share, Consumer Insights, Drivers, Opportunities, Competition, Pricing Analysis, Segments, Restraints, Companies, Competitive, Value, Outlook, Size, Demand, Analysis, Challenges, Strategic Insights, Investment Trends, Revenue, Trends, Supply, Forecast
- United Kingdom (UK) Long Term Care Market (2026-2032) | Companies, Outlook, Analysis, Trends, Value, Revenue, Segmentation, Share, Forecast, Competitive Landscape, Growth, Size & Forecast
- Iraq Insulation and Waterproofing Market (2026-2032) | Outlook, Drivers, Growth, Size, Share, Industry, Revenue, Trends, Demand, Competitive, Strategic Insights, Opportunities, Segments, Companies, Challenges, Strategy, Consumer Insights, Analysis, Investment Trends, Value, Segmentation, Forecast, Restraints
- India Switchgear Market Outlook (2026-2032) | Size, Share, Trends, Growth, Revenue, Forecast, Analysis, Value, Outlook
- Pakistan Contraceptive Implants Market (2025-2031) | Demand, Growth, Size, Share, Industry, Pricing Analysis, Competitive, Strategic Insights, Strategy, Consumer Insights, Analysis, Investment Trends, Opportunities, Revenue, Segments, Value, Segmentation, Supply, Forecast, Restraints, Outlook, Competition, Drivers, Trends, Companies, Challenges
- Sri Lanka Packaging Market (2026-2032) | Outlook, Competition, Drivers, Trends, Demand, Pricing Analysis, Competitive, Strategic Insights, Companies, Challenges, Strategy, Consumer Insights, Analysis, Investment Trends, Opportunities, Growth, Size, Share, Industry, Revenue, Segments, Value, Segmentation, Supply, Forecast, Restraints
- India Kids Watches Market (2026-2032) | Strategy, Consumer Insights, Analysis, Investment Trends, Opportunities, Growth, Size, Share, Industry, Revenue, Segments, Value, Segmentation, Supply, Forecast, Restraints, Outlook, Competition, Drivers, Trends, Demand, Pricing Analysis, Competitive, Strategic Insights, Companies, Challenges
- Saudi Arabia Core Assurance Service Market (2025-2031) | Strategy, Consumer Insights, Analysis, Investment Trends, Opportunities, Growth, Size, Share, Industry, Revenue, Segments, Value, Segmentation, Supply, Forecast, Restraints, Outlook, Competition, Drivers, Trends, Demand, Pricing Analysis, Competitive, Strategic Insights, Companies, Challenges
Industry Events and Analyst Meet

India EV Show 2026

EV tech India Expo 2026

Auto Tech Asia 2026

Battery Tech India 2026

Smart Production Solutions Guangzhou 2026
Whitepaper
- Middle East & Africa Commercial Security Market Click here to view more.
- Middle East & Africa Fire Safety Systems & Equipment Market Click here to view more.
- GCC Drone Market Click here to view more.
- Middle East Lighting Fixture Market Click here to view more.
- GCC Physical & Perimeter Security Market Click here to view more.
6WResearch In News
- Doha a strategic location for EV manufacturing hub: IPA Qatar
- Demand for luxury TVs surging in the GCC, says Samsung
- Empowering Growth: The Thriving Journey of Bangladesh’s Cable Industry
- Demand for luxury TVs surging in the GCC, says Samsung
- Video call with a traditional healer? Once unthinkable, it’s now common in South Africa
- Intelligent Buildings To Smooth GCC’s Path To Net Zero