Australia N-propanol Market Outlook | Trends, Forecast, Share, Industry, Size, Value, Companies, COVID-19 IMPACT, Growth, Revenue & Analysis
Market Forecast By Type (Ethylene Hydrogenation Method, Allyl Alcohol Hydrogenation Method, Other Compounds Byproduct Method), By Application (Coatings, Food Additive, Pharmaceutical, Cosmetics, Others) And Competitive Landscape
| Product Code: ETC335075 | Publication Date: Aug 2022 | Updated Date: Jan 2026 | Product Type: Market Research Report | |
| Publisher: 6Wresearch | Author: Shubham Padhi | No. of Pages: 75 | No. of Figures: 35 | No. of Tables: 20 |
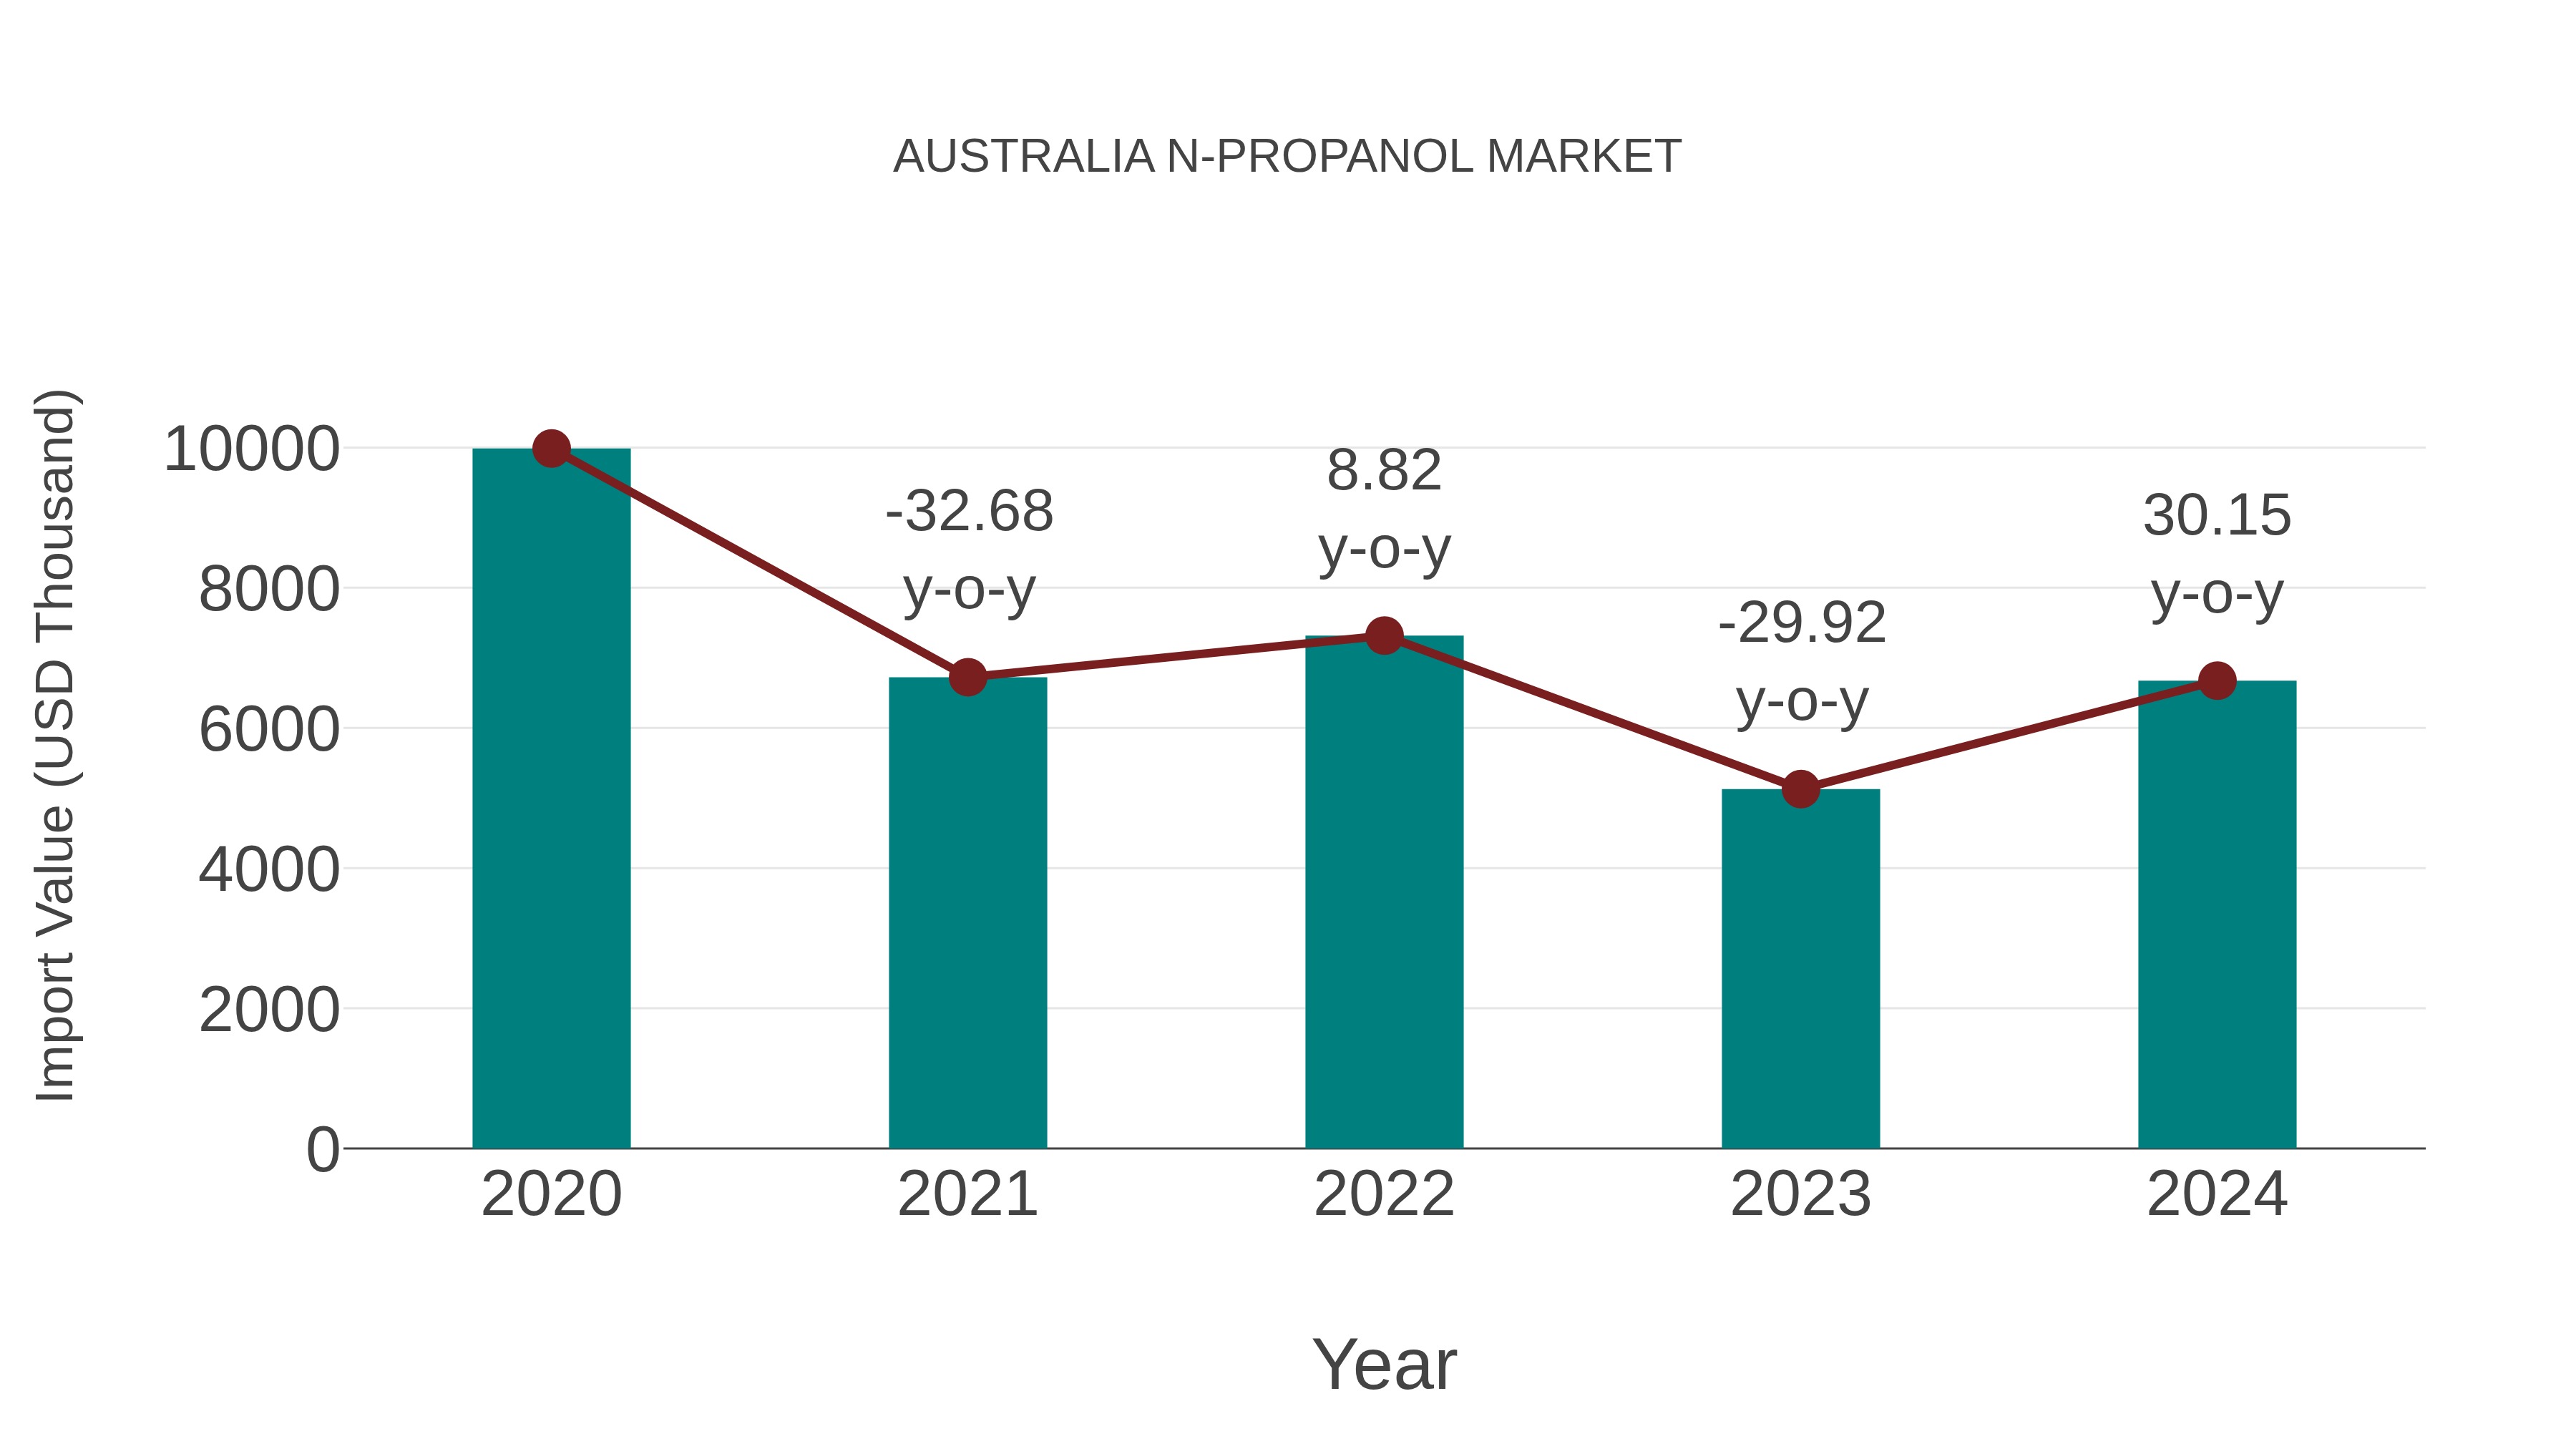
Australia N-propanol Market: Import Trend Analysis
In the Australia n-propanol market, the import trend experienced notable fluctuations. The growth rate from 2023 to 2024 surged by 30.15%, contrasting with a compound annual growth rate (CAGR) of -9.59% from 2020 to 2024. This shift could be attributed to changing demand dynamics or alterations in trade policies impacting market stability.
Australia N Propanol Market Synopsis
The N-propanol market in Australia is influenced by demand from the chemical, pharmaceutical, and industrial cleaning sectors. It is used as a solvent in coatings, inks, and disinfectants. Sustainability concerns are driving interest in bio-based alternatives.
Drivers of the market
The N-propanol market in Australia is growing due to its applications in coatings, pharmaceuticals, and cleaning products. The increasing demand for industrial solvents and disinfectants has contributed to the market`s expansion. The shift towards greener and more sustainable solvents, along with advancements in production technologies, is influencing market trends. Additionally, the growing need for high-purity solvents in the pharmaceutical industry further supports market growth.
Challenges of the market
The n-propanol market encounters challenges related to volatile raw material prices and strict environmental regulations. Competition from alternative solvents in industrial applications also affects overall market expansion.
Investment opportunities in the Market
N-Propanol, widely used as a solvent in pharmaceuticals, cosmetics, and industrial applications, has strong investment potential in Australia. The increasing demand for high-performance solvents, coupled with the expansion of the chemical processing industry, creates opportunities for new entrants. Investors can focus on sustainable production methods, including bio-based n-propanol, to cater to the rising demand for environmentally friendly chemical solutions. Strengthening supply chain networks and forming strategic partnerships with end-user industries can further boost market presence.
Government Policy of the market
The N-propanol market is governed by chemical safety regulations and industrial policies. Government laws mandate proper handling, storage, and labeling of industrial solvents. Import controls ensure compliance with Australian chemical safety standards, while environmental policies promote the use of eco-friendly alternatives.
Key Highlights of the Report:
- Australia N-propanol Market Outlook
- Market Size of Australia N-propanol Market, 2024
- Forecast of Australia N-propanol Market, 2031
- Historical Data and Forecast of Australia N-propanol Revenues & Volume for the Period 2018 - 2031
- Australia N-propanol Market Trend Evolution
- Australia N-propanol Market Drivers and Challenges
- Australia N-propanol Price Trends
- Australia N-propanol Porter's Five Forces
- Australia N-propanol Industry Life Cycle
- Historical Data and Forecast of Australia N-propanol Market Revenues & Volume By Type for the Period 2018 - 2031
- Historical Data and Forecast of Australia N-propanol Market Revenues & Volume By Ethylene Hydrogenation Method for the Period 2018 - 2031
- Historical Data and Forecast of Australia N-propanol Market Revenues & Volume By Allyl Alcohol Hydrogenation Method for the Period 2018 - 2031
- Historical Data and Forecast of Australia N-propanol Market Revenues & Volume By Other Compounds Byproduct Method for the Period 2018 - 2031
- Historical Data and Forecast of Australia N-propanol Market Revenues & Volume By Application for the Period 2018 - 2031
- Historical Data and Forecast of Australia N-propanol Market Revenues & Volume By Coatings for the Period 2018 - 2031
- Historical Data and Forecast of Australia N-propanol Market Revenues & Volume By Food Additive for the Period 2018 - 2031
- Historical Data and Forecast of Australia N-propanol Market Revenues & Volume By Pharmaceutical for the Period 2018 - 2031
- Historical Data and Forecast of Australia N-propanol Market Revenues & Volume By Cosmetics for the Period 2018 - 2031
- Historical Data and Forecast of Australia N-propanol Market Revenues & Volume By Others for the Period 2018 - 2031
- Australia N-propanol Import Export Trade Statistics
- Market Opportunity Assessment By Type
- Market Opportunity Assessment By Application
- Australia N-propanol Top Companies Market Share
- Australia N-propanol Competitive Benchmarking By Technical and Operational Parameters
- Australia N-propanol Company Profiles
- Australia N-propanol Key Strategic Recommendations
Frequently Asked Questions About the Market Study (FAQs):
6Wresearch actively monitors the Australia N-propanol Market and publishes its comprehensive annual report, highlighting emerging trends, growth drivers, revenue analysis, and forecast outlook. Our insights help businesses to make data-backed strategic decisions with ongoing market dynamics. Our analysts track relevent industries related to the Australia N-propanol Market, allowing our clients with actionable intelligence and reliable forecasts tailored to emerging regional needs.
Yes, we provide customisation as per your requirements. To learn more, feel free to contact us on sales@6wresearch.com
1 Executive Summary |
2 Introduction |
2.1 Key Highlights of the Report |
2.2 Report Description |
2.3 Market Scope & Segmentation |
2.4 Research Methodology |
2.5 Assumptions |
3 Australia N-propanol Market Overview |
3.1 Australia Country Macro Economic Indicators |
3.2 Australia N-propanol Market Revenues & Volume, 2021 & 2031F |
3.3 Australia N-propanol Market - Industry Life Cycle |
3.4 Australia N-propanol Market - Porter's Five Forces |
3.5 Australia N-propanol Market Revenues & Volume Share, By Type, 2021 & 2031F |
3.6 Australia N-propanol Market Revenues & Volume Share, By Application, 2021 & 2031F |
4 Australia N-propanol Market Dynamics |
4.1 Impact Analysis |
4.2 Market Drivers |
4.2.1 Increasing demand for n-propanol in the pharmaceutical industry for manufacturing drugs and medications. |
4.2.2 Growing use of n-propanol as a solvent in various applications such as coatings, inks, and cleaning agents. |
4.2.3 Rising adoption of n-propanol in the production of cosmetics and personal care products due to its properties as a solvent and viscosity agent. |
4.3 Market Restraints |
4.3.1 Fluctuating prices of raw materials used in n-propanol production, such as propylene and acetone. |
4.3.2 Stringent regulations related to the use and disposal of n-propanol, impacting production costs and compliance efforts. |
4.3.3 Competition from alternative solvents and chemicals that offer similar properties to n-propanol at potentially lower costs. |
5 Australia N-propanol Market Trends |
6 Australia N-propanol Market, By Types |
6.1 Australia N-propanol Market, By Type |
6.1.1 Overview and Analysis |
6.1.2 Australia N-propanol Market Revenues & Volume, By Type, 2021-2031F |
6.1.3 Australia N-propanol Market Revenues & Volume, By Ethylene Hydrogenation Method, 2021-2031F |
6.1.4 Australia N-propanol Market Revenues & Volume, By Allyl Alcohol Hydrogenation Method, 2021-2031F |
6.1.5 Australia N-propanol Market Revenues & Volume, By Other Compounds Byproduct Method, 2021-2031F |
6.2 Australia N-propanol Market, By Application |
6.2.1 Overview and Analysis |
6.2.2 Australia N-propanol Market Revenues & Volume, By Coatings, 2021-2031F |
6.2.3 Australia N-propanol Market Revenues & Volume, By Food Additive, 2021-2031F |
6.2.4 Australia N-propanol Market Revenues & Volume, By Pharmaceutical, 2021-2031F |
6.2.5 Australia N-propanol Market Revenues & Volume, By Cosmetics, 2021-2031F |
6.2.6 Australia N-propanol Market Revenues & Volume, By Others, 2021-2031F |
7 Australia N-propanol Market Import-Export Trade Statistics |
7.1 Australia N-propanol Market Export to Major Countries |
7.2 Australia N-propanol Market Imports from Major Countries |
8 Australia N-propanol Market Key Performance Indicators |
8.1 Average selling price of n-propanol in the Australian market. |
8.2 Number of new product developments or innovations involving n-propanol. |
8.3 Amount of n-propanol used in key end-use industries such as pharmaceuticals, cosmetics, and coatings. |
9 Australia N-propanol Market - Opportunity Assessment |
9.1 Australia N-propanol Market Opportunity Assessment, By Type, 2021 & 2031F |
9.2 Australia N-propanol Market Opportunity Assessment, By Application, 2021 & 2031F |
10 Australia N-propanol Market - Competitive Landscape |
10.1 Australia N-propanol Market Revenue Share, By Companies, 2024 |
10.2 Australia N-propanol Market Competitive Benchmarking, By Operating and Technical Parameters |
11 Company Profiles |
12 Recommendations |
13 Disclaimer |
Global Go To Market Strategy - 2030
Export potential enables firms to identify high-growth global markets with greater confidence by combining advanced trade intelligence with a structured quantitative methodology. The framework analyzes emerging demand trends and country-level import patterns while integrating macroeconomic and trade datasets such as GDP and population forecasts, bilateral import–export flows, tariff structures, elasticity differentials between developed and developing economies, geographic distance, and import demand projections. Using weighted trade values from 2020–2024 as the base period to project country-to-country export potential for 2030, these inputs are operationalized through calculated drivers such as gravity model parameters, tariff impact factors, and projected GDP per-capita growth. Through an analysis of hidden potentials, demand hotspots, and market conditions that are most favorable to success, this method enables firms to focus on target countries, maximize returns, and global expansion with data, backed by accuracy.
By factoring in the projected importer demand gap that is currently unmet and could be potential opportunity, it identifies the potential for the Exporter (Country) among 190 countries, against the general trade analysis, which identifies the biggest importer or exporter.
To discover high-growth global markets and optimize your business strategy:
Click Here
Pricing
- Single User License$ 1,995
- Department License$ 2,400
- Site License$ 3,120
- Global License$ 3,795

Leadership Perspectives from Industry Events
Search
Thought Leadership and Analyst Meet


Our Clients
6WResearch In News
- India Air Conditioner Market Set for Strong Rebound in 2026 After Weather-Led Correction and GST-Driven Recovery: 6Wresearch
- ADAS in India: How Automatic Emergency Braking, Blind Spot Detection & Driver Monitoring are Transforming Road Safety
- Doha a strategic location for EV manufacturing hub: IPA Qatar
- Demand for luxury TVs surging in the GCC, says Samsung
- Empowering Growth: The Thriving Journey of Bangladesh’s Cable Industry
- Demand for luxury TVs surging in the GCC, says Samsung
Latest Reports
- Poland Fire Protection Systems Market (2026-2032)
- Cape Verde Portable Hand-Thrown Extinguisher Market (2026-2032)
- Canada Portable Hand-Thrown Extinguisher Market (2026-2032)
- Cameroon Portable Hand-Thrown Extinguisher Market (2026-2032)
- Burundi Portable Hand-Thrown Extinguisher Market (2026-2032)
- Burkina Faso Portable Hand-Thrown Extinguisher Market (2026-2032)
- Bulgaria Portable Hand-Thrown Extinguisher Market (2026-2032)
- Brunei Portable Hand-Thrown Extinguisher Market (2026-2032)
- Botswana Portable Hand-Thrown Extinguisher Market (2026-2032)
- Bosnia and Herzegovina Portable Hand-Thrown Extinguisher Market (2026-2032)
Industry Events and Analyst Meet

HIMTEX 2026

India Refining Summit 2026

India EV Show 2026

EV tech India Expo 2026

Auto Tech Asia 2026
Whitepaper
- Middle East & Africa Commercial Security Market Click here to view more.
- Middle East & Africa Fire Safety Systems & Equipment Market Click here to view more.
- GCC Drone Market Click here to view more.
- Middle East Lighting Fixture Market Click here to view more.
- GCC Physical & Perimeter Security Market Click here to view more.