Australia Name Plate Market (2026-2032) Outlook | Size, Analysis, Companies, Revenue, Forecast, Share, Value, Growth, Industry & Trends
Market Forecast By Application (Healthcare Industry, Aerospace Industry, Consumer Products Industry, Food and Beverage, Others), By Type (Metal Nameplate, Plastic Nameplate, Wooden Nameplate) And Competitive Landscape
| Product Code: ETC428131 | Publication Date: Oct 2022 | Updated Date: Mar 2026 | Product Type: Market Research Report | |
| Publisher: 6Wresearch | Author: Shubham Padhi | No. of Pages: 75 | No. of Figures: 35 | No. of Tables: 20 |
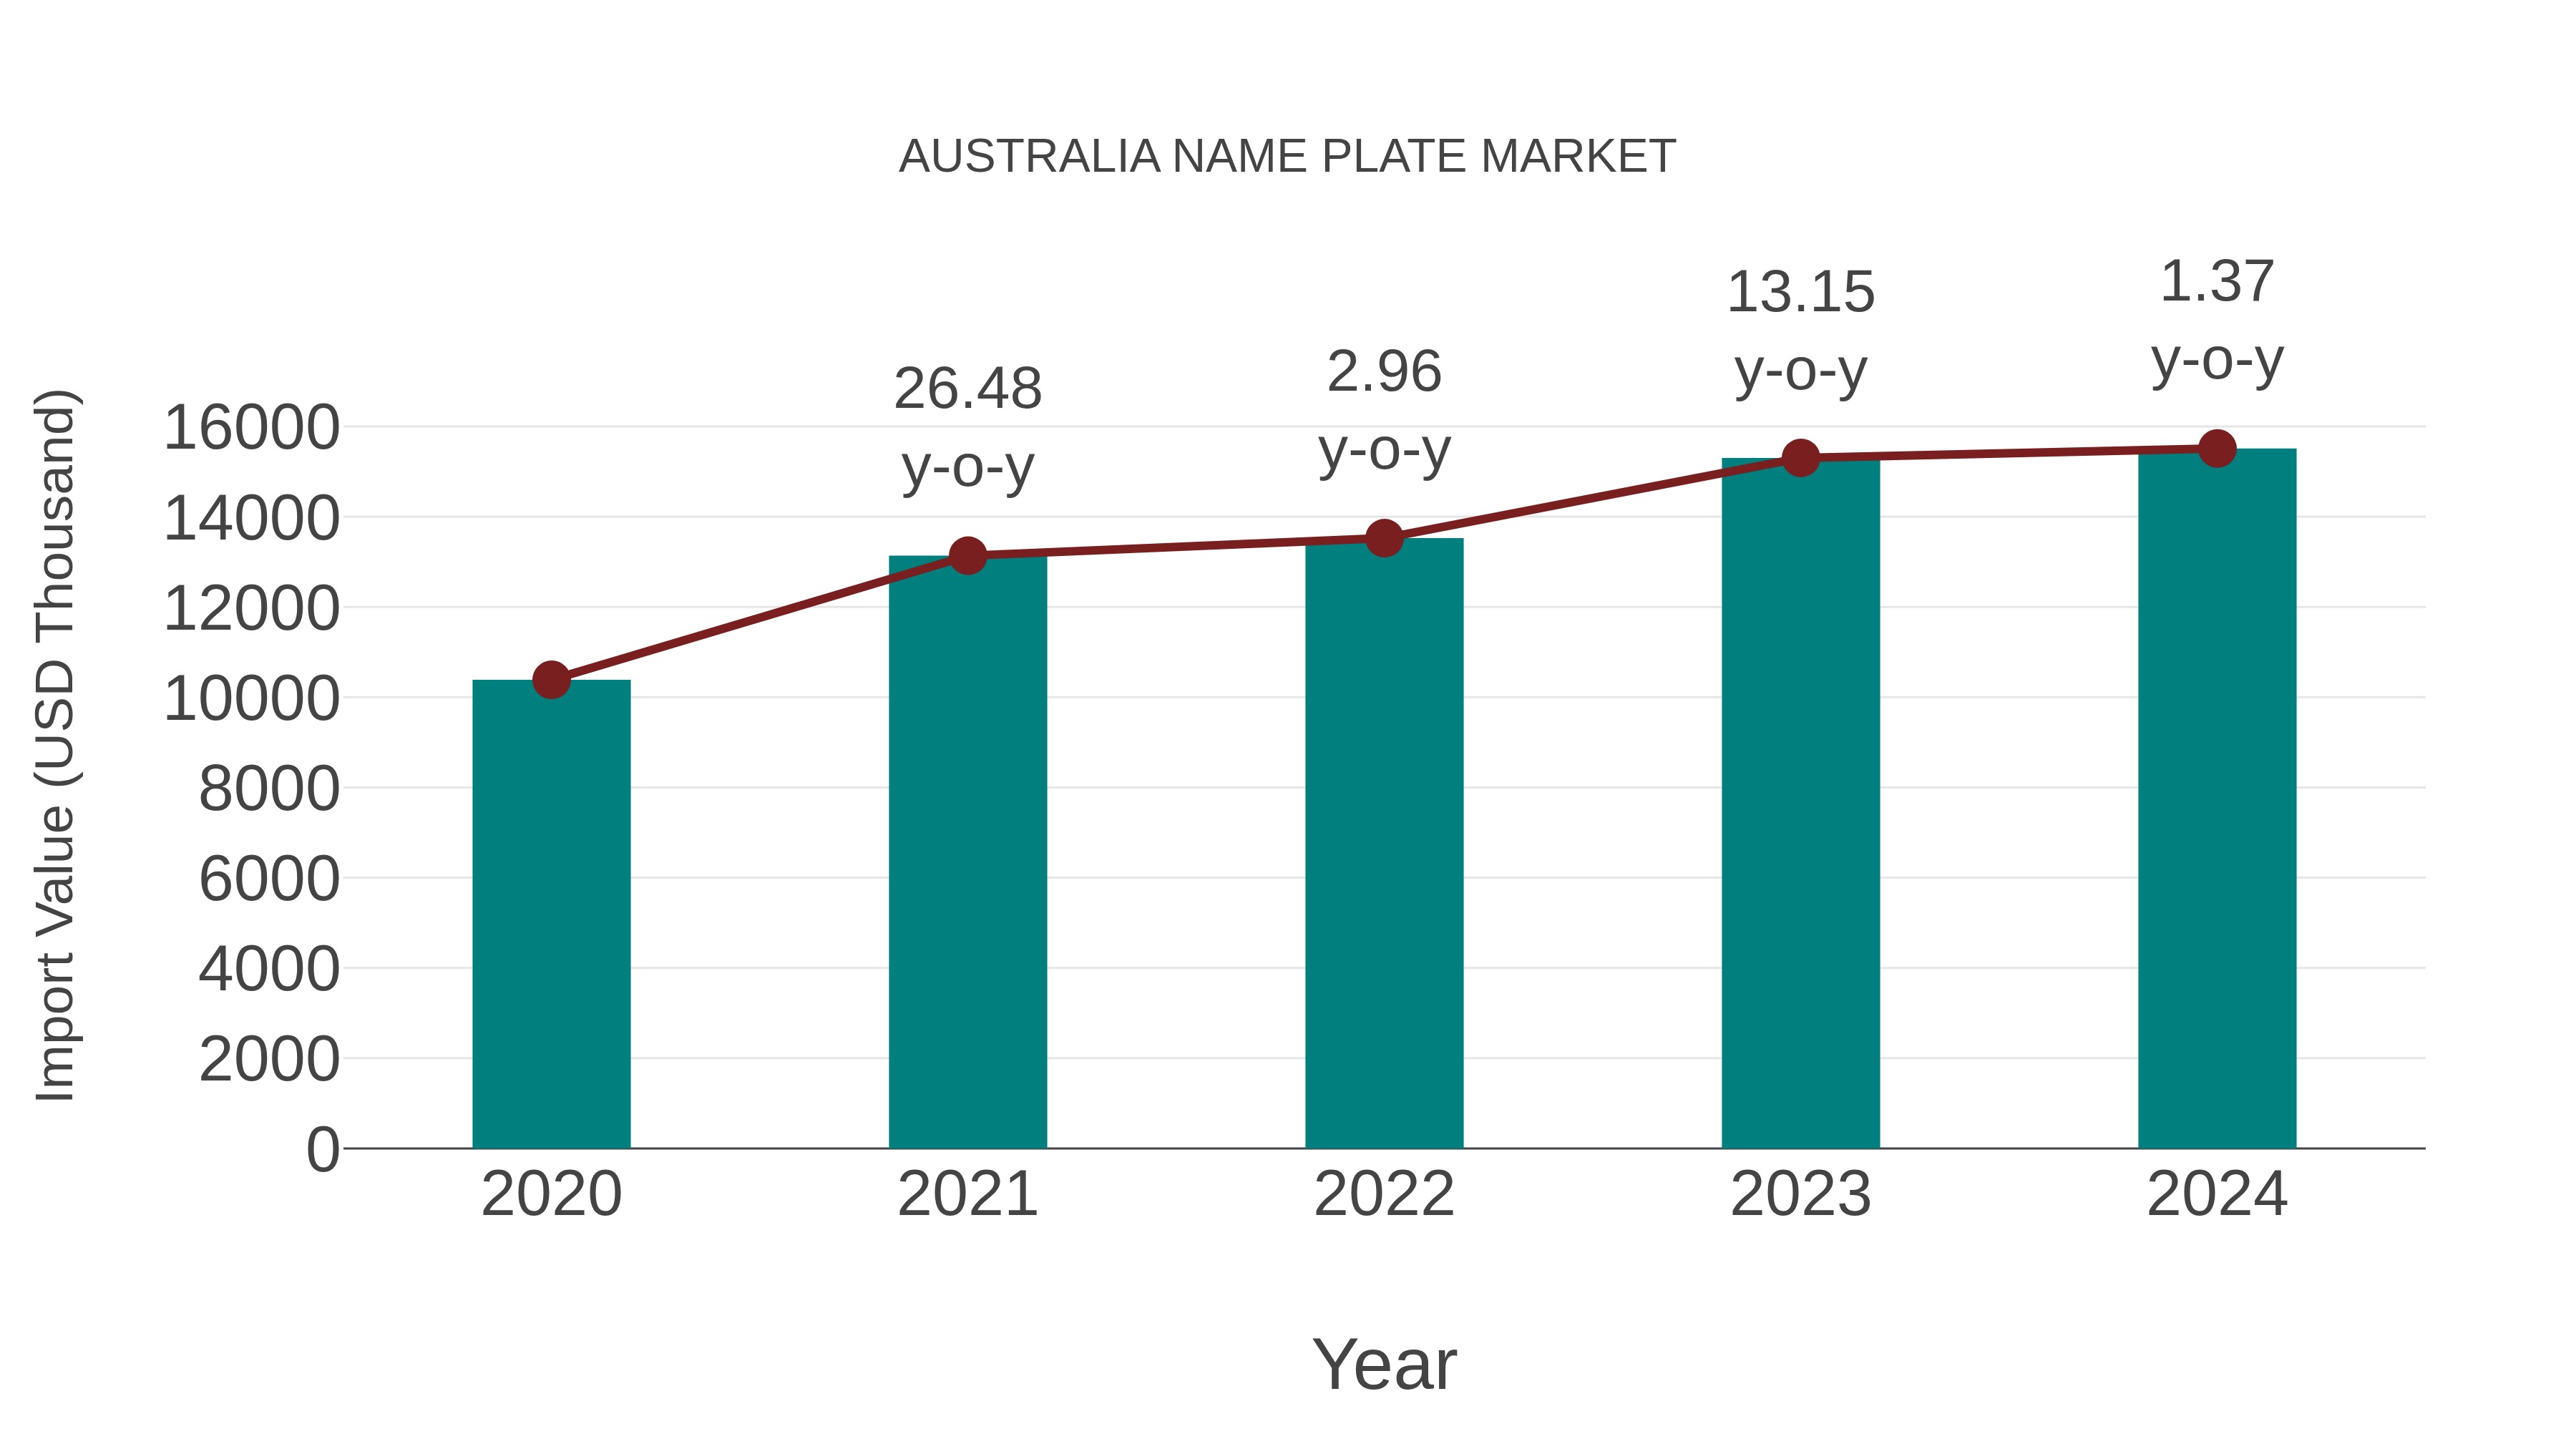
Australia Name Plate Market: Import Trend Analysis
Australia`s import trend for the Australia name plate market showed a growth rate of 1.37% from 2023 to 2024, with a compound annual growth rate (CAGR) of 10.55% spanning 2020 to 2024. This increase can be attributed to a steady demand shift towards quality name plates and a stable market environment supporting sustained import momentum.
Australia Name Plate Market Overview
The name plate market in Australia caters to a variety of applications, including industrial labeling, office signage, and vehicle identification. Demand is strong from the corporate sector, government agencies, and manufacturing industries requiring durable and customized name plates made from materials such as stainless steel, aluminum, and acrylic. Growth in branding and personalization trends supports market expansion, but competition from digital and electronic signage alternatives poses challenges.
Drivers of the market
The name plate market in Australia is driven by increasing demand from the automotive, aerospace, and industrial sectors. Rising adoption of durable and customizable name plates is supporting market growth.
Challenges of the market
The name plate market in Australia is constrained by high production costs and increasing competition from digital signage and plastic alternatives. Limited availability of raw materials and high import tariffs also affect market stability.
Investment opportunities in the Market
The Australia Name Plate Market presents promising investment potential due to rising demand from the automotive, industrial, and electronics sectors. Investment opportunities exist in improving engraving technology, expanding material options, and enhancing product customization. Developing eco-friendly nameplates and expanding export markets could further drive growth.
Government Policy of the market
Name plates in Australia are regulated under the Australian Consumer Law. Import tariffs on name plates and signage materials are minimal. The government supports domestic manufacturing through tax credits for industrial and commercial signage production. Safety and environmental regulations apply to materials used in name plate production.
Key Highlights of the Report:
- Australia Name Plate Market Outlook
- Market Size of Australia Name Plate Market, 2025
- Forecast of Australia Name Plate Market, 2032
- Historical Data and Forecast of Australia Name Plate Revenues & Volume for the Period 2022-2032F
- Australia Name Plate Market Trend Evolution
- Australia Name Plate Market Drivers and Challenges
- Australia Name Plate Price Trends
- Australia Name Plate Porter's Five Forces
- Australia Name Plate Industry Life Cycle
- Historical Data and Forecast of Australia Name Plate Market Revenues & Volume By Application for the Period 2022-2032F
- Historical Data and Forecast of Australia Name Plate Market Revenues & Volume By Healthcare Industry for the Period 2022-2032F
- Historical Data and Forecast of Australia Name Plate Market Revenues & Volume By Aerospace Industry for the Period 2022-2032F
- Historical Data and Forecast of Australia Name Plate Market Revenues & Volume By Consumer Products Industry for the Period 2022-2032F
- Historical Data and Forecast of Australia Name Plate Market Revenues & Volume By Food and Beverage for the Period 2022-2032F
- Historical Data and Forecast of Australia Name Plate Market Revenues & Volume By Others for the Period 2022-2032F
- Historical Data and Forecast of Australia Name Plate Market Revenues & Volume By Type for the Period 2022-2032F
- Historical Data and Forecast of Australia Name Plate Market Revenues & Volume By Metal Nameplate for the Period 2022-2032F
- Historical Data and Forecast of Australia Name Plate Market Revenues & Volume By Plastic Nameplate for the Period 2022-2032F
- Historical Data and Forecast of Australia Name Plate Market Revenues & Volume By Wooden Nameplate for the Period 2022-2032F
- Australia Name Plate Import Export Trade Statistics
- Market Opportunity Assessment By Application
- Market Opportunity Assessment By Type
- Australia Name Plate Top Companies Market Share
- Australia Name Plate Competitive Benchmarking By Technical and Operational Parameters
- Australia Name Plate Company Profiles
- Australia Name Plate Key Strategic Recommendations
Australia Name Plate Market (2026-2032): FAQs
6Wresearch actively monitors the Australia Name Plate Market and publishes its comprehensive annual report, highlighting emerging trends, growth drivers, revenue analysis, and forecast outlook. Our insights help businesses to make data-backed strategic decisions with ongoing market dynamics. Our analysts track relevent industries related to the Australia Name Plate Market, allowing our clients with actionable intelligence and reliable forecasts tailored to emerging regional needs.
Yes, we provide customisation as per your requirements. To learn more, feel free to contact us on sales@6wresearch.com
1 Executive Summary |
2 Introduction |
2.1 Key Highlights of the Report |
2.2 Report Description |
2.3 Market Scope & Segmentation |
2.4 Research Methodology |
2.5 Assumptions |
3 Australia Name Plate Market Overview |
3.1 Australia Country Macro Economic Indicators |
3.2 Australia Name Plate Market Revenues & Volume, 2022 & 2032F |
3.3 Australia Name Plate Market - Industry Life Cycle |
3.4 Australia Name Plate Market - Porter's Five Forces |
3.5 Australia Name Plate Market Revenues & Volume Share, By Application, 2022 & 2032F |
3.6 Australia Name Plate Market Revenues & Volume Share, By Type, 2022 & 2032F |
4 Australia Name Plate Market Dynamics |
4.1 Impact Analysis |
4.2 Market Drivers |
4.2.1 Increasing demand for personalized and customizable name plates |
4.2.2 Growth in the real estate and construction industry in Australia |
4.2.3 Rising trend of gifting personalized items for special occasions |
4.3 Market Restraints |
4.3.1 Fluctuations in raw material prices impacting production costs |
4.3.2 Competition from alternative personalization solutions like digital printing |
4.3.3 Economic uncertainties affecting consumer spending patterns |
5 Australia Name Plate Market Trends |
6 Australia Name Plate Market, By Types |
6.1 Australia Name Plate Market, By Application |
6.1.1 Overview and Analysis |
6.1.2 Australia Name Plate Market Revenues & Volume, By Application, 2022-2032F |
6.1.3 Australia Name Plate Market Revenues & Volume, By Healthcare Industry, 2022-2032F |
6.1.4 Australia Name Plate Market Revenues & Volume, By Aerospace Industry, 2022-2032F |
6.1.5 Australia Name Plate Market Revenues & Volume, By Consumer Products Industry, 2022-2032F |
6.1.6 Australia Name Plate Market Revenues & Volume, By Food and Beverage, 2022-2032F |
6.1.7 Australia Name Plate Market Revenues & Volume, By Others, 2022-2032F |
6.2 Australia Name Plate Market, By Type |
6.2.1 Overview and Analysis |
6.2.2 Australia Name Plate Market Revenues & Volume, By Metal Nameplate, 2022-2032F |
6.2.3 Australia Name Plate Market Revenues & Volume, By Plastic Nameplate, 2022-2032F |
6.2.4 Australia Name Plate Market Revenues & Volume, By Wooden Nameplate, 2022-2032F |
7 Australia Name Plate Market Import-Export Trade Statistics |
7.1 Australia Name Plate Market Export to Major Countries |
7.2 Australia Name Plate Market Imports from Major Countries |
8 Australia Name Plate Market Key Performance Indicators |
8.1 Average order value per customer |
8.2 Customer retention rate |
8.3 Percentage of repeat customers |
8.4 Website traffic and conversion rates |
8.5 Number of new product launches and customer engagement with them |
9 Australia Name Plate Market - Opportunity Assessment |
9.1 Australia Name Plate Market Opportunity Assessment, By Application, 2022 & 2032F |
9.2 Australia Name Plate Market Opportunity Assessment, By Type, 2022 & 2032F |
10 Australia Name Plate Market - Competitive Landscape |
10.1 Australia Name Plate Market Revenue Share, By Companies, 2025 |
10.2 Australia Name Plate Market Competitive Benchmarking, By Operating and Technical Parameters |
11 Company Profiles |
12 Recommendations |
13 Disclaimer |
Global Go To Market Strategy - 2030
Export potential enables firms to identify high-growth global markets with greater confidence by combining advanced trade intelligence with a structured quantitative methodology. The framework analyzes emerging demand trends and country-level import patterns while integrating macroeconomic and trade datasets such as GDP and population forecasts, bilateral import–export flows, tariff structures, elasticity differentials between developed and developing economies, geographic distance, and import demand projections. Using weighted trade values from 2020–2024 as the base period to project country-to-country export potential for 2030, these inputs are operationalized through calculated drivers such as gravity model parameters, tariff impact factors, and projected GDP per-capita growth. Through an analysis of hidden potentials, demand hotspots, and market conditions that are most favorable to success, this method enables firms to focus on target countries, maximize returns, and global expansion with data, backed by accuracy.
By factoring in the projected importer demand gap that is currently unmet and could be potential opportunity, it identifies the potential for the Exporter (Country) among 190 countries, against the general trade analysis, which identifies the biggest importer or exporter.
To discover high-growth global markets and optimize your business strategy:
Click Here
Pricing
- Single User License$ 1,995
- Department License$ 2,400
- Site License$ 3,120
- Global License$ 3,795

Leadership Perspectives from Industry Events
Search
Thought Leadership and Analyst Meet


Our Clients
6WResearch In News
- India Export Attractiveness Tracker 2026
- India Air Conditioner Market Set for Strong Rebound in 2026 After Weather-Led Correction and GST-Driven Recovery: 6Wresearch
- ADAS in India: How Automatic Emergency Braking, Blind Spot Detection & Driver Monitoring are Transforming Road Safety
- Doha a strategic location for EV manufacturing hub: IPA Qatar
- Demand for luxury TVs surging in the GCC, says Samsung
- Empowering Growth: The Thriving Journey of Bangladesh’s Cable Industry
Latest Reports
- Nicaragua RPG Gaming Market (2026-2032)
- New Zealand RPG Gaming Market (2026-2032)
- Netherlands RPG Gaming Market (2026-2032)
- Nauru RPG Gaming Market (2026-2032)
- Namibia RPG Gaming Market (2026-2032)
- Mozambique RPG Gaming Market (2026-2032)
- Montenegro RPG Gaming Market (2026-2032)
- Mongolia RPG Gaming Market (2026-2032)
- Monaco RPG Gaming Market (2026-2032)
- Micronesia RPG Gaming Market (2026-2032)
Industry Events and Analyst Meet

EV India Expo 2026

HIMTEX 2026

India Refining Summit 2026

India EV Show 2026

EV tech India Expo 2026
Whitepaper
- Middle East & Africa Commercial Security Market Click here to view more.
- Middle East & Africa Fire Safety Systems & Equipment Market Click here to view more.
- GCC Drone Market Click here to view more.
- Middle East Lighting Fixture Market Click here to view more.
- GCC Physical & Perimeter Security Market Click here to view more.