Australia Nano Coatings Market (2026-2032) | Competitive, Challenges, Size, Analysis, Demand, Outlook, Segmentation, Opportunities, Drivers, Restraints, Industry, Growth, Strategy, Segments, Value, Trends, Supply, Consumer Insights, Revenue, Pricing Analysis, Strategic Insights, Forecast, Competition, Investment Trends, Share, Companies
Market Forecast By Coating Type (Anti-Corrosion Coatings, Self-Cleaning Coatings, Anti-Fingerprint Coatings, Conductive Coatings, Anti-Microbial Coatings), By Material (Metal Oxides, Titanium Dioxide, Nano-Silica, Carbon Nanotubes, Silver Nanoparticles), By Application (Automotive, Construction, Electronics, Aerospace, Medical Devices), By Form (Liquid, Spray, Thin Film, Powder, Paste), By Substrate (Metal, Glass, Plastic, Ceramics, Polymers) And Competitive Landscape
| Product Code: ETC12964286 | Publication Date: Apr 2025 | Updated Date: Mar 2026 | Product Type: Market Research Report | |
| Publisher: 6Wresearch | Author: Shubham Padhi | No. of Pages: 65 | No. of Figures: 34 | No. of Tables: 19 |
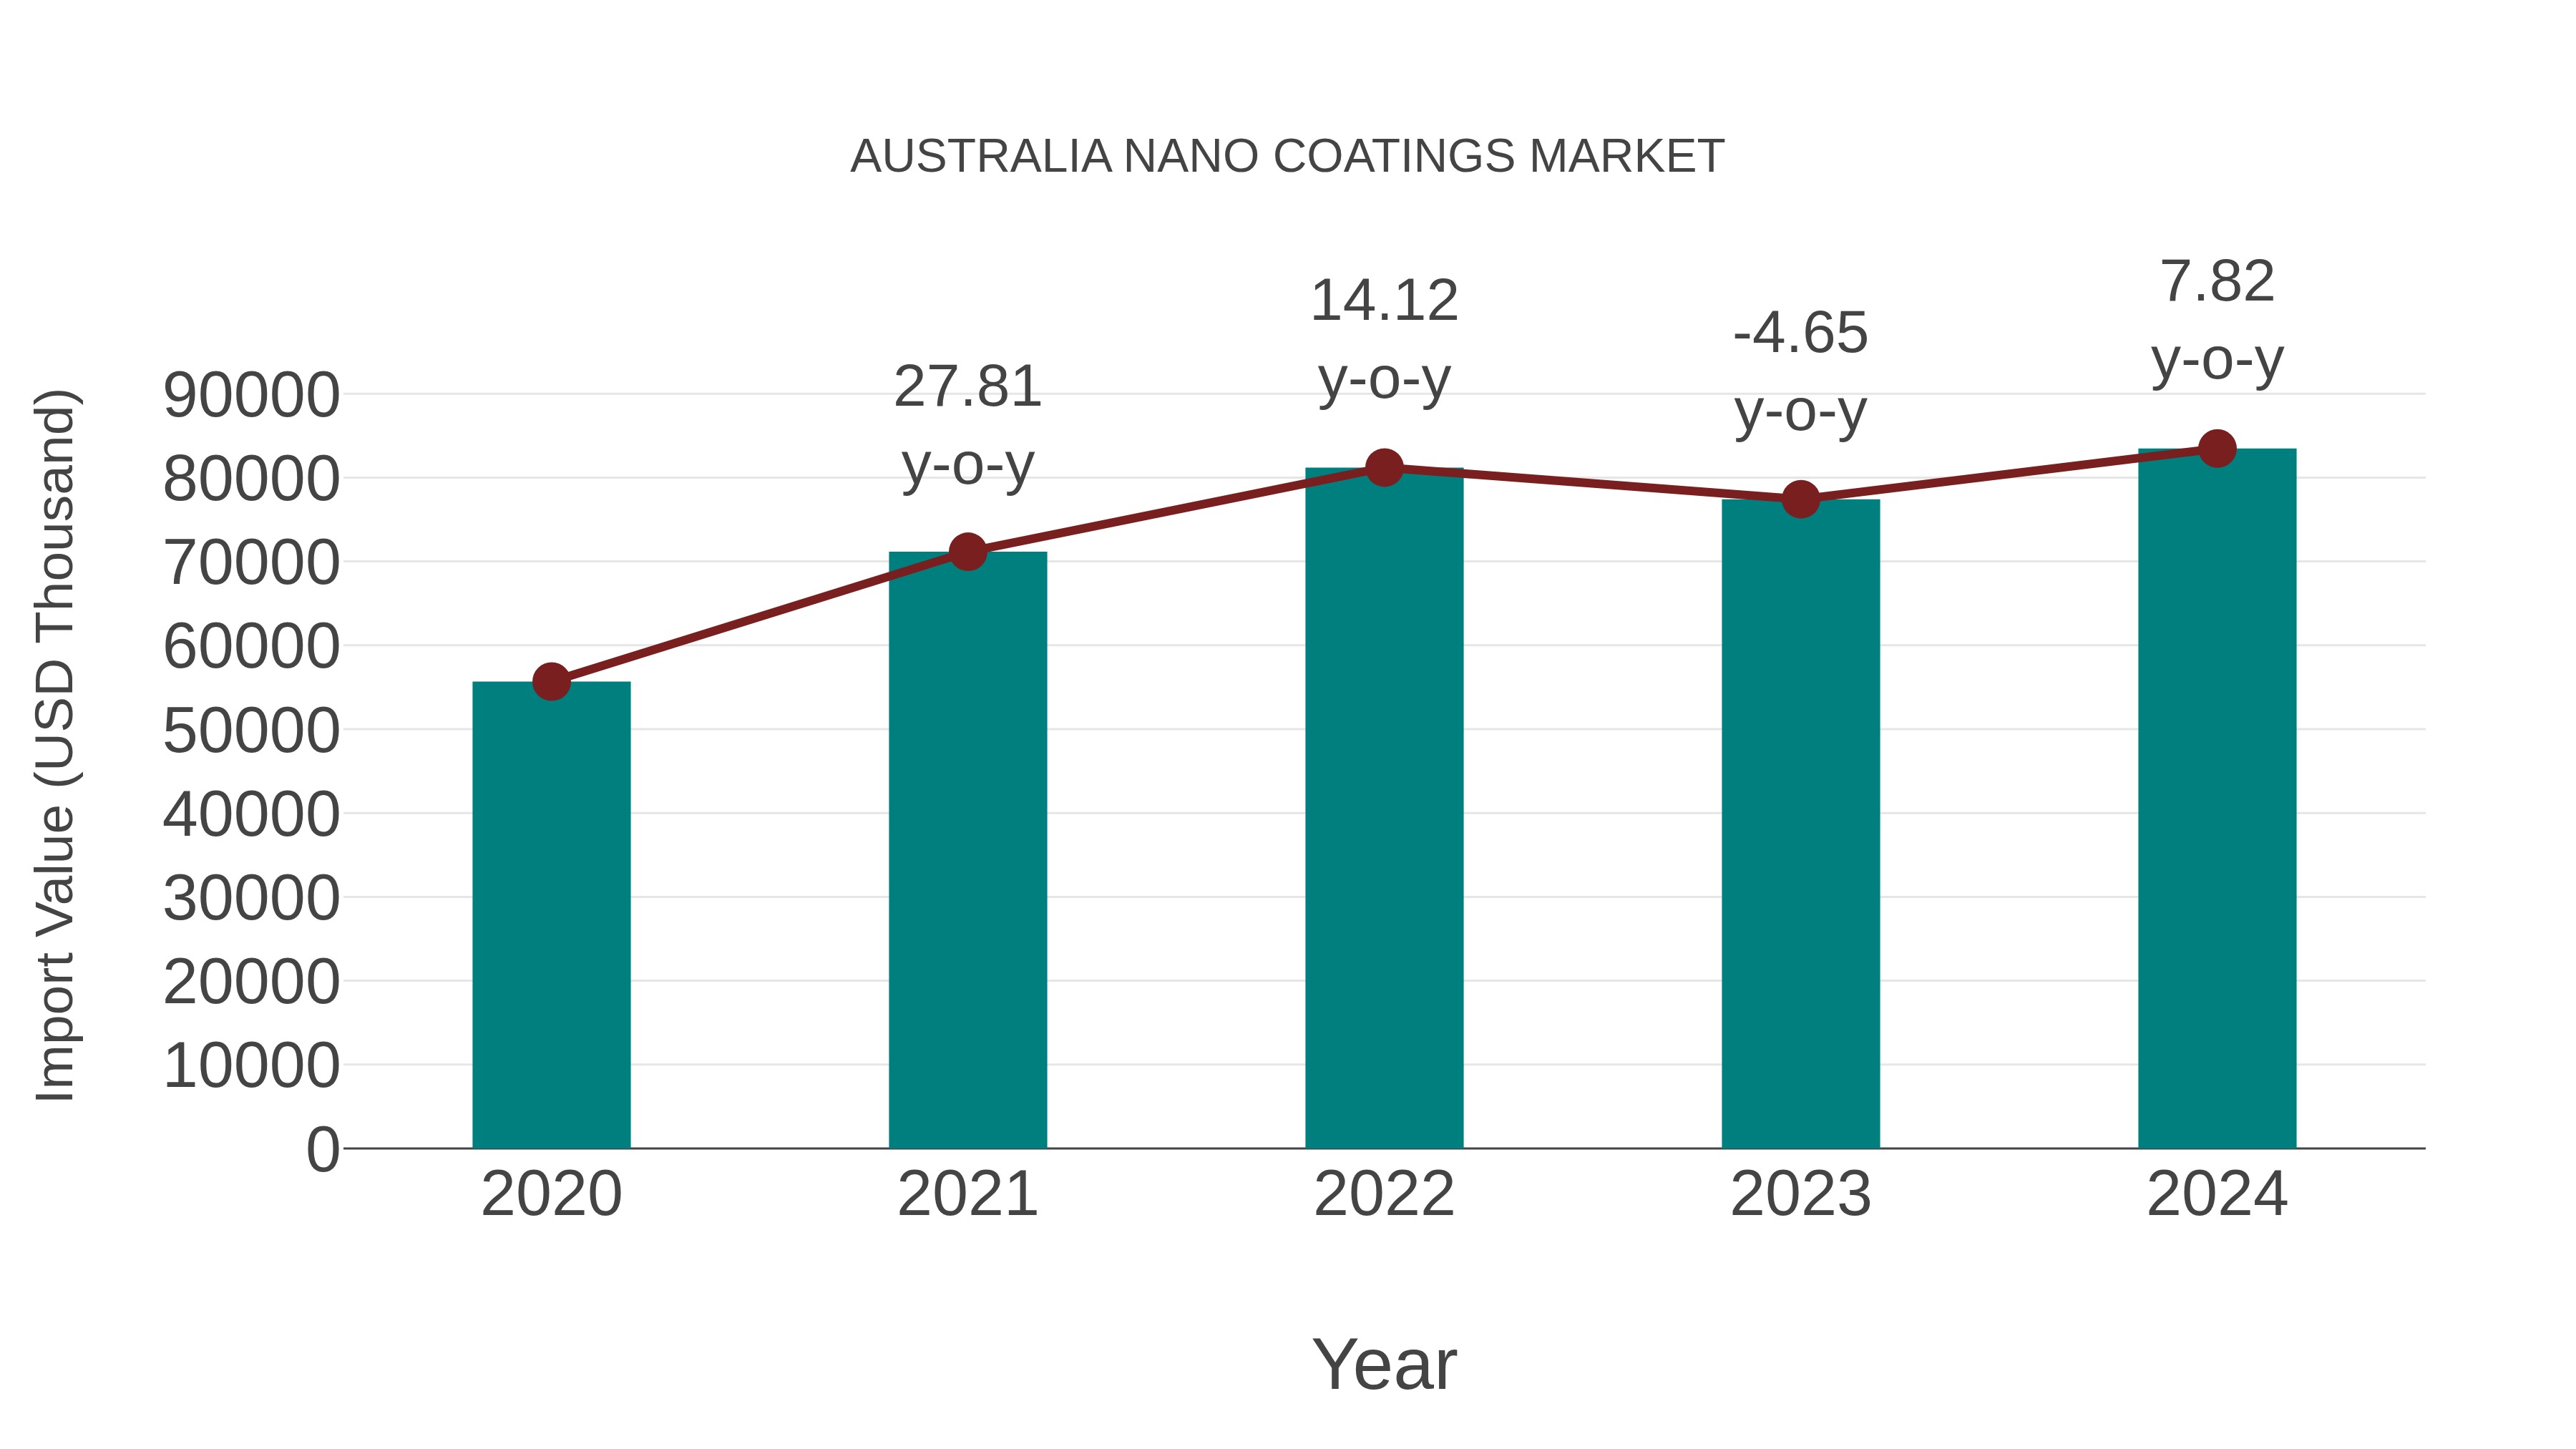
Australia Nano Coatings Market: Import Trend Analysis
Australia`s import trend for the nano coatings market showed a growth rate of 7.82% from 2023 to 2024, with a compound annual growth rate (CAGR) of 10.66% from 2020 to 2024. This upward momentum can be attributed to increasing demand for advanced coating solutions in various industries, driving market stability and fostering trade growth.
Australia Nano Coatings Market Overview
The Australia nano coatings market is experiencing significant growth driven by increasing demand across various industries such as automotive, healthcare, electronics, and construction. Nano coatings offer superior properties including scratch resistance, water repellence, anti-corrosion, and self-cleaning capabilities, making them appealing for a wide range of applications. The market is witnessing a surge in research and development activities to further enhance the performance and applicability of nano coatings. Key players in the industry are focusing on strategic partnerships, product innovation, and expansion of distribution networks to capitalize on the growing market opportunities. Strict environmental regulations and the shift towards sustainable solutions are also influencing the market dynamics, leading to the development of eco-friendly nano coatings. Overall, the Australia nano coatings market is poised for continued expansion as industries increasingly adopt these advanced coatings for improved functionality and durability.
Australia Nano Coatings Market Trends
In Australia, the nano coatings market is experiencing a growing demand due to the increasing focus on sustainability and environmentally friendly solutions across various industries. Manufacturers are developing innovative nano coatings that offer superior protection against corrosion, UV radiation, and wear and tear, driving the market growth. The automotive and construction sectors are particularly adopting nano coatings to enhance the durability and longevity of their products. Additionally, the rising awareness about the benefits of nano coatings in reducing maintenance costs and enhancing energy efficiency is further fueling market expansion. The market is also witnessing a trend towards the development of self-cleaning and anti-bacterial nano coatings to meet the evolving consumer preferences for hygienic and easy-to-maintain surfaces. Overall, the Australia nano coatings market is poised for steady growth in the coming years.
Australia Nano Coatings Market Challenges
In the Australia nano coatings market, some challenges faced include limited awareness and understanding of the benefits of nano coatings among consumers and businesses, leading to slower adoption rates. Additionally, the high cost of production and application of nano coatings can be a barrier for smaller companies looking to enter the market. Regulatory hurdles and environmental concerns regarding the use of nanoparticles in coatings also pose challenges for manufacturers in ensuring compliance and sustainability. Moreover, the lack of standardized testing methods and certification processes for nano coatings can hinder market growth and trust among consumers. Overall, addressing these challenges through education, cost-effective solutions, regulatory compliance, and industry collaboration will be crucial for the sustained growth of the nano coatings market in Australia.
Australia Nano Coatings Market Investment Opportunities
The Australia nano coatings market presents promising investment opportunities due to the increasing demand for advanced coatings in various industries such as automotive, electronics, and healthcare. The growth of the market is driven by the superior properties of nano coatings, including enhanced durability, corrosion resistance, and self-cleaning capabilities. With the rising focus on sustainability and environmental protection, there is a growing preference for eco-friendly nano coatings that reduce energy consumption and improve product longevity. Investors can explore opportunities in developing innovative nano coating technologies, expanding product portfolios, and establishing strategic partnerships with key industry players to capitalize on the market`s growth potential and establish a strong presence in the Australian market.
Australia Nano Coatings Market Government Policy
The Australian government has been supportive of the nano coatings market through various policies aimed at promoting innovation and research in the field. Initiatives such as the National Nanotechnology Strategy and the National Innovation and Science Agenda provide funding and support for companies involved in developing nano coatings technologies. Additionally, regulatory bodies like the Australian Competition and Consumer Commission and the Therapeutic Goods Administration ensure that nano coatings products meet safety standards and are accurately labeled. The government`s focus on sustainability and environmental protection also influences policies related to nano coatings, encouraging the use of eco-friendly and non-toxic materials in product development. Overall, the government`s policies create a conducive environment for growth and advancement in the Australian nano coatings market.
Australia Nano Coatings Market Future Outlook
The future outlook for the Australia nano coatings market appears promising, with steady growth anticipated in the coming years. Factors driving this growth include the increasing demand for advanced and eco-friendly coatings across various industries such as automotive, electronics, construction, and healthcare. Nano coatings offer superior properties like scratch resistance, UV protection, and self-cleaning capabilities, making them attractive for use in a wide range of applications. Additionally, the focus on research and development activities to enhance the performance and durability of nano coatings is expected to further propel market expansion. With a growing emphasis on sustainability and technological advancements, the Australia nano coatings market is poised to witness significant opportunities for innovation and market penetration in the foreseeable future.
Key Highlights of the Report:
- Australia Nano Coatings Market Outlook
- Market Size of Australia Nano Coatings Market,2025
- Forecast of Australia Nano Coatings Market, 2032
- Historical Data and Forecast of Australia Nano Coatings Revenues & Volume for the Period 2022-2032F
- Australia Nano Coatings Market Trend Evolution
- Australia Nano Coatings Market Drivers and Challenges
- Australia Nano Coatings Price Trends
- Australia Nano Coatings Porter's Five Forces
- Australia Nano Coatings Industry Life Cycle
- Historical Data and Forecast of Australia Nano Coatings Market Revenues & Volume By Coating Type for the Period 2022-2032F
- Historical Data and Forecast of Australia Nano Coatings Market Revenues & Volume By Anti-Corrosion Coatings for the Period 2022-2032F
- Historical Data and Forecast of Australia Nano Coatings Market Revenues & Volume By Self-Cleaning Coatings for the Period 2022-2032F
- Historical Data and Forecast of Australia Nano Coatings Market Revenues & Volume By Anti-Fingerprint Coatings for the Period 2022-2032F
- Historical Data and Forecast of Australia Nano Coatings Market Revenues & Volume By Conductive Coatings for the Period 2022-2032F
- Historical Data and Forecast of Australia Nano Coatings Market Revenues & Volume By Anti-Microbial Coatings for the Period 2022-2032F
- Historical Data and Forecast of Australia Nano Coatings Market Revenues & Volume By Material for the Period 2022-2032F
- Historical Data and Forecast of Australia Nano Coatings Market Revenues & Volume By Metal Oxides for the Period 2022-2032F
- Historical Data and Forecast of Australia Nano Coatings Market Revenues & Volume By Titanium Dioxide for the Period 2022-2032F
- Historical Data and Forecast of Australia Nano Coatings Market Revenues & Volume By Nano-Silica for the Period 2022-2032F
- Historical Data and Forecast of Australia Nano Coatings Market Revenues & Volume By Carbon Nanotubes for the Period 2022-2032F
- Historical Data and Forecast of Australia Nano Coatings Market Revenues & Volume By Silver Nanoparticles for the Period 2022-2032F
- Historical Data and Forecast of Australia Nano Coatings Market Revenues & Volume By Application for the Period 2022-2032F
- Historical Data and Forecast of Australia Nano Coatings Market Revenues & Volume By Automotive for the Period 2022-2032F
- Historical Data and Forecast of Australia Nano Coatings Market Revenues & Volume By Construction for the Period 2022-2032F
- Historical Data and Forecast of Australia Nano Coatings Market Revenues & Volume By Electronics for the Period 2022-2032F
- Historical Data and Forecast of Australia Nano Coatings Market Revenues & Volume By Aerospace for the Period 2022-2032F
- Historical Data and Forecast of Australia Nano Coatings Market Revenues & Volume By Medical Devices for the Period 2022-2032F
- Historical Data and Forecast of Australia Nano Coatings Market Revenues & Volume By Form for the Period 2022-2032F
- Historical Data and Forecast of Australia Nano Coatings Market Revenues & Volume By Liquid for the Period 2022-2032F
- Historical Data and Forecast of Australia Nano Coatings Market Revenues & Volume By Spray for the Period 2022-2032F
- Historical Data and Forecast of Australia Nano Coatings Market Revenues & Volume By Thin Film for the Period 2022-2032F
- Historical Data and Forecast of Australia Nano Coatings Market Revenues & Volume By Powder for the Period 2022-2032F
- Historical Data and Forecast of Australia Nano Coatings Market Revenues & Volume By Paste for the Period 2022-2032F
- Historical Data and Forecast of Australia Nano Coatings Market Revenues & Volume By Substrate for the Period 2022-2032F
- Historical Data and Forecast of Australia Nano Coatings Market Revenues & Volume By Metal for the Period 2022-2032F
- Historical Data and Forecast of Australia Nano Coatings Market Revenues & Volume By Glass for the Period 2022-2032F
- Historical Data and Forecast of Australia Nano Coatings Market Revenues & Volume By Plastic for the Period 2022-2032F
- Historical Data and Forecast of Australia Nano Coatings Market Revenues & Volume By Ceramics for the Period 2022-2032F
- Historical Data and Forecast of Australia Nano Coatings Market Revenues & Volume By Polymers for the Period 2022-2032F
- Australia Nano Coatings Import Export Trade Statistics
- Market Opportunity Assessment By Coating Type
- Market Opportunity Assessment By Material
- Market Opportunity Assessment By Application
- Market Opportunity Assessment By Form
- Market Opportunity Assessment By Substrate
- Australia Nano Coatings Top Companies Market Share
- Australia Nano Coatings Competitive Benchmarking By Technical and Operational Parameters
- Australia Nano Coatings Company Profiles
- Australia Nano Coatings Key Strategic Recommendations
Australia Nano Coatings Market (2026-2032): FAQs
6Wresearch actively monitors the Australia Nano Coatings Market and publishes its comprehensive annual report, highlighting emerging trends, growth drivers, revenue analysis, and forecast outlook. Our insights help businesses to make data-backed strategic decisions with ongoing market dynamics. Our analysts track relevent industries related to the Australia Nano Coatings Market, allowing our clients with actionable intelligence and reliable forecasts tailored to emerging regional needs.
Yes, we provide customisation as per your requirements. To learn more, feel free to contact us on sales@6wresearch.com
1 Executive Summary |
2 Introduction |
2.1 Key Highlights of the Report |
2.2 Report Description |
2.3 Market Scope & Segmentation |
2.4 Research Methodology |
2.5 Assumptions |
3 Australia Nano Coatings Market Overview |
3.1 Australia Country Macro Economic Indicators |
3.2 Australia Nano Coatings Market Revenues & Volume, 2022 & 2032F |
3.3 Australia Nano Coatings Market - Industry Life Cycle |
3.4 Australia Nano Coatings Market - Porter's Five Forces |
3.5 Australia Nano Coatings Market Revenues & Volume Share, By Coating Type, 2022 & 2032F |
3.6 Australia Nano Coatings Market Revenues & Volume Share, By Material, 2022 & 2032F |
3.7 Australia Nano Coatings Market Revenues & Volume Share, By Application, 2022 & 2032F |
3.8 Australia Nano Coatings Market Revenues & Volume Share, By Form, 2022 & 2032F |
3.9 Australia Nano Coatings Market Revenues & Volume Share, By Substrate, 2022 & 2032F |
4 Australia Nano Coatings Market Dynamics |
4.1 Impact Analysis |
4.2 Market Drivers |
4.2.1 Increasing demand for eco-friendly and sustainable coatings solutions |
4.2.2 Growth in the construction and automotive industries in Australia |
4.2.3 Rising awareness about the benefits of nano coatings in various applications |
4.3 Market Restraints |
4.3.1 High cost associated with nano coatings technology |
4.3.2 Limited adoption due to lack of standardized regulations and guidelines |
4.3.3 Potential health and environmental concerns related to nano materials |
5 Australia Nano Coatings Market Trends |
6 Australia Nano Coatings Market, By Types |
6.1 Australia Nano Coatings Market, By Coating Type |
6.1.1 Overview and Analysis |
6.1.2 Australia Nano Coatings Market Revenues & Volume, By Coating Type, 2022-2032F |
6.1.3 Australia Nano Coatings Market Revenues & Volume, By Anti-Corrosion Coatings, 2022-2032F |
6.1.4 Australia Nano Coatings Market Revenues & Volume, By Self-Cleaning Coatings, 2022-2032F |
6.1.5 Australia Nano Coatings Market Revenues & Volume, By Anti-Fingerprint Coatings, 2022-2032F |
6.1.6 Australia Nano Coatings Market Revenues & Volume, By Conductive Coatings, 2022-2032F |
6.1.7 Australia Nano Coatings Market Revenues & Volume, By Anti-Microbial Coatings, 2022-2032F |
6.2 Australia Nano Coatings Market, By Material |
6.2.1 Overview and Analysis |
6.2.2 Australia Nano Coatings Market Revenues & Volume, By Metal Oxides, 2022-2032F |
6.2.3 Australia Nano Coatings Market Revenues & Volume, By Titanium Dioxide, 2022-2032F |
6.2.4 Australia Nano Coatings Market Revenues & Volume, By Nano-Silica, 2022-2032F |
6.2.5 Australia Nano Coatings Market Revenues & Volume, By Carbon Nanotubes, 2022-2032F |
6.2.6 Australia Nano Coatings Market Revenues & Volume, By Silver Nanoparticles, 2022-2032F |
6.3 Australia Nano Coatings Market, By Application |
6.3.1 Overview and Analysis |
6.3.2 Australia Nano Coatings Market Revenues & Volume, By Automotive, 2022-2032F |
6.3.3 Australia Nano Coatings Market Revenues & Volume, By Construction, 2022-2032F |
6.3.4 Australia Nano Coatings Market Revenues & Volume, By Electronics, 2022-2032F |
6.3.5 Australia Nano Coatings Market Revenues & Volume, By Aerospace, 2022-2032F |
6.3.6 Australia Nano Coatings Market Revenues & Volume, By Medical Devices, 2022-2032F |
6.4 Australia Nano Coatings Market, By Form |
6.4.1 Overview and Analysis |
6.4.2 Australia Nano Coatings Market Revenues & Volume, By Liquid, 2022-2032F |
6.4.3 Australia Nano Coatings Market Revenues & Volume, By Spray, 2022-2032F |
6.4.4 Australia Nano Coatings Market Revenues & Volume, By Thin Film, 2022-2032F |
6.4.5 Australia Nano Coatings Market Revenues & Volume, By Powder, 2022-2032F |
6.4.6 Australia Nano Coatings Market Revenues & Volume, By Paste, 2022-2032F |
6.5 Australia Nano Coatings Market, By Substrate |
6.5.1 Overview and Analysis |
6.5.2 Australia Nano Coatings Market Revenues & Volume, By Metal, 2022-2032F |
6.5.3 Australia Nano Coatings Market Revenues & Volume, By Glass, 2022-2032F |
6.5.4 Australia Nano Coatings Market Revenues & Volume, By Plastic, 2022-2032F |
6.5.5 Australia Nano Coatings Market Revenues & Volume, By Ceramics, 2022-2032F |
6.5.6 Australia Nano Coatings Market Revenues & Volume, By Polymers, 2022-2032F |
7 Australia Nano Coatings Market Import-Export Trade Statistics |
7.1 Australia Nano Coatings Market Export to Major Countries |
7.2 Australia Nano Coatings Market Imports from Major Countries |
8 Australia Nano Coatings Market Key Performance Indicators |
8.1 Research and development investment in nano coatings technology |
8.2 Number of patents filed for nano coatings innovations |
8.3 Environmental impact assessments for nano coatings applications |
8.4 Adoption rate of nano coatings in key industries |
8.5 Number of partnerships and collaborations for nano coatings development |
9 Australia Nano Coatings Market - Opportunity Assessment |
9.1 Australia Nano Coatings Market Opportunity Assessment, By Coating Type, 2022 & 2032F |
9.2 Australia Nano Coatings Market Opportunity Assessment, By Material, 2022 & 2032F |
9.3 Australia Nano Coatings Market Opportunity Assessment, By Application, 2022 & 2032F |
9.4 Australia Nano Coatings Market Opportunity Assessment, By Form, 2022 & 2032F |
9.5 Australia Nano Coatings Market Opportunity Assessment, By Substrate, 2022 & 2032F |
10 Australia Nano Coatings Market - Competitive Landscape |
10.1 Australia Nano Coatings Market Revenue Share, By Companies, 2025 |
10.2 Australia Nano Coatings Market Competitive Benchmarking, By Operating and Technical Parameters |
11 Company Profiles |
12 Recommendations |
13 Disclaimer |
Global Go To Market Strategy - 2030
Export potential enables firms to identify high-growth global markets with greater confidence by combining advanced trade intelligence with a structured quantitative methodology. The framework analyzes emerging demand trends and country-level import patterns while integrating macroeconomic and trade datasets such as GDP and population forecasts, bilateral import–export flows, tariff structures, elasticity differentials between developed and developing economies, geographic distance, and import demand projections. Using weighted trade values from 2020–2024 as the base period to project country-to-country export potential for 2030, these inputs are operationalized through calculated drivers such as gravity model parameters, tariff impact factors, and projected GDP per-capita growth. Through an analysis of hidden potentials, demand hotspots, and market conditions that are most favorable to success, this method enables firms to focus on target countries, maximize returns, and global expansion with data, backed by accuracy.
By factoring in the projected importer demand gap that is currently unmet and could be potential opportunity, it identifies the potential for the Exporter (Country) among 190 countries, against the general trade analysis, which identifies the biggest importer or exporter.
To discover high-growth global markets and optimize your business strategy:
Click Here
Pricing
- Single User License$ 1,995
- Department License$ 2,400
- Site License$ 3,120
- Global License$ 3,795

Leadership Perspectives from Industry Events
Search
Thought Leadership and Analyst Meet


Our Clients
6WResearch In News
- India Export Attractiveness Tracker 2026
- India Air Conditioner Market Set for Strong Rebound in 2026 After Weather-Led Correction and GST-Driven Recovery: 6Wresearch
- ADAS in India: How Automatic Emergency Braking, Blind Spot Detection & Driver Monitoring are Transforming Road Safety
- Doha a strategic location for EV manufacturing hub: IPA Qatar
- Demand for luxury TVs surging in the GCC, says Samsung
- Empowering Growth: The Thriving Journey of Bangladesh’s Cable Industry
Latest Reports
- Nicaragua RPG Gaming Market (2026-2032)
- New Zealand RPG Gaming Market (2026-2032)
- Netherlands RPG Gaming Market (2026-2032)
- Nauru RPG Gaming Market (2026-2032)
- Namibia RPG Gaming Market (2026-2032)
- Mozambique RPG Gaming Market (2026-2032)
- Montenegro RPG Gaming Market (2026-2032)
- Mongolia RPG Gaming Market (2026-2032)
- Monaco RPG Gaming Market (2026-2032)
- Micronesia RPG Gaming Market (2026-2032)
Industry Events and Analyst Meet

EV India Expo 2026

HIMTEX 2026

India Refining Summit 2026

India EV Show 2026

EV tech India Expo 2026
Whitepaper
- Middle East & Africa Commercial Security Market Click here to view more.
- Middle East & Africa Fire Safety Systems & Equipment Market Click here to view more.
- GCC Drone Market Click here to view more.
- Middle East Lighting Fixture Market Click here to view more.
- GCC Physical & Perimeter Security Market Click here to view more.