Australia Neon Gas Market (2026-2032) Outlook | Industry, Analysis, Size, Forecast, Value, Companies, Growth, Trends, Revenue & Share
Market Forecast By Type (Low, High, Ultra High), By Application (Semiconductor, LCD, Imaging and Lighting, Refrigerator, Laser, Medical, Others) And Competitive Landscape
| Product Code: ETC094854 | Publication Date: Jun 2021 | Updated Date: Jun 2026 | Product Type: Report | |
| Publisher: 6Wresearch | Author: Ravi Bhandari | No. of Pages: 70 | No. of Figures: 35 | No. of Tables: 5 |
Australia Neon Gas Market Size, Share & Growth Rate
The Australia Neon Gas Market was estimated at USD 82 Million in 2025 and is projected to reach USD 96 Million by 2032, growing at a CAGR of 2.3% from 2026 to 2032. This growth trajectory is bolstered by rising demand in diverse sectors such as lighting and electronics, where neon gas is vital for high-performance applications. Additionally, the increasing focus on energy-efficient lighting solutions and advancements in semiconductor technologies further fuel the market expansion.
Australia Neon Gas Market Growth Rate Analysis (2021-2032)
The Australian neon gas market faced a notable downturn in 2021, contracting by 1.0%, primarily due to impacts from the pandemic and reduced industrial activities. However, recovery commenced in 2022 with a robust growth rate of 5.9%, fueled by increasing demand from the electronics sector and advancements in display technologies, which require high-quality neon for specific applications. This upward trend continued into 2023, with a growth rate of 4.6%, as heightened consumer demand for LED and laser technologies spurred investments in production capabilities. Forecasts indicate gradual growth through 2032, maintaining an average increase of 2.4% to 3.0%. This sustained growth reflects ongoing infrastructure developments and a shift towards energy-efficient technologies.
Australia Neon Gas Market Year-wise Growth Rate and Key Drivers
This graph highlights how the Australia Neon Gas Market has steadily grown over the past five years, supported by major growth factors.
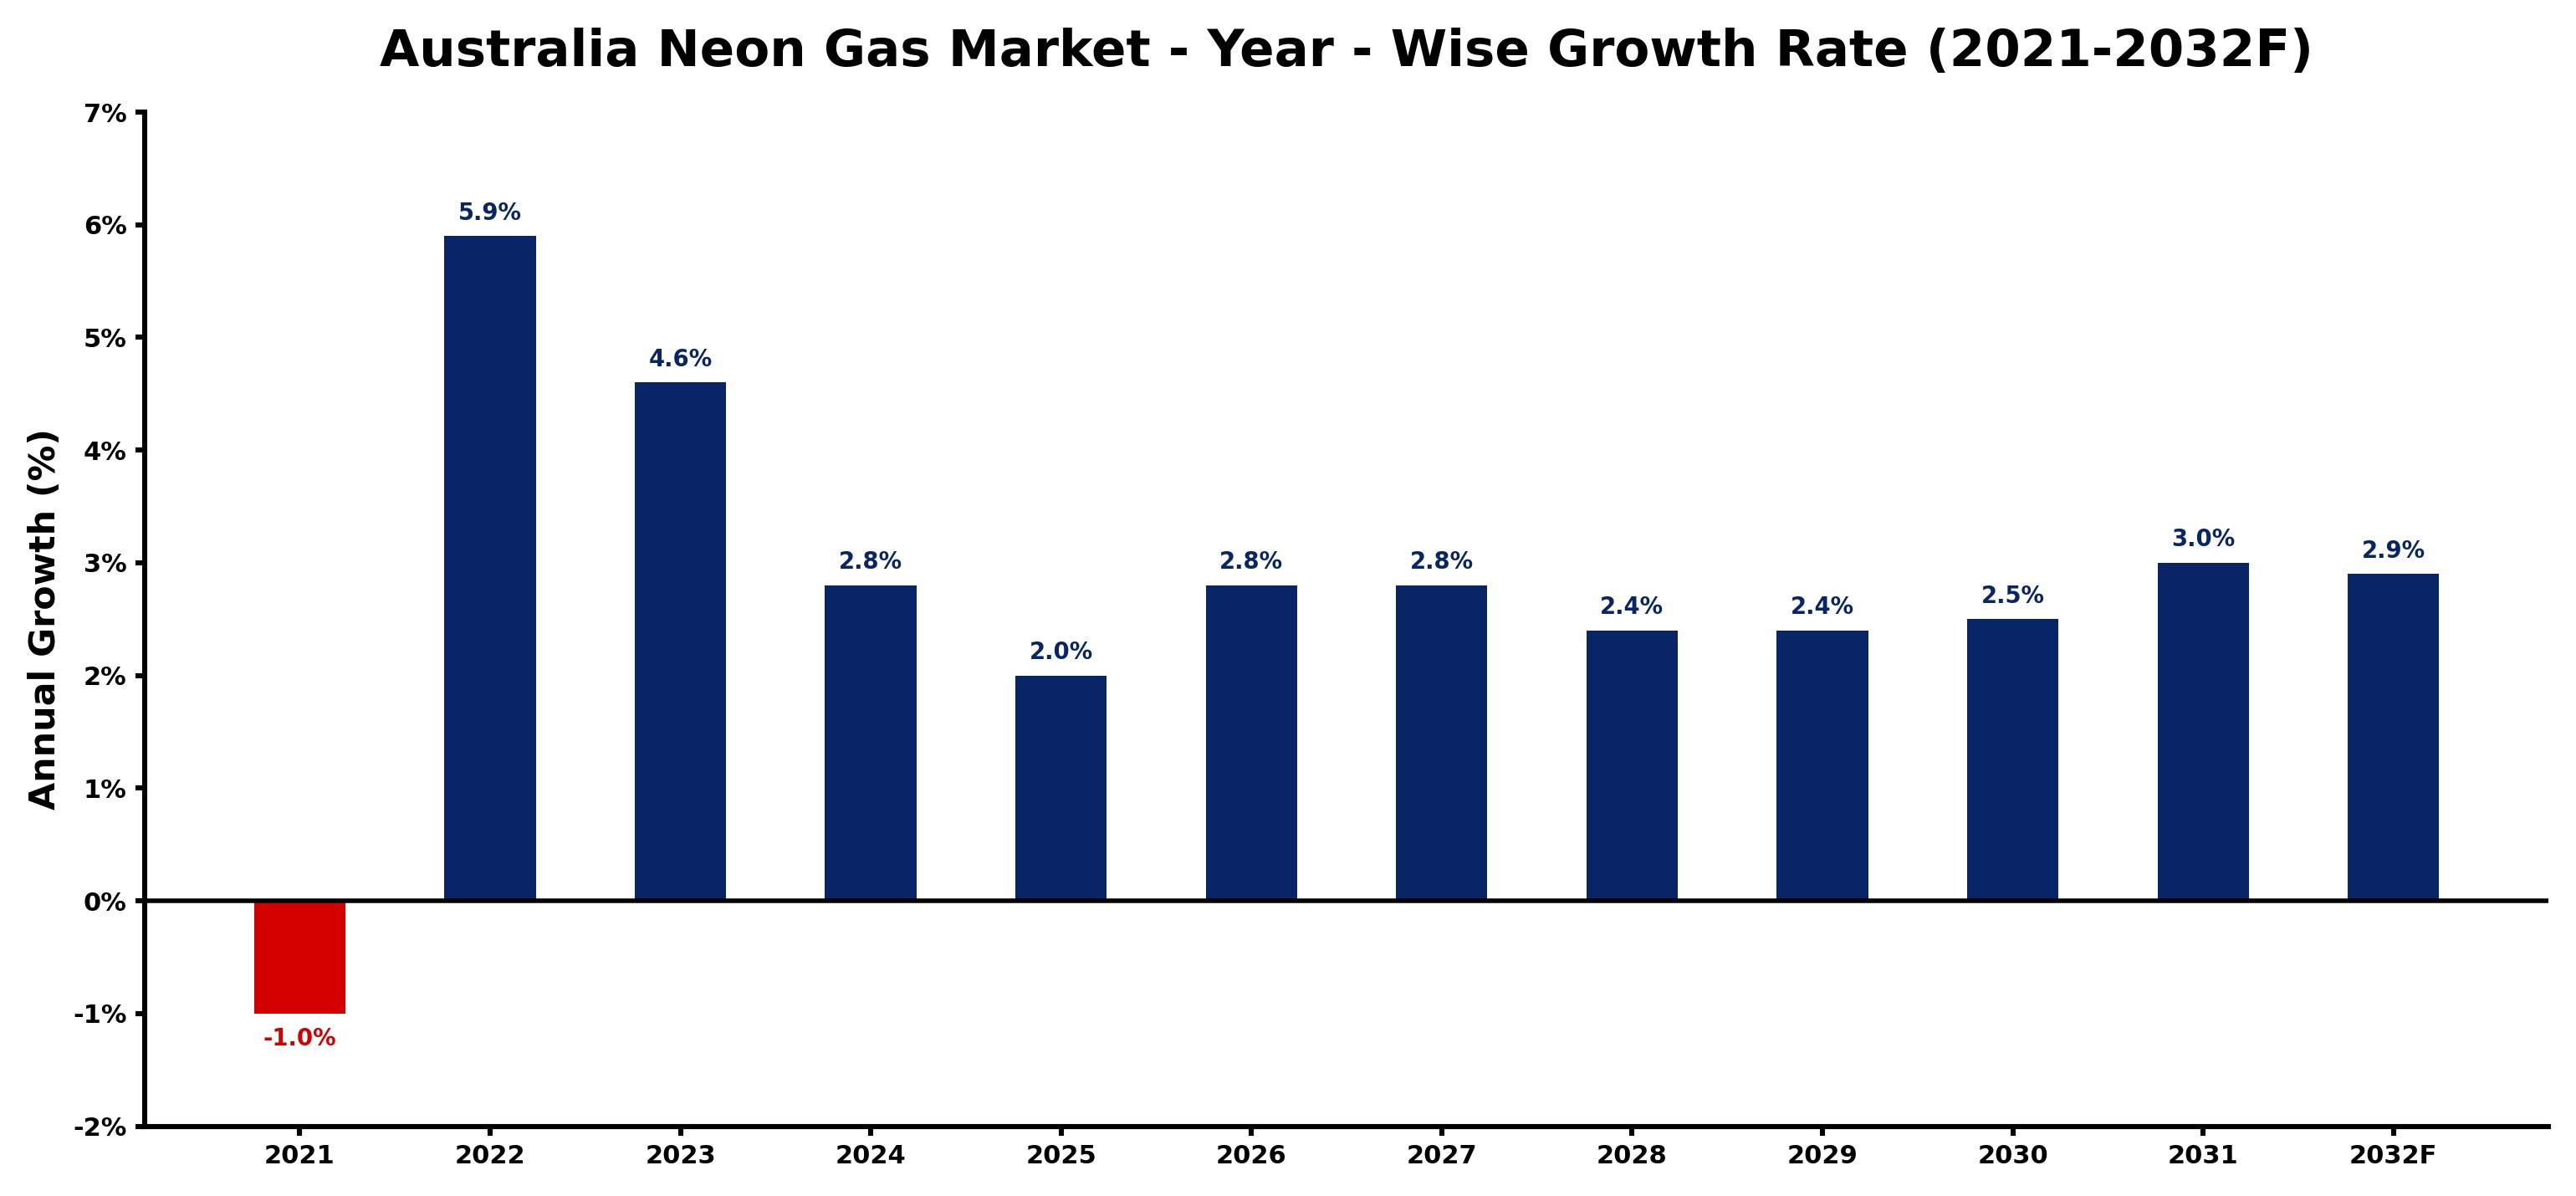
The table below presents the year‑wise growth rates along with the key drivers influencing the market
| Year | Growth Rate | Major Drivers |
| 2021 | -1.0% | Weak mining sector demand lowered neon gas procurement levels |
| 2022 | 5.9% | Mining sector automation drives demand for advanced neon gas solutions |
| 2023 | 4.6% | Mining sector investments boost neon gas consumption for maintenance |
| 2024 | 2.8% | Increased mining equipment upgrades boost neon gas consumption rates |
| 2025 | 2.0% | Mining sector expansion drives demand for neon gas applications |
| 2026 | 2.8% | Export driven mining sector growth boosted neon gas consumption |
| 2027 | 2.8% | Automation in mining operations boosted neon gas consumption rates |
| 2028 | 2.4% | Mining sector expansions drive increased neon gas consumption rates |
| 2029 | 2.4% | Advanced manufacturing investments boost demand for specialized neon applications |
| 2030 | 2.5% | Mining sector modernization drives neon gas demand for applications |
| 2031 | 3.0% | Mining sector innovation boosts neon gas utilization for applications |
| 2032 | 2.9% | Mining sector upgrades prompted higher neon gas consumption levels |
Note - Market size estimations and growth projections presented in this report are based on 6Wresearch’s advanced forecasting approach, validated with industry datasets as of June 2026.
Australia Neon Gas Market Synopsis
In Australia, neon gas is prominently utilized in various lighting applications, particularly in vibrant signage and display technologies. Its unique properties make it invaluable for producing bright, colorful lights that stand out, especially in urban settings. The semiconductor industry also heavily relies on neon gas, which is integral to the manufacturing of chips, a cornerstone of modern electronics.
However, the Australian market faces challenges primarily due to minimal domestic production, resulting in a dependency on imports. This reliance makes the market vulnerable to global supply fluctuations, especially given the geopolitical tensions affecting major suppliers like Ukraine and China. Consequently, maintaining a stable supply chain becomes critical for sustained growth.
Australia Neon Gas Market Key Takeaways
- Demand for neon gas is driven by its essential applications in signage, electronics, and laser technology.
- The market's growth is supported by increasing investments in semiconductor manufacturing processes.
- Australia's dependency on imports poses risks associated with global supply chain dynamics.
- Investment opportunities exist in establishing local production and enhancing storage capacities.
- Government regulations play a significant role in ensuring safety and compliance within the market.
Evaluation of Restraints in Australia Neon Gas Market
The neon gas market in Australia is significantly restrained by its limited domestic production capabilities, which leads to a heavy reliance on imports. This dependence not only makes the market vulnerable to international supply chain disruptions but also subjects it to pricing volatility stemming from global market dynamics. Geopolitical tensions, particularly affecting key suppliers, further exacerbate the situation, hindering market stability. Moreover, fluctuations in semiconductor demand, where neon gas is a critical input, introduce additional uncertainty into the market, complicating investment decisions for stakeholders.
Australia Neon Gas Market Trends
Currently, the Australian neon gas market is witnessing a shift towards energy-efficient lighting solutions, with businesses increasingly adopting neon technologies that offer higher brightness and lower energy consumption. This trend aligns with broader sustainability goals across industries, promoting innovations in neon gas applications. Additionally, advancements in semiconductor manufacturing technologies are anticipated to drive increased demand for neon gas, further intertwining the two sectors.
Australia Neon Gas Market Opportunities
The prospects for growth within the Australia neon gas market are promising, particularly in areas such as local production and the development of advanced storage solutions. Investors have the opportunity to establish production facilities that could reduce reliance on imports, thereby mitigating supply risks. Furthermore, focusing on emerging industries like semiconductor manufacturing presents a lucrative avenue for investment, given the crucial role of neon gas in this sector.
Government Initiatives in the Australia Neon Gas Market
The Australian government actively regulates the neon gas market through strict industrial gas regulations aimed at ensuring safe handling, storage, and transportation. Policies are designed to enforce compliance with workplace safety standards, thereby protecting both workers and the environment. Additionally, trade regulations are in place to monitor the import and export of neon gas, supporting a stable supply chain while meeting global demand effectively.
Future Insights of the Australia Neon Gas Market
Looking ahead to 2026-2032, the Australia neon gas market is poised for measured growth driven by the ongoing demand for neon in high-tech applications and innovative lighting solutions. As industries increasingly transition to energy-efficient technologies, the market is likely to adapt, focusing on sustainable practices and local production capabilities. The semiconductor sector's resilience and expansion will further catalyze demand, providing a robust foundation for the future landscape of the market.
Australia Neon Gas Market Latest Developments (May 2025 - June 2026)
Recent trends indicate a proactive approach among industry stakeholders aiming to enhance supply chain resilience in the Australia neon gas market. There has been a notable emphasis on improving import logistics and fostering partnerships that could stabilize supplies. Concurrently, innovations in neon gas applications, particularly within energy-efficient lighting and advanced semiconductor processes, are gaining traction as industries adapt to technological advancements.
Australia Neon Gas Market - Key Attractiveness of the Report
- 10 Years of Market Numbers
- Historical Data Starting from 2022 to 2025
- Base Year: 2025
- Forecast Data until 2032
- Key Performance Indicators Impacting the Market
- Major Upcoming Developments and Projects
Key Highlights of the Report:
- Australia Neon Gas Market Outlook
- Market Size of Australia Neon Gas Market, 2025
- Forecast of Australia Neon Gas Market, 2032
- Historical Data and Forecast of Australia Neon Gas Revenues & Volume for the Period 2022-2032F
- Australia Neon Gas Market Trend Evolution
- Australia Neon Gas Market Drivers and Challenges
- Australia Neon Gas Price Trends
- Australia Neon Gas Porter's Five Forces
- Australia Neon Gas Industry Life Cycle
- Historical Data and Forecast of Australia Neon Gas Market Revenues & Volume By Type for the Period 2022-2032F
- Historical Data and Forecast of Australia Neon Gas Market Revenues & Volume By Low for the Period 2022-2032F
- Historical Data and Forecast of Australia Neon Gas Market Revenues & Volume By High for the Period 2022-2032F
- Historical Data and Forecast of Australia Neon Gas Market Revenues & Volume By Ultra High for the Period 2022-2032F
- Historical Data and Forecast of Australia Neon Gas Market Revenues & Volume By Application for the Period 2022-2032F
- Historical Data and Forecast of Australia Neon Gas Market Revenues & Volume By Semiconductor for the Period 2022-2032F
- Historical Data and Forecast of Australia Neon Gas Market Revenues & Volume By LCD for the Period 2022-2032F
- Historical Data and Forecast of Australia Neon Gas Market Revenues & Volume By Imaging and Lighting for the Period 2022-2032F
- Historical Data and Forecast of Australia Neon Gas Market Revenues & Volume By Refrigerator for the Period 2022-2032F
- Historical Data and Forecast of Australia Neon Gas Market Revenues & Volume By Laser for the Period 2022-2032F
- Historical Data and Forecast of Australia Neon Gas Market Revenues & Volume By Medical for the Period 2022-2032F
- Historical Data and Forecast of Australia Neon Gas Market Revenues & Volume By Others for the Period 2022-2032F
- Australia Neon Gas Import Export Trade Statistics
- Market Opportunity Assessment By Type
- Market Opportunity Assessment By Application
- Australia Neon Gas Top Companies Market Share
- Australia Neon Gas Competitive Benchmarking By Technical and Operational Parameters
- Australia Neon Gas Company Profiles
- Australia Neon Gas Key Strategic Recommendations
Australia Neon Gas Market - Frequently Asked Questions
The demand for neon gas in Australia is primarily driven by its critical applications in signage, electronics, and the rapidly evolving semiconductor manufacturing industry. As technology continues to advance, the necessity for high-quality neon products grows.
The Australia Neon Gas Market was estimated at USD 82 Million in 2025, and it is projected to reach USD 96 Million by 2032, growing at a CAGR of 2.3% from 2026 to 2032. This growth reflects robust demand across several critical industries.
Geopolitical tensions, particularly involving major neon-producing countries, can significantly disrupt the supply chain for Australia's neon gas market. Such instability can lead to supply shortages and price fluctuations, making the market vulnerable to external factors.
Government regulations are crucial in the Australia neon gas market, enforcing safety standards for handling, storage, and transportation. These regulations are designed to protect workers and the environment while ensuring compliance with global safety norms.
There are significant investment opportunities in the Australia neon gas sector, particularly in establishing local production facilities and enhancing storage capabilities. As the semiconductor industry grows, focusing on improving supply chain resilience will also be advantageous.
6Wresearch actively monitors the Australia Neon Gas Market and publishes its comprehensive annual report, highlighting emerging trends, growth drivers, revenue analysis, and forecast outlook. Our insights help businesses to make data-backed strategic decisions with ongoing market dynamics. Our analysts track relevent industries related to the Australia Neon Gas Market, allowing our clients with actionable intelligence and reliable forecasts tailored to emerging regional needs.
Yes, we provide customisation as per your requirements. To learn more, feel free to contact us on sales@6wresearch.com
1 Executive Summary |
2 Introduction |
2.1 Key Highlights of the Report |
2.2 Report Description |
2.3 Market Scope & Segmentation |
2.4 Research Methodology |
2.5 Assumptions |
3 Australia Neon Gas Market Overview |
3.1 Australia Country Macro Economic Indicators |
3.2 Australia Neon Gas Market Revenues & Volume, 2022 & 2032F |
3.3 Australia Neon Gas Market - Industry Life Cycle |
3.4 Australia Neon Gas Market - Porter's Five Forces |
3.5 Australia Neon Gas Market Revenues & Volume Share, By Type, 2022 & 2032F |
3.6 Australia Neon Gas Market Revenues & Volume Share, By Form, 2022 & 2032F |
4 Australia Neon Gas Market Dynamics |
4.1 Impact Analysis |
4.2 Market Drivers |
4.2.1 Growing demand for neon gas in the healthcare sector for medical imaging and lighting applications |
4.2.2 Increasing use of neon gas in the electronics industry for manufacturing semiconductors and plasma displays |
4.2.3 Rising adoption of neon gas in the automotive industry for neon lighting and signage |
4.3 Market Restraints |
4.3.1 Fluctuating prices of neon gas due to supply chain disruptions and geopolitical factors |
4.3.2 Availability of alternative gases like LED lighting reducing the demand for neon gas |
4.3.3 Stringent regulations regarding the use and disposal of neon gas impacting market growth |
5 Australia Neon Gas Market Trends |
6 Australia Neon Gas Market, By Types |
6.1 Australia Neon Gas Market, By Type |
6.1.1 Overview and Analysis |
6.1.2 Australia Neon Gas Market Revenues & Volume, By Type, 2022-2032F |
6.1.3 Australia Neon Gas Market Revenues & Volume, By Low, 2022-2032F |
6.1.4 Australia Neon Gas Market Revenues & Volume, By High, 2022-2032F |
6.1.5 Australia Neon Gas Market Revenues & Volume, By Ultra High, 2022-2032F |
6.2 Australia Neon Gas Market, By Application |
6.2.1 Overview and Analysis |
6.2.2 Australia Neon Gas Market Revenues & Volume, By Semiconductor, 2022-2032F |
6.2.3 Australia Neon Gas Market Revenues & Volume, By LCD, 2022-2032F |
6.2.4 Australia Neon Gas Market Revenues & Volume, By Imaging and Lighting, 2022-2032F |
6.2.5 Australia Neon Gas Market Revenues & Volume, By Refrigerator, 2022-2032F |
6.2.6 Australia Neon Gas Market Revenues & Volume, By Laser, 2022-2032F |
6.2.7 Australia Neon Gas Market Revenues & Volume, By Medical, 2022-2032F |
7 Australia Neon Gas Market Import-Export Trade Statistics |
7.1 Australia Neon Gas Market Export to Major Countries |
7.2 Australia Neon Gas Market Imports from Major Countries |
8 Australia Neon Gas Market Key Performance Indicators |
8.1 Adoption rate of neon gas in emerging industries |
8.2 Investment in research and development for neon gas applications |
8.3 Number of patents filed for neon gas technologies |
8.4 Environmental impact assessment of neon gas usage |
8.5 Rate of innovation in neon gas production technologies |
9 Australia Neon Gas Market - Opportunity Assessment |
9.1 Australia Neon Gas Market Opportunity Assessment, By Type, 2022 & 2032F |
9.2 Australia Neon Gas Market Opportunity Assessment, By Application, 2022 & 2032F |
10 Australia Neon Gas Market - Competitive Landscape |
10.1 Australia Neon Gas Market Revenue Share, By Companies, 2025 |
10.2 Australia Neon Gas Market Competitive Benchmarking, By Operating and Technical Parameters |
11 Company Profiles |
12 Recommendations |
13 Disclaimer |
Global Go To Market Strategy - 2030
Export potential enables firms to identify high-growth global markets with greater confidence by combining advanced trade intelligence with a structured quantitative methodology. The framework analyzes emerging demand trends and country-level import patterns while integrating macroeconomic and trade datasets such as GDP and population forecasts, bilateral import–export flows, tariff structures, elasticity differentials between developed and developing economies, geographic distance, and import demand projections. Using weighted trade values from 2020–2024 as the base period to project country-to-country export potential for 2030, these inputs are operationalized through calculated drivers such as gravity model parameters, tariff impact factors, and projected GDP per-capita growth. Through an analysis of hidden potentials, demand hotspots, and market conditions that are most favorable to success, this method enables firms to focus on target countries, maximize returns, and global expansion with data, backed by accuracy.
By factoring in the projected importer demand gap that is currently unmet and could be potential opportunity, it identifies the potential for the Exporter (Country) among 190 countries, against the general trade analysis, which identifies the biggest importer or exporter.
To discover high-growth global markets and optimize your business strategy:
Click Here
Pricing
- Single User License$ 1,995
- Department License$ 2,400
- Site License$ 3,120
- Global License$ 3,795

Leadership Perspectives from Industry Events
Search
Thought Leadership and Analyst Meet


Our Clients
6WResearch In News
- India Air Conditioner Market Set for Strong Rebound in 2026 After Weather-Led Correction and GST-Driven Recovery: 6Wresearch
- ADAS in India: How Automatic Emergency Braking, Blind Spot Detection & Driver Monitoring are Transforming Road Safety
- Doha a strategic location for EV manufacturing hub: IPA Qatar
- Demand for luxury TVs surging in the GCC, says Samsung
- Empowering Growth: The Thriving Journey of Bangladesh’s Cable Industry
- Demand for luxury TVs surging in the GCC, says Samsung
Latest Reports
- Nicaragua RPG Gaming Market (2026-2032)
- New Zealand RPG Gaming Market (2026-2032)
- Netherlands RPG Gaming Market (2026-2032)
- Nauru RPG Gaming Market (2026-2032)
- Namibia RPG Gaming Market (2026-2032)
- Mozambique RPG Gaming Market (2026-2032)
- Montenegro RPG Gaming Market (2026-2032)
- Mongolia RPG Gaming Market (2026-2032)
- Monaco RPG Gaming Market (2026-2032)
- Micronesia RPG Gaming Market (2026-2032)
Industry Events and Analyst Meet

HIMTEX 2026

India Refining Summit 2026

India EV Show 2026

EV tech India Expo 2026

Auto Tech Asia 2026
Whitepaper
- Middle East & Africa Commercial Security Market Click here to view more.
- Middle East & Africa Fire Safety Systems & Equipment Market Click here to view more.
- GCC Drone Market Click here to view more.
- Middle East Lighting Fixture Market Click here to view more.
- GCC Physical & Perimeter Security Market Click here to view more.