Australia Neutral Ramming Mass Market (2026-2032) | Size & Revenue, Analysis, Share, Growth, Competitive Landscape, Value, Outlook, Industry, Trends, Segmentation, Companies, Forecast
Market Forecast By Type (High Alumina Ramming Mass, Monolithic Ramming Mass, Spinel Ramming Mass, Others), By Silica Content (Up to 80%, >80% to 85%, >85%), By Application (Induction Furnaces, Electric Arc Furnaces (EAF), Crucibles, Cupola Furnaces, Others), By End-use (Metallurgy, Glass, Chemical, Others) And Competitive Landscape
| Product Code: ETC6186178 | Publication Date: Sep 2024 | Updated Date: Mar 2026 | Product Type: Market Research Report | |
| Publisher: 6Wresearch | Author: Ravi Bhandari | No. of Pages: 75 | No. of Figures: 35 | No. of Tables: 20 |
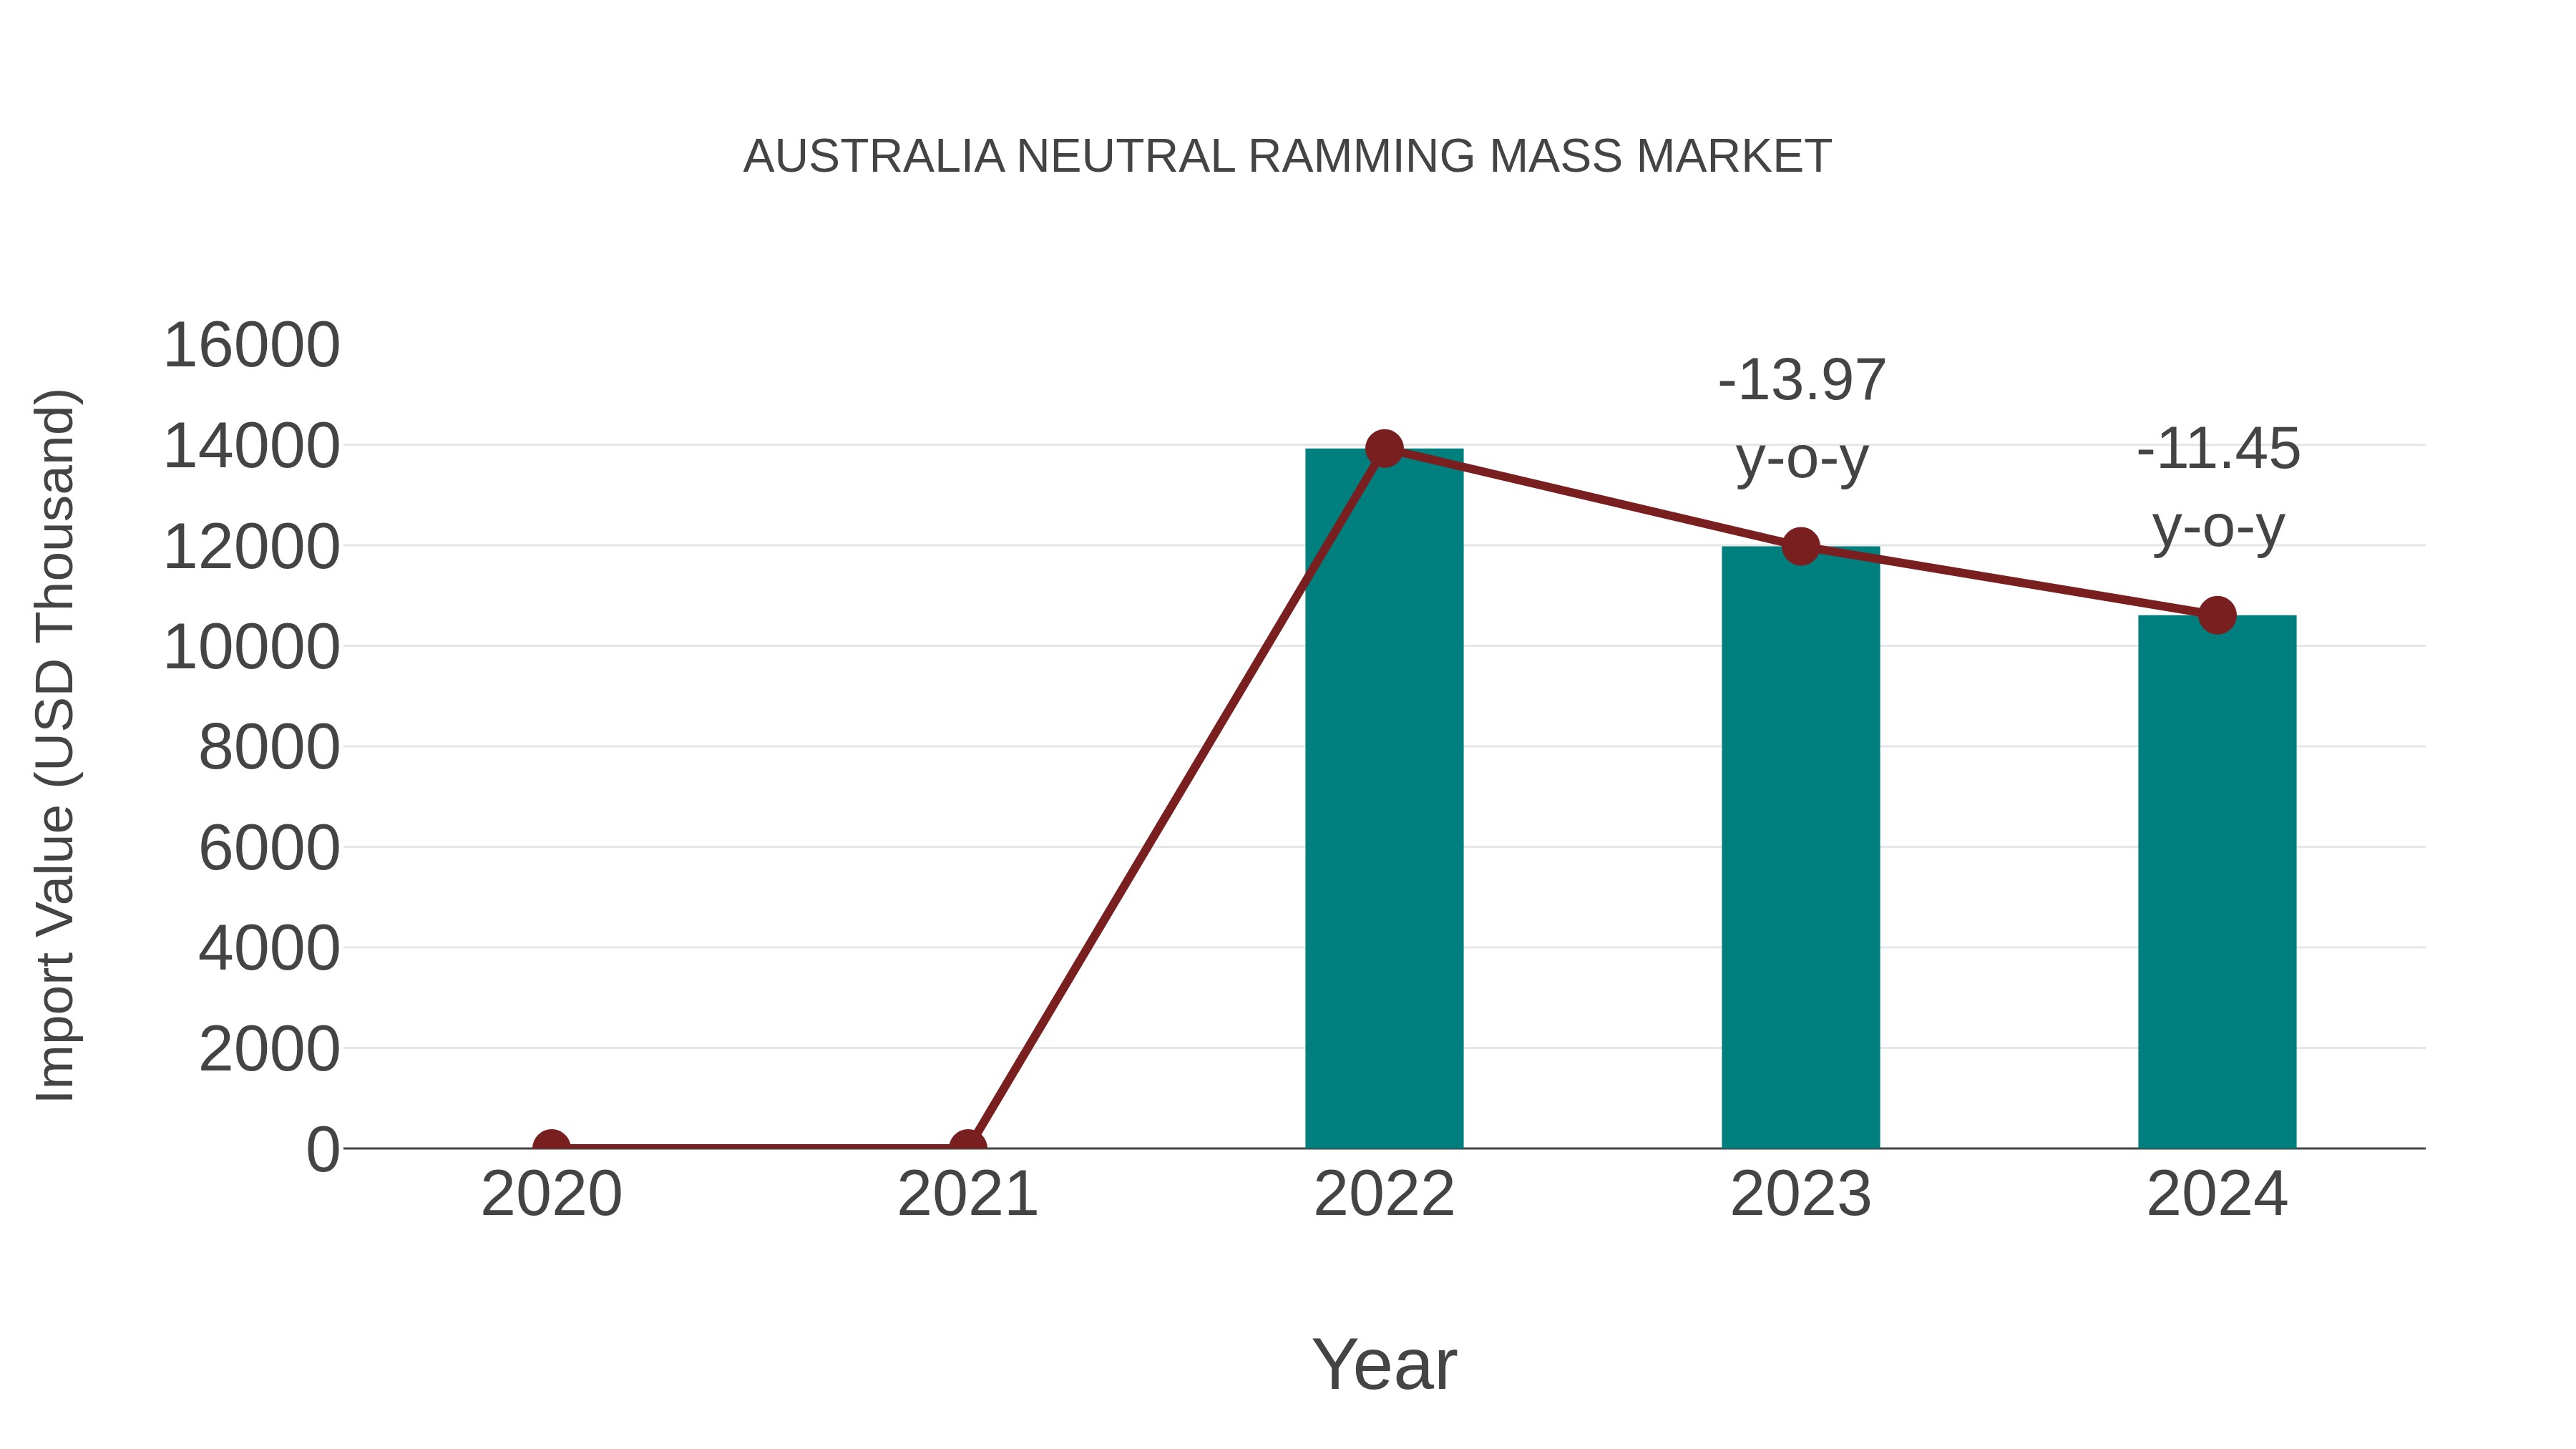
Australia Neutral Ramming Mass Market: Import Trend Analysis
In the Australia neutral ramming mass market, the import trend experienced a decline from 2023 to 2024, with a growth rate of -11.45%. The compound annual growth rate (CAGR) for the period 2020-2024 stood at -12.72%. This decline could be attributed to shifting demand dynamics or changes in trade policies impacting market stability.
Australia Neutral Ramming Mass Market Overview
In Australia, the neutral ramming mass market is driven by the steel and non-ferrous industries, where ramming masses are used in the lining of furnaces and kilns. The growth of the steel sector, particularly in construction and infrastructure projects, has positively influenced demand for high-quality ramming masses. Neutral ramming masses are vital for providing thermal insulation and resistance to abrasion, making them crucial for enhancing the performance of furnaces in high-temperature environments. Additionally, increasing industrialization and manufacturing in Australia contribute to the rising demand for these materials.
Trends of the market
In the Australia neutral ramming mass market, trends indicate a steady demand, primarily from the steel and metal industries. Neutral ramming masses are used in the lining of furnaces and are integral to ensuring better heat retention and reducing wear and tear. The growing construction and manufacturing sectors in Australia are driving the market as industries look for more durable and efficient materials for their operations.
Challenges of the market
In the neutral ramming mass market, challenges include fluctuating raw material prices, maintaining consistent quality standards, and the need to comply with stringent industrial regulations. Additionally, competition from low-cost imports affects the profit margins of local manufacturers.
Investment opportunities in the Market
Australias metallurgical sector, especially steel and ferroalloy manufacturing, presents a solid base for the neutral ramming mass market. Investment opportunities lie in developing high-purity, low-impurity ramming masses tailored for local industries. As foundries and furnace-based operations modernize, there`s a strong incentive to establish localized supply chains to meet increasing demand with consistent quality.
Government Policy of the market
The Neutral Ramming Mass Market in Australia is indirectly governed by mining and industrial material regulations. Standards related to the mining and processing of refractory minerals are enforced by Safe Work Australia and state mining departments, focusing on worker safety, environmental protection, and sustainable mining practices.
Key Highlights of the Report:
- Australia Neutral Ramming Mass Market Outlook
- Market Size of Australia Neutral Ramming Mass Market, 2025
- Forecast of Australia Neutral Ramming Mass Market, 2032
- Historical Data and Forecast of Australia Neutral Ramming Mass Revenues & Volume for the Period 2022 - 2032F
- Australia Neutral Ramming Mass Market Trend Evolution
- Australia Neutral Ramming Mass Market Drivers and Challenges
- Australia Neutral Ramming Mass Price Trends
- Australia Neutral Ramming Mass Porter's Five Forces
- Australia Neutral Ramming Mass Industry Life Cycle
- Historical Data and Forecast of Australia Neutral Ramming Mass Market Revenues & Volume By Type for the Period 2022 - 2032F
- Historical Data and Forecast of Australia Neutral Ramming Mass Market Revenues & Volume By High Alumina Ramming Mass for the Period 2022 - 2032F
- Historical Data and Forecast of Australia Neutral Ramming Mass Market Revenues & Volume By Monolithic Ramming Mass for the Period 2022 - 2032F
- Historical Data and Forecast of Australia Neutral Ramming Mass Market Revenues & Volume By Spinel Ramming Mass for the Period 2022 - 2032F
- Historical Data and Forecast of Australia Neutral Ramming Mass Market Revenues & Volume By Others for the Period 2022 - 2032F
- Historical Data and Forecast of Australia Neutral Ramming Mass Market Revenues & Volume By Silica Content for the Period 2022 - 2032F
- Historical Data and Forecast of Australia Neutral Ramming Mass Market Revenues & Volume By Up to 80% for the Period 2022 - 2032F
- Historical Data and Forecast of Australia Neutral Ramming Mass Market Revenues & Volume By >80% to 85% for the Period 2022 - 2032F
- Historical Data and Forecast of Australia Neutral Ramming Mass Market Revenues & Volume By >85% for the Period 2022 - 2032F
- Historical Data and Forecast of Australia Neutral Ramming Mass Market Revenues & Volume By Application for the Period 2022 - 2032F
- Historical Data and Forecast of Australia Neutral Ramming Mass Market Revenues & Volume By Induction Furnaces for the Period 2022 - 2032F
- Historical Data and Forecast of Australia Neutral Ramming Mass Market Revenues & Volume By Electric Arc Furnaces (EAF) for the Period 2022 - 2032F
- Historical Data and Forecast of Australia Neutral Ramming Mass Market Revenues & Volume By Crucibles for the Period 2022 - 2032F
- Historical Data and Forecast of Australia Neutral Ramming Mass Market Revenues & Volume By Cupola Furnaces for the Period 2022 - 2032F
- Historical Data and Forecast of Australia Neutral Ramming Mass Market Revenues & Volume By Others for the Period 2022 - 2032F
- Historical Data and Forecast of Australia Neutral Ramming Mass Market Revenues & Volume By End-use for the Period 2022 - 2032F
- Historical Data and Forecast of Australia Neutral Ramming Mass Market Revenues & Volume By Metallurgy for the Period 2022 - 2032F
- Historical Data and Forecast of Australia Neutral Ramming Mass Market Revenues & Volume By Glass for the Period 2022 - 2032F
- Historical Data and Forecast of Australia Neutral Ramming Mass Market Revenues & Volume By Chemical for the Period 2022 - 2032F
- Historical Data and Forecast of Australia Neutral Ramming Mass Market Revenues & Volume By Others for the Period 2022 - 2032F
- Australia Neutral Ramming Mass Import Export Trade Statistics
- Market Opportunity Assessment By Type
- Market Opportunity Assessment By Silica Content
- Market Opportunity Assessment By Application
- Market Opportunity Assessment By End-use
- Australia Neutral Ramming Mass Top Companies Market Share
- Australia Neutral Ramming Mass Competitive Benchmarking By Technical and Operational Parameters
- Australia Neutral Ramming Mass Company Profiles
- Australia Neutral Ramming Mass Key Strategic Recommendations
Australia Neutral Ramming Mass Market (2026-2032): FAQs
6Wresearch actively monitors the Australia Neutral Ramming Mass Market and publishes its comprehensive annual report, highlighting emerging trends, growth drivers, revenue analysis, and forecast outlook. Our insights help businesses to make data-backed strategic decisions with ongoing market dynamics. Our analysts track relevent industries related to the Australia Neutral Ramming Mass Market, allowing our clients with actionable intelligence and reliable forecasts tailored to emerging regional needs.
Yes, we provide customisation as per your requirements. To learn more, feel free to contact us on sales@6wresearch.com
1 Executive Summary |
2 Introduction |
2.1 Key Highlights of the Report |
2.2 Report Description |
2.3 Market Scope & Segmentation |
2.4 Research Methodology |
2.5 Assumptions |
3 Australia Neutral Ramming Mass Market Overview |
3.1 Australia Country Macro Economic Indicators |
3.2 Australia Neutral Ramming Mass Market Revenues & Volume, 2022 & 2032F |
3.3 Australia Neutral Ramming Mass Market - Industry Life Cycle |
3.4 Australia Neutral Ramming Mass Market - Porter's Five Forces |
3.5 Australia Neutral Ramming Mass Market Revenues & Volume Share, By Type, 2022 & 2032F |
3.6 Australia Neutral Ramming Mass Market Revenues & Volume Share, By Silica Content, 2022 & 2032F |
3.7 Australia Neutral Ramming Mass Market Revenues & Volume Share, By Application, 2022 & 2032F |
3.8 Australia Neutral Ramming Mass Market Revenues & Volume Share, By End-use, 2022 & 2032F |
4 Australia Neutral Ramming Mass Market Dynamics |
4.1 Impact Analysis |
4.2 Market Drivers |
4.2.1 Increasing demand for steel production in Australia |
4.2.2 Growth in the construction industry leading to higher demand for refractory materials |
4.2.3 Technological advancements in neutral ramming mass products |
4.3 Market Restraints |
4.3.1 Fluctuating raw material prices affecting production costs |
4.3.2 Environmental regulations impacting the manufacturing process |
4.3.3 Competition from alternative refractory materials |
5 Australia Neutral Ramming Mass Market Trends |
6 Australia Neutral Ramming Mass Market, By Types |
6.1 Australia Neutral Ramming Mass Market, By Type |
6.1.1 Overview and Analysis |
6.1.2 Australia Neutral Ramming Mass Market Revenues & Volume, By Type, 2022 - 2032F |
6.1.3 Australia Neutral Ramming Mass Market Revenues & Volume, By High Alumina Ramming Mass, 2022 - 2032F |
6.1.4 Australia Neutral Ramming Mass Market Revenues & Volume, By Monolithic Ramming Mass, 2022 - 2032F |
6.1.5 Australia Neutral Ramming Mass Market Revenues & Volume, By Spinel Ramming Mass, 2022 - 2032F |
6.1.6 Australia Neutral Ramming Mass Market Revenues & Volume, By Others, 2022 - 2032F |
6.2 Australia Neutral Ramming Mass Market, By Silica Content |
6.2.1 Overview and Analysis |
6.2.2 Australia Neutral Ramming Mass Market Revenues & Volume, By Up to 80%, 2022 - 2032F |
6.2.3 Australia Neutral Ramming Mass Market Revenues & Volume, By >80% to 85%, 2022 - 2032F |
6.2.4 Australia Neutral Ramming Mass Market Revenues & Volume, By >85%, 2022 - 2032F |
6.3 Australia Neutral Ramming Mass Market, By Application |
6.3.1 Overview and Analysis |
6.3.2 Australia Neutral Ramming Mass Market Revenues & Volume, By Induction Furnaces, 2022 - 2032F |
6.3.3 Australia Neutral Ramming Mass Market Revenues & Volume, By Electric Arc Furnaces (EAF), 2022 - 2032F |
6.3.4 Australia Neutral Ramming Mass Market Revenues & Volume, By Crucibles, 2022 - 2032F |
6.3.5 Australia Neutral Ramming Mass Market Revenues & Volume, By Cupola Furnaces, 2022 - 2032F |
6.3.6 Australia Neutral Ramming Mass Market Revenues & Volume, By Others, 2022 - 2032F |
6.4 Australia Neutral Ramming Mass Market, By End-use |
6.4.1 Overview and Analysis |
6.4.2 Australia Neutral Ramming Mass Market Revenues & Volume, By Metallurgy, 2022 - 2032F |
6.4.3 Australia Neutral Ramming Mass Market Revenues & Volume, By Glass, 2022 - 2032F |
6.4.4 Australia Neutral Ramming Mass Market Revenues & Volume, By Chemical, 2022 - 2032F |
6.4.5 Australia Neutral Ramming Mass Market Revenues & Volume, By Others, 2022 - 2032F |
7 Australia Neutral Ramming Mass Market Import-Export Trade Statistics |
7.1 Australia Neutral Ramming Mass Market Export to Major Countries |
7.2 Australia Neutral Ramming Mass Market Imports from Major Countries |
8 Australia Neutral Ramming Mass Market Key Performance Indicators |
8.1 Average selling price of neutral ramming mass products |
8.2 Number of new product innovations and developments |
8.3 Customer satisfaction and retention rates |
8.4 Adoption rate of environmentally friendly manufacturing practices |
8.5 Number of strategic partnerships and collaborations for market expansion |
9 Australia Neutral Ramming Mass Market - Opportunity Assessment |
9.1 Australia Neutral Ramming Mass Market Opportunity Assessment, By Type, 2022 & 2032F |
9.2 Australia Neutral Ramming Mass Market Opportunity Assessment, By Silica Content, 2022 & 2032F |
9.3 Australia Neutral Ramming Mass Market Opportunity Assessment, By Application, 2022 & 2032F |
9.4 Australia Neutral Ramming Mass Market Opportunity Assessment, By End-use, 2022 & 2032F |
10 Australia Neutral Ramming Mass Market - Competitive Landscape |
10.1 Australia Neutral Ramming Mass Market Revenue Share, By Companies, 2025 |
10.2 Australia Neutral Ramming Mass Market Competitive Benchmarking, By Operating and Technical Parameters |
11 Company Profiles |
12 Recommendations |
13 Disclaimer |
Export potential assessment - trade Analytics for 2030
Export potential enables firms to identify high-growth global markets with greater confidence by combining advanced trade intelligence with a structured quantitative methodology. The framework analyzes emerging demand trends and country-level import patterns while integrating macroeconomic and trade datasets such as GDP and population forecasts, bilateral import–export flows, tariff structures, elasticity differentials between developed and developing economies, geographic distance, and import demand projections. Using weighted trade values from 2020–2024 as the base period to project country-to-country export potential for 2030, these inputs are operationalized through calculated drivers such as gravity model parameters, tariff impact factors, and projected GDP per-capita growth. Through an analysis of hidden potentials, demand hotspots, and market conditions that are most favorable to success, this method enables firms to focus on target countries, maximize returns, and global expansion with data, backed by accuracy.
By factoring in the projected importer demand gap that is currently unmet and could be potential opportunity, it identifies the potential for the Exporter (Country) among 190 countries, against the general trade analysis, which identifies the biggest importer or exporter.
To discover high-growth global markets and optimize your business strategy:
Click Here
Pricing
- Single User License$ 1,995
- Department License$ 2,400
- Site License$ 3,120
- Global License$ 3,795

Search
Thought Leadership and Analyst Meet


Our Clients
Latest Reports
- Canada Cloud CFD Market (2026-2032) | Size & Revenue, Industry, Growth, Competitive Landscape, Forecast, Segmentation, Value, Outlook, Trends, Share, Analysis, Companies
- Taiwan Food Delivery Platform Market (2026-2032) | Companies, Outlook, Analysis, Trends, Value, Revenue, Segmentation, Share, Forecast, Competitive Landscape, Growth, Size & Forecast
- United Kingdom (UK) Long-term Care Insurance Market (2026-2032) | Growth, Share, Consumer Insights, Drivers, Opportunities, Competition, Pricing Analysis, Segments, Restraints, Companies, Competitive, Value, Outlook, Size, Demand, Analysis, Challenges, Strategic Insights, Investment Trends, Revenue, Trends, Supply, Forecast
- United Kingdom (UK) Long Term Care Market (2026-2032) | Companies, Outlook, Analysis, Trends, Value, Revenue, Segmentation, Share, Forecast, Competitive Landscape, Growth, Size & Forecast
- Iraq Insulation and Waterproofing Market (2026-2032) | Outlook, Drivers, Growth, Size, Share, Industry, Revenue, Trends, Demand, Competitive, Strategic Insights, Opportunities, Segments, Companies, Challenges, Strategy, Consumer Insights, Analysis, Investment Trends, Value, Segmentation, Forecast, Restraints
- India Switchgear Market Outlook (2026-2032) | Size, Share, Trends, Growth, Revenue, Forecast, Analysis, Value, Outlook
- Pakistan Contraceptive Implants Market (2025-2031) | Demand, Growth, Size, Share, Industry, Pricing Analysis, Competitive, Strategic Insights, Strategy, Consumer Insights, Analysis, Investment Trends, Opportunities, Revenue, Segments, Value, Segmentation, Supply, Forecast, Restraints, Outlook, Competition, Drivers, Trends, Companies, Challenges
- Sri Lanka Packaging Market (2026-2032) | Outlook, Competition, Drivers, Trends, Demand, Pricing Analysis, Competitive, Strategic Insights, Companies, Challenges, Strategy, Consumer Insights, Analysis, Investment Trends, Opportunities, Growth, Size, Share, Industry, Revenue, Segments, Value, Segmentation, Supply, Forecast, Restraints
- India Kids Watches Market (2026-2032) | Strategy, Consumer Insights, Analysis, Investment Trends, Opportunities, Growth, Size, Share, Industry, Revenue, Segments, Value, Segmentation, Supply, Forecast, Restraints, Outlook, Competition, Drivers, Trends, Demand, Pricing Analysis, Competitive, Strategic Insights, Companies, Challenges
- Saudi Arabia Core Assurance Service Market (2025-2031) | Strategy, Consumer Insights, Analysis, Investment Trends, Opportunities, Growth, Size, Share, Industry, Revenue, Segments, Value, Segmentation, Supply, Forecast, Restraints, Outlook, Competition, Drivers, Trends, Demand, Pricing Analysis, Competitive, Strategic Insights, Companies, Challenges
Industry Events and Analyst Meet

India EV Show 2026

EV tech India Expo 2026

Auto Tech Asia 2026

Battery Tech India 2026

Smart Production Solutions Guangzhou 2026
Whitepaper
- Middle East & Africa Commercial Security Market Click here to view more.
- Middle East & Africa Fire Safety Systems & Equipment Market Click here to view more.
- GCC Drone Market Click here to view more.
- Middle East Lighting Fixture Market Click here to view more.
- GCC Physical & Perimeter Security Market Click here to view more.
6WResearch In News
- Doha a strategic location for EV manufacturing hub: IPA Qatar
- Demand for luxury TVs surging in the GCC, says Samsung
- Empowering Growth: The Thriving Journey of Bangladesh’s Cable Industry
- Demand for luxury TVs surging in the GCC, says Samsung
- Video call with a traditional healer? Once unthinkable, it’s now common in South Africa
- Intelligent Buildings To Smooth GCC’s Path To Net Zero