Australia Non-Dairy Beverages Market (2026-2032) | Outlook, Analysis, Growth, Companies, Share, Competitive Landscape, Size & Revenue, Trends, Segmentation, Value, Forecast, Industry
Market Forecast By Source (Fruits, Vegetables, Cereals, Other), By Type (Dairy Free Drinkable Yogurts, Fermented Soft Drinks, Fermented Juices, Non-Dairy Kefir), By Distribution Channel (Online Retail, Supermarket/Hypermarket, Specialty Stores, Departmental Stores, Others) And Competitive Landscape
| Product Code: ETC6186309 | Publication Date: Sep 2024 | Updated Date: Mar 2026 | Product Type: Market Research Report | |
| Publisher: 6Wresearch | Author: Shubham Deep | No. of Pages: 75 | No. of Figures: 35 | No. of Tables: 20 |
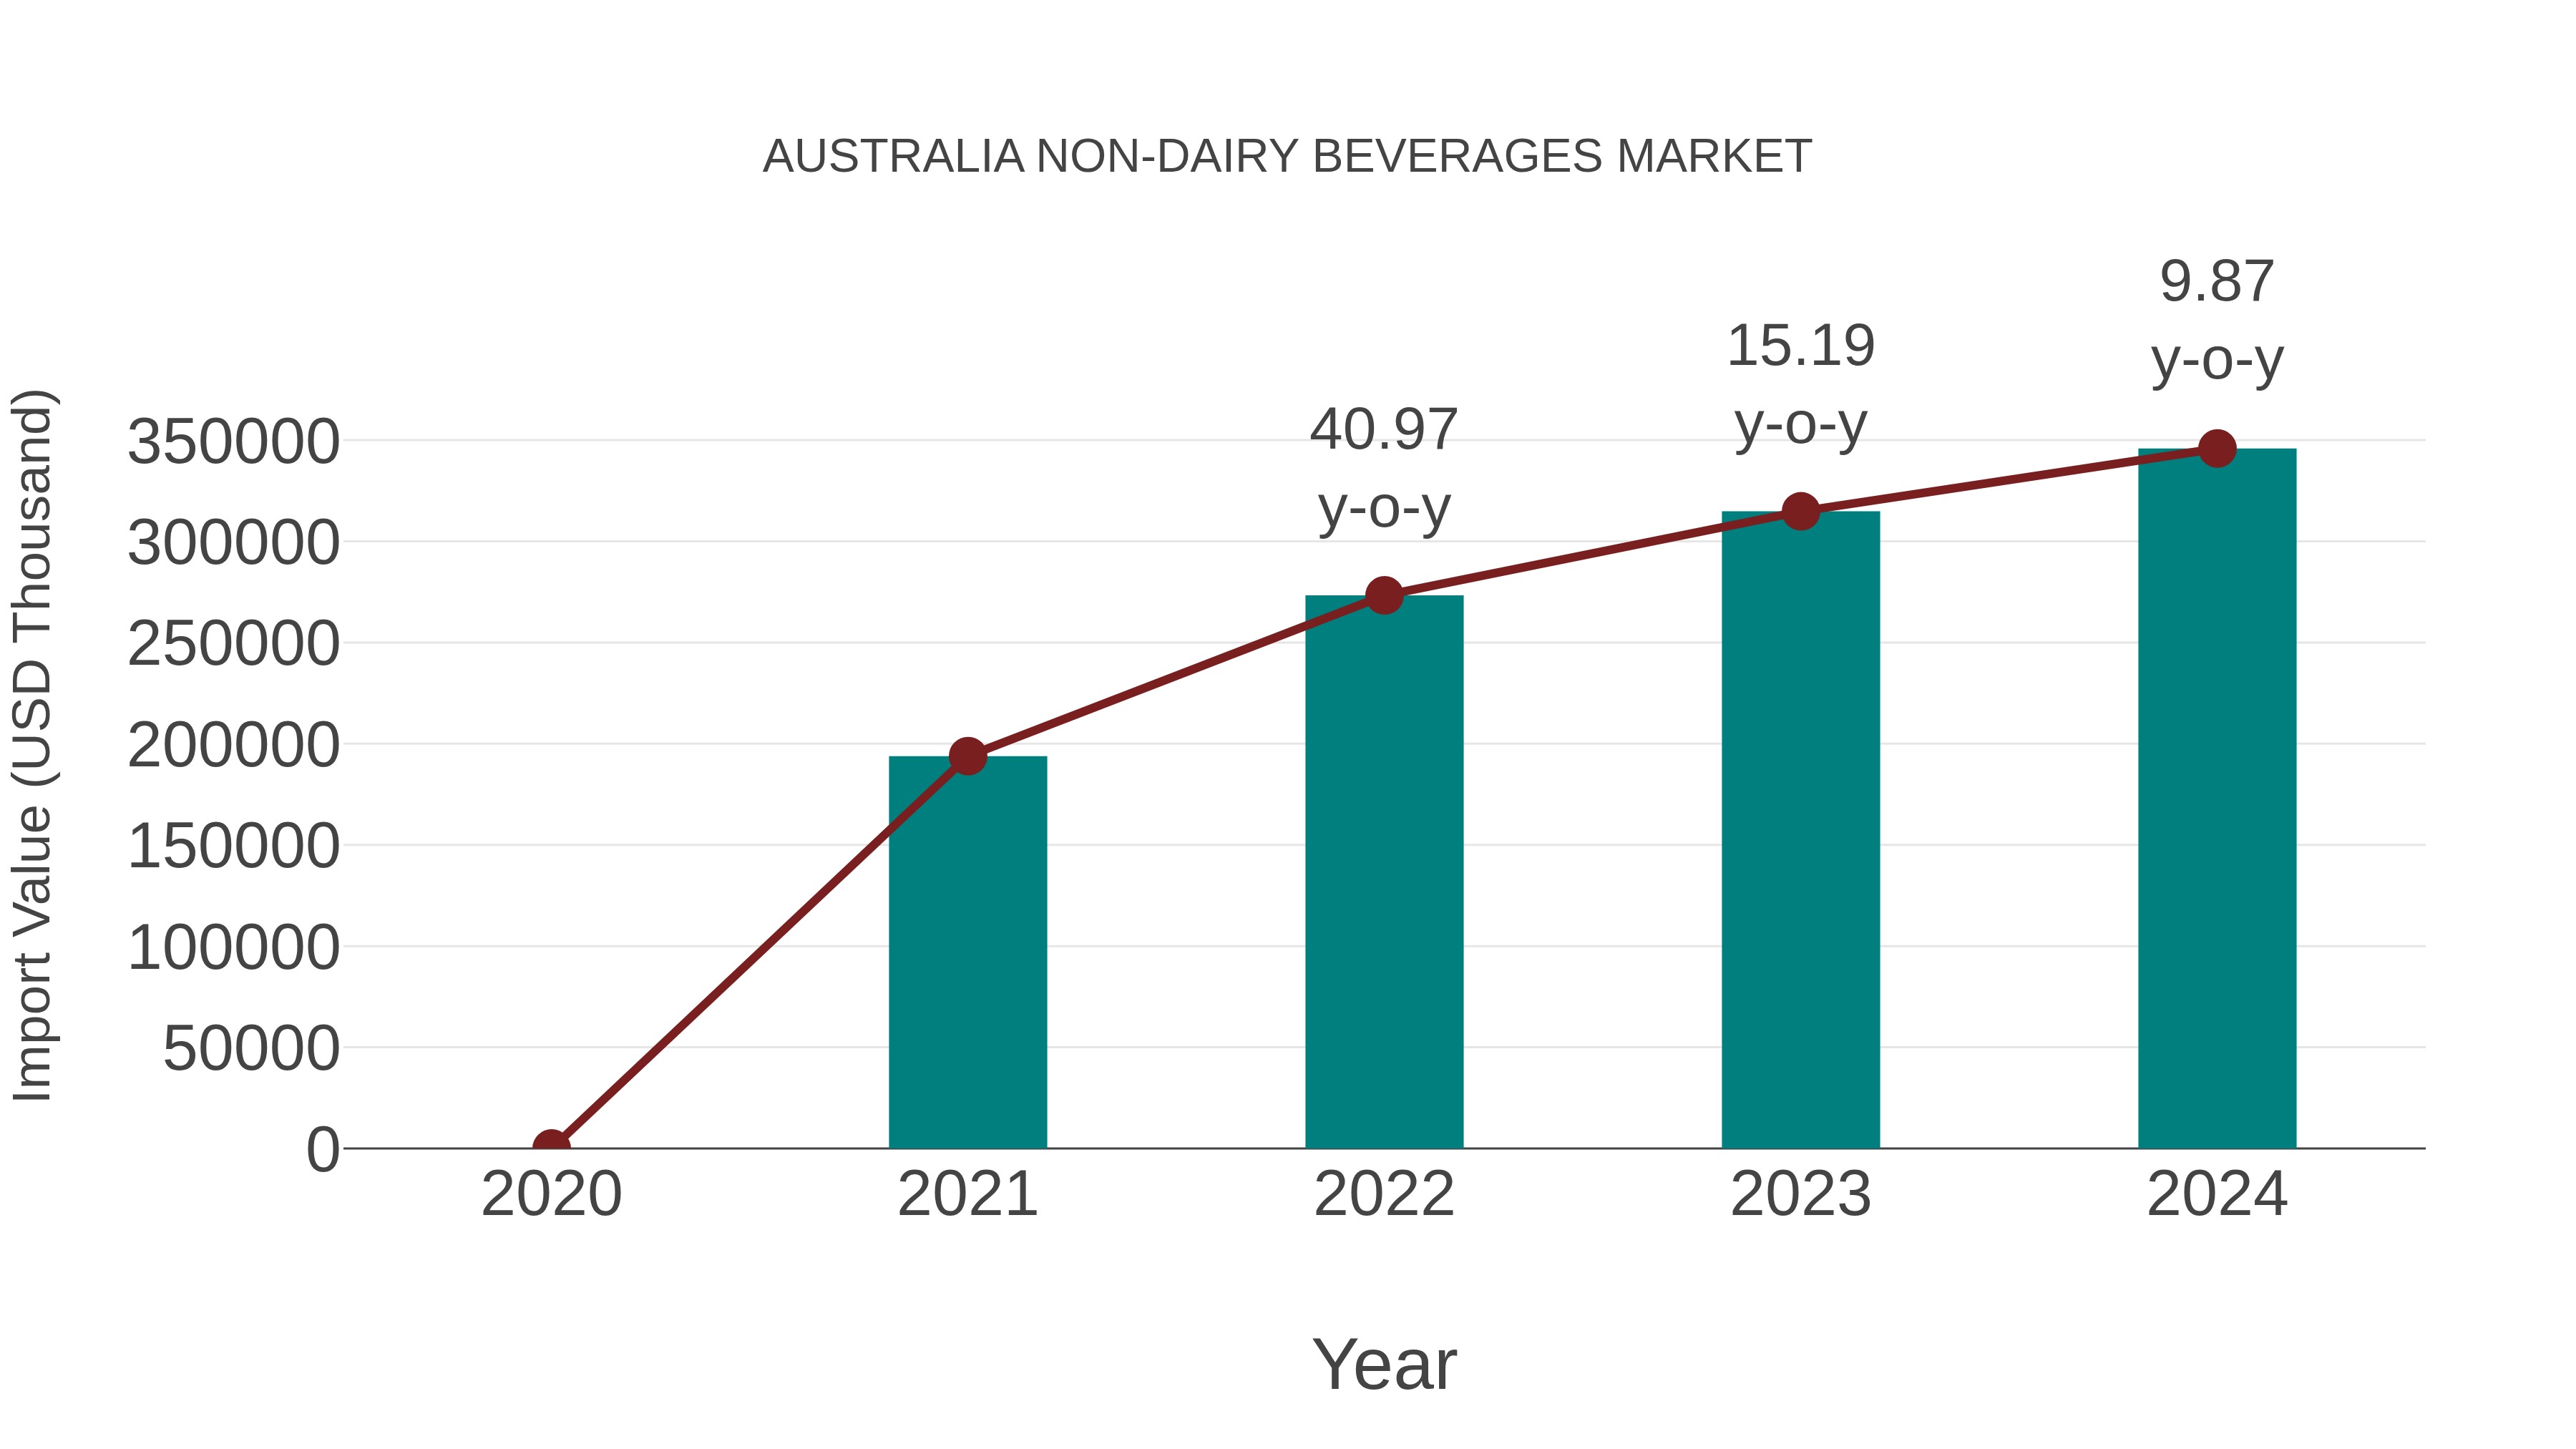
Australia Non-dairy Beverages Market: Import Trend Analysis
Australia`s non-dairy beverages market witnessed an import growth rate of 9.87% from 2023 to 2024, with a compound annual growth rate (CAGR) of 21.29% for the period 2020-2024. This significant increase in imports can be attributed to shifting consumer preferences towards healthier alternatives and the expanding variety of non-dairy beverage options available in the market.
Australia Non Dairy Beverages Market Overview
The non-dairy beverages market in Australia is growing rapidly due to rising health consciousness and increased demand for plant-based alternatives. Products such as almond milk, soy milk, and oat milk are gaining popularity among lactose-intolerant and vegan consumers. Manufacturers are innovating with new flavors and fortified options to cater to evolving consumer preferences.
Drivers of the market
The non-dairy beverages market in Australia is driven by increasing demand for plant-based and lactose-free alternatives. Rising health consciousness, growing vegan population, and increasing availability of almond, soy, oat, and coconut-based beverages are fueling market growth. Expanding product innovation, increasing investment in functional and fortified beverages, and rising distribution through retail and e-commerce channels are also supporting market expansion.
Challenges of the market
The non-dairy beverages market in Australia faces challenges from high production costs due to the need for specialized ingredients and processing. Regulatory requirements for food safety, labeling, and nutritional content increase production complexity. Competition from traditional dairy beverages and other plant-based alternatives reduces market demand. Consumer preference for taste and texture consistency further complicates product acceptance.
Investment opportunities in the Market
The non-dairy beverages market in Australia is expanding due to increasing demand for plant-based alternatives to milk. Almond, oat, and soy milk are leading the market. Investment opportunities exist in developing fortified and flavored non-dairy beverages, expanding distribution channels, and improving product shelf life. Growth in veganism and lactose intolerance awareness is driving market demand.
Government Policy of the market
Non-dairy beverages, including plant-based milks and nut-based drinks, are regulated by Food Standards Australia New Zealand (FSANZ) for ingredient labeling, nutritional content, and allergen warnings. Import and export of non-dairy beverages are controlled under food safety and trade regulations. The government provides incentives for the development of new non-dairy beverage formulations through the Modern Manufacturing Initiative. Advertising and health claims for non-dairy beverages are monitored by the Australian Competition and Consumer Commission (ACCC).
Key Highlights of the Report:
- Australia Non-Dairy Beverages Market Outlook
- Market Size of Australia Non-Dairy Beverages Market, 2025
- Forecast of Australia Non-Dairy Beverages Market, 2032
- Historical Data and Forecast of Australia Non-Dairy Beverages Revenues & Volume for the Period 2022 - 2032F
- Australia Non-Dairy Beverages Market Trend Evolution
- Australia Non-Dairy Beverages Market Drivers and Challenges
- Australia Non-Dairy Beverages Price Trends
- Australia Non-Dairy Beverages Porter's Five Forces
- Australia Non-Dairy Beverages Industry Life Cycle
- Historical Data and Forecast of Australia Non-Dairy Beverages Market Revenues & Volume By Source for the Period 2022 - 2032F
- Historical Data and Forecast of Australia Non-Dairy Beverages Market Revenues & Volume By Fruits for the Period 2022 - 2032F
- Historical Data and Forecast of Australia Non-Dairy Beverages Market Revenues & Volume By Vegetables for the Period 2022 - 2032F
- Historical Data and Forecast of Australia Non-Dairy Beverages Market Revenues & Volume By Cereals for the Period 2022 - 2032F
- Historical Data and Forecast of Australia Non-Dairy Beverages Market Revenues & Volume By Other for the Period 2022 - 2032F
- Historical Data and Forecast of Australia Non-Dairy Beverages Market Revenues & Volume By Type for the Period 2022 - 2032F
- Historical Data and Forecast of Australia Non-Dairy Beverages Market Revenues & Volume By Dairy Free Drinkable Yogurts for the Period 2022 - 2032F
- Historical Data and Forecast of Australia Non-Dairy Beverages Market Revenues & Volume By Fermented Soft Drinks for the Period 2022 - 2032F
- Historical Data and Forecast of Australia Non-Dairy Beverages Market Revenues & Volume By Fermented Juices for the Period 2022 - 2032F
- Historical Data and Forecast of Australia Non-Dairy Beverages Market Revenues & Volume By Non-Dairy Kefir for the Period 2022 - 2032F
- Historical Data and Forecast of Australia Non-Dairy Beverages Market Revenues & Volume By Distribution Channel for the Period 2022 - 2032F
- Historical Data and Forecast of Australia Non-Dairy Beverages Market Revenues & Volume By Online Retail for the Period 2022 - 2032F
- Historical Data and Forecast of Australia Non-Dairy Beverages Market Revenues & Volume By Supermarket/Hypermarket for the Period 2022 - 2032F
- Historical Data and Forecast of Australia Non-Dairy Beverages Market Revenues & Volume By Specialty Stores for the Period 2022 - 2032F
- Historical Data and Forecast of Australia Non-Dairy Beverages Market Revenues & Volume By Departmental Stores for the Period 2022 - 2032F
- Historical Data and Forecast of Australia Non-Dairy Beverages Market Revenues & Volume By Others for the Period 2022 - 2032F
- Australia Non-Dairy Beverages Import Export Trade Statistics
- Market Opportunity Assessment By Source
- Market Opportunity Assessment By Type
- Market Opportunity Assessment By Distribution Channel
- Australia Non-Dairy Beverages Top Companies Market Share
- Australia Non-Dairy Beverages Competitive Benchmarking By Technical and Operational Parameters
- Australia Non-Dairy Beverages Company Profiles
- Australia Non-Dairy Beverages Key Strategic Recommendations
Australia Non-Dairy Beverages Market (2026-2032): FAQs
6Wresearch actively monitors the Australia Non-Dairy Beverages Market and publishes its comprehensive annual report, highlighting emerging trends, growth drivers, revenue analysis, and forecast outlook. Our insights help businesses to make data-backed strategic decisions with ongoing market dynamics. Our analysts track relevent industries related to the Australia Non-Dairy Beverages Market, allowing our clients with actionable intelligence and reliable forecasts tailored to emerging regional needs.
Yes, we provide customisation as per your requirements. To learn more, feel free to contact us on sales@6wresearch.com
1 Executive Summary |
2 Introduction |
2.1 Key Highlights of the Report |
2.2 Report Description |
2.3 Market Scope & Segmentation |
2.4 Research Methodology |
2.5 Assumptions |
3 Australia Non-Dairy Beverages Market Overview |
3.1 Australia Country Macro Economic Indicators |
3.2 Australia Non-Dairy Beverages Market Revenues & Volume, 2022 & 2032F |
3.3 Australia Non-Dairy Beverages Market - Industry Life Cycle |
3.4 Australia Non-Dairy Beverages Market - Porter's Five Forces |
3.5 Australia Non-Dairy Beverages Market Revenues & Volume Share, By Source, 2022 & 2032F |
3.6 Australia Non-Dairy Beverages Market Revenues & Volume Share, By Type, 2022 & 2032F |
3.7 Australia Non-Dairy Beverages Market Revenues & Volume Share, By Distribution Channel, 2022 & 2032F |
4 Australia Non-Dairy Beverages Market Dynamics |
4.1 Impact Analysis |
4.2 Market Drivers |
4.2.1 Increasing health awareness and preference for plant-based products among consumers |
4.2.2 Growing demand for lactose-free and vegan products |
4.2.3 Rising disposable income leading to higher spending on premium non-dairy beverages |
4.3 Market Restraints |
4.3.1 High competition from established dairy beverage market |
4.3.2 Limited availability of non-dairy beverage options in certain regions |
4.3.3 Fluctuating prices of raw materials impacting production costs |
5 Australia Non-Dairy Beverages Market Trends |
6 Australia Non-Dairy Beverages Market, By Types |
6.1 Australia Non-Dairy Beverages Market, By Source |
6.1.1 Overview and Analysis |
6.1.2 Australia Non-Dairy Beverages Market Revenues & Volume, By Source, 2022 - 2032F |
6.1.3 Australia Non-Dairy Beverages Market Revenues & Volume, By Fruits, 2022 - 2032F |
6.1.4 Australia Non-Dairy Beverages Market Revenues & Volume, By Vegetables, 2022 - 2032F |
6.1.5 Australia Non-Dairy Beverages Market Revenues & Volume, By Cereals, 2022 - 2032F |
6.1.6 Australia Non-Dairy Beverages Market Revenues & Volume, By Other, 2022 - 2032F |
6.2 Australia Non-Dairy Beverages Market, By Type |
6.2.1 Overview and Analysis |
6.2.2 Australia Non-Dairy Beverages Market Revenues & Volume, By Dairy Free Drinkable Yogurts, 2022 - 2032F |
6.2.3 Australia Non-Dairy Beverages Market Revenues & Volume, By Fermented Soft Drinks, 2022 - 2032F |
6.2.4 Australia Non-Dairy Beverages Market Revenues & Volume, By Fermented Juices, 2022 - 2032F |
6.2.5 Australia Non-Dairy Beverages Market Revenues & Volume, By Non-Dairy Kefir, 2022 - 2032F |
6.3 Australia Non-Dairy Beverages Market, By Distribution Channel |
6.3.1 Overview and Analysis |
6.3.2 Australia Non-Dairy Beverages Market Revenues & Volume, By Online Retail, 2022 - 2032F |
6.3.3 Australia Non-Dairy Beverages Market Revenues & Volume, By Supermarket/Hypermarket, 2022 - 2032F |
6.3.4 Australia Non-Dairy Beverages Market Revenues & Volume, By Specialty Stores, 2022 - 2032F |
6.3.5 Australia Non-Dairy Beverages Market Revenues & Volume, By Departmental Stores, 2022 - 2032F |
6.3.6 Australia Non-Dairy Beverages Market Revenues & Volume, By Others, 2022 - 2032F |
7 Australia Non-Dairy Beverages Market Import-Export Trade Statistics |
7.1 Australia Non-Dairy Beverages Market Export to Major Countries |
7.2 Australia Non-Dairy Beverages Market Imports from Major Countries |
8 Australia Non-Dairy Beverages Market Key Performance Indicators |
8.1 Consumer engagement on social media platforms for non-dairy beverages |
8.2 Number of new product launches in the non-dairy beverages segment |
8.3 Percentage increase in non-dairy beverage sales in cafes and restaurants |
8.4 Growth in the number of non-dairy beverage options available in supermarkets and convenience stores |
8.5 Adoption rate of non-dairy beverages by food service establishments |
9 Australia Non-Dairy Beverages Market - Opportunity Assessment |
9.1 Australia Non-Dairy Beverages Market Opportunity Assessment, By Source, 2022 & 2032F |
9.2 Australia Non-Dairy Beverages Market Opportunity Assessment, By Type, 2022 & 2032F |
9.3 Australia Non-Dairy Beverages Market Opportunity Assessment, By Distribution Channel, 2022 & 2032F |
10 Australia Non-Dairy Beverages Market - Competitive Landscape |
10.1 Australia Non-Dairy Beverages Market Revenue Share, By Companies, 2025 |
10.2 Australia Non-Dairy Beverages Market Competitive Benchmarking, By Operating and Technical Parameters |
11 Company Profiles |
12 Recommendations |
13 Disclaimer |
Export potential assessment - trade Analytics for 2030
Export potential enables firms to identify high-growth global markets with greater confidence by combining advanced trade intelligence with a structured quantitative methodology. The framework analyzes emerging demand trends and country-level import patterns while integrating macroeconomic and trade datasets such as GDP and population forecasts, bilateral import–export flows, tariff structures, elasticity differentials between developed and developing economies, geographic distance, and import demand projections. Using weighted trade values from 2020–2024 as the base period to project country-to-country export potential for 2030, these inputs are operationalized through calculated drivers such as gravity model parameters, tariff impact factors, and projected GDP per-capita growth. Through an analysis of hidden potentials, demand hotspots, and market conditions that are most favorable to success, this method enables firms to focus on target countries, maximize returns, and global expansion with data, backed by accuracy.
By factoring in the projected importer demand gap that is currently unmet and could be potential opportunity, it identifies the potential for the Exporter (Country) among 190 countries, against the general trade analysis, which identifies the biggest importer or exporter.
To discover high-growth global markets and optimize your business strategy:
Click Here
Pricing
- Single User License$ 1,995
- Department License$ 2,400
- Site License$ 3,120
- Global License$ 3,795

Search
Thought Leadership and Analyst Meet


Our Clients
Latest Reports
- United Kingdom (UK) Long-term Care Insurance Market (2026-2032) | Growth, Share, Consumer Insights, Drivers, Opportunities, Competition, Pricing Analysis, Segments, Restraints, Companies, Competitive, Value, Outlook, Size, Demand, Analysis, Challenges, Strategic Insights, Investment Trends, Revenue, Trends, Supply, Forecast
- United Kingdom (UK) Long Term Care Market (2026-2032) | Companies, Outlook, Analysis, Trends, Value, Revenue, Segmentation, Share, Forecast, Competitive Landscape, Growth, Size & Forecast
- Iraq Insulation and Waterproofing Market (2026-2032) | Outlook, Drivers, Growth, Size, Share, Industry, Revenue, Trends, Demand, Competitive, Strategic Insights, Opportunities, Segments, Companies, Challenges, Strategy, Consumer Insights, Analysis, Investment Trends, Value, Segmentation, Forecast, Restraints
- India Switchgear Market Outlook (2026 - 2032) | Size, Share, Trends, Growth, Revenue, Forecast, Analysis, Value, Outlook
- Pakistan Contraceptive Implants Market (2025-2031) | Demand, Growth, Size, Share, Industry, Pricing Analysis, Competitive, Strategic Insights, Strategy, Consumer Insights, Analysis, Investment Trends, Opportunities, Revenue, Segments, Value, Segmentation, Supply, Forecast, Restraints, Outlook, Competition, Drivers, Trends, Companies, Challenges
- Sri Lanka Packaging Market (2026-2032) | Outlook, Competition, Drivers, Trends, Demand, Pricing Analysis, Competitive, Strategic Insights, Companies, Challenges, Strategy, Consumer Insights, Analysis, Investment Trends, Opportunities, Growth, Size, Share, Industry, Revenue, Segments, Value, Segmentation, Supply, Forecast, Restraints
- India Kids Watches Market (2026-2032) | Strategy, Consumer Insights, Analysis, Investment Trends, Opportunities, Growth, Size, Share, Industry, Revenue, Segments, Value, Segmentation, Supply, Forecast, Restraints, Outlook, Competition, Drivers, Trends, Demand, Pricing Analysis, Competitive, Strategic Insights, Companies, Challenges
- Saudi Arabia Core Assurance Service Market (2025-2031) | Strategy, Consumer Insights, Analysis, Investment Trends, Opportunities, Growth, Size, Share, Industry, Revenue, Segments, Value, Segmentation, Supply, Forecast, Restraints, Outlook, Competition, Drivers, Trends, Demand, Pricing Analysis, Competitive, Strategic Insights, Companies, Challenges
- Romania Uninterruptible Power Supply (UPS) Market (2026-2032) | Industry, Analysis, Revenue, Size, Forecast, Outlook, Value, Trends, Share, Growth & Companies
- Saudi Arabia Car Window Tinting Film, Paint Protection Film (PPF), and Ceramic Coating Market (2025-2031) | Strategy, Consumer Insights, Analysis, Investment Trends, Opportunities, Growth, Size, Share, Industry, Revenue, Segments, Value, Segmentation, Supply, Forecast, Restraints, Outlook, Competition, Drivers, Trends, Demand, Pricing Analysis, Competitive, Strategic Insights, Companies, Challenges
Industry Events and Analyst Meet

India EV Show 2026

EV tech India Expo 2026

Auto Tech Asia 2026

Battery Tech India 2026

Smart Production Solutions Guangzhou 2026
Whitepaper
- Middle East & Africa Commercial Security Market Click here to view more.
- Middle East & Africa Fire Safety Systems & Equipment Market Click here to view more.
- GCC Drone Market Click here to view more.
- Middle East Lighting Fixture Market Click here to view more.
- GCC Physical & Perimeter Security Market Click here to view more.
6WResearch In News
- Doha a strategic location for EV manufacturing hub: IPA Qatar
- Demand for luxury TVs surging in the GCC, says Samsung
- Empowering Growth: The Thriving Journey of Bangladesh’s Cable Industry
- Demand for luxury TVs surging in the GCC, says Samsung
- Video call with a traditional healer? Once unthinkable, it’s now common in South Africa
- Intelligent Buildings To Smooth GCC’s Path To Net Zero